

Below is an assessment of the performance of some of the most important sectors and asset classes relative to each other with an interpretation of what underlying market dynamics may be signaling about the future direction of risk-taking by investors. The below charts are all price ratios which show the underlying trend of the numerator relative to the denominator. A rising price ratio means the numerator is outperforming (up more/down less) the denominator. A falling price ratio means underperformance.
LEADERS: RISK-ON IS BACK ON
Technology (XLK) – The Mag 7 Remind The Market Why They’re The Leaders
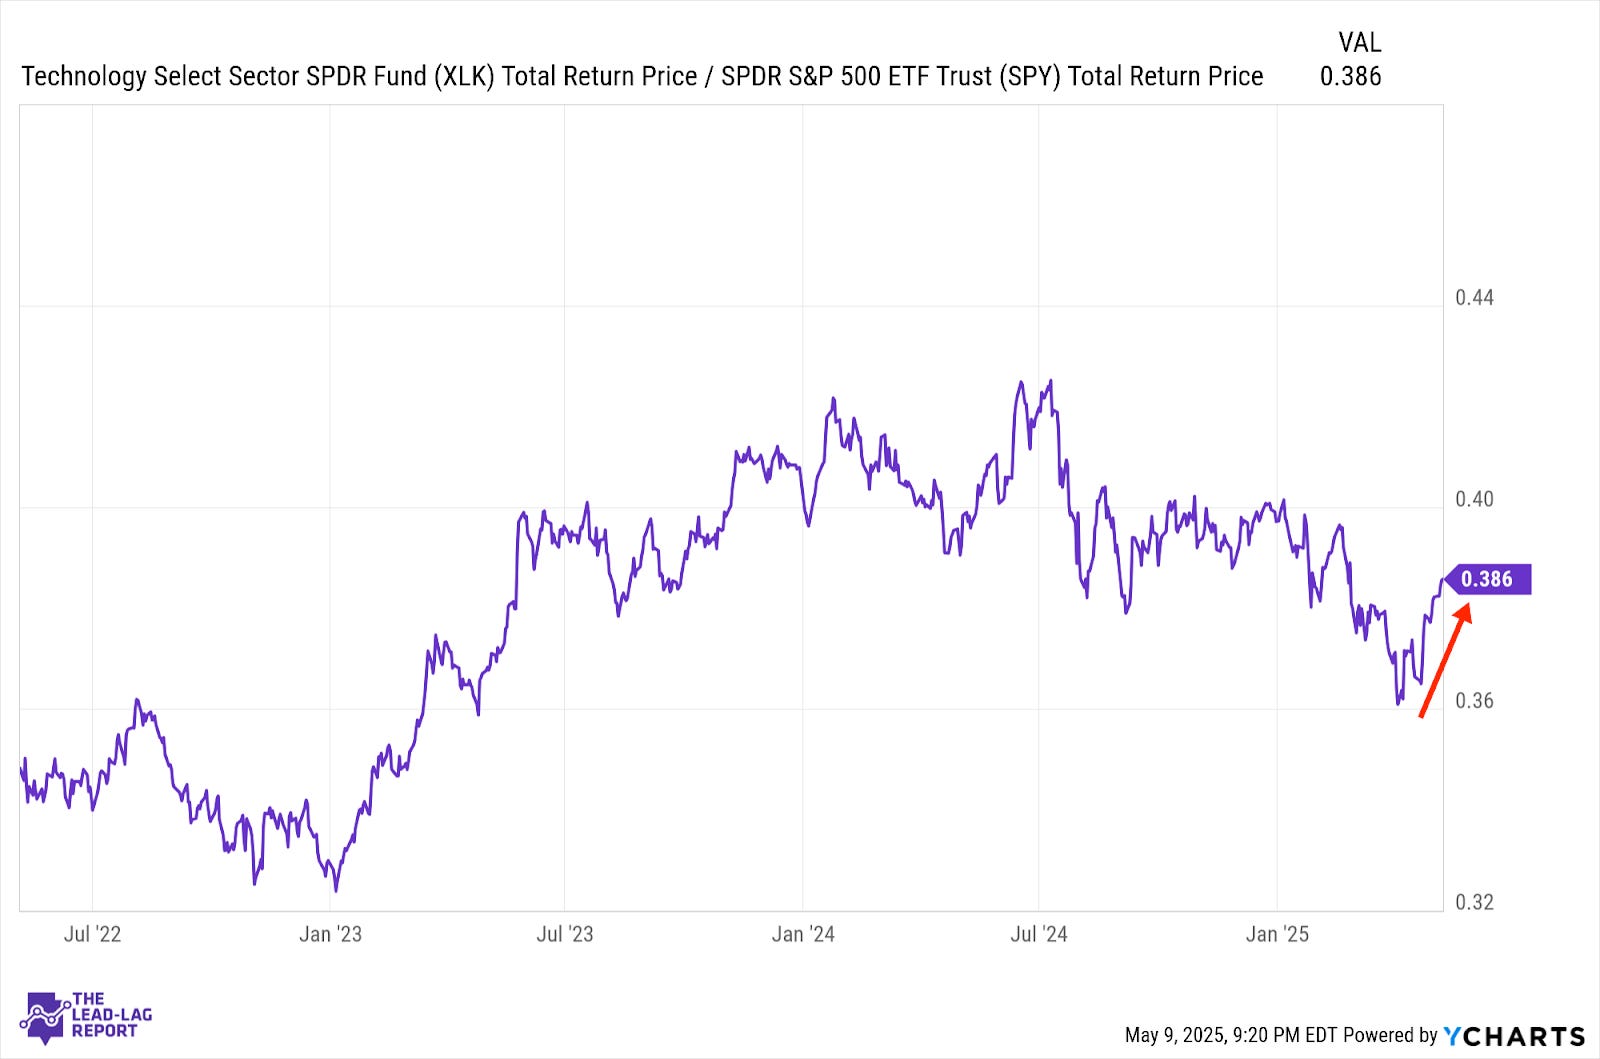
With trade war sentiment beginning to look brighter and tariffs suspended between the U.S. and China, risk assets are finding some positive momentum again. Tech probably would’ve enjoyed some short-term outperformance regardless of idiosyncratic considerations here, but the fact that the magnificent 7 names largely came through on earnings and continue to plow forward investing and developing data center capacity and AI infrastructure added another tailwind.
Consumer Discretionary (XLY) – Breakout Potential
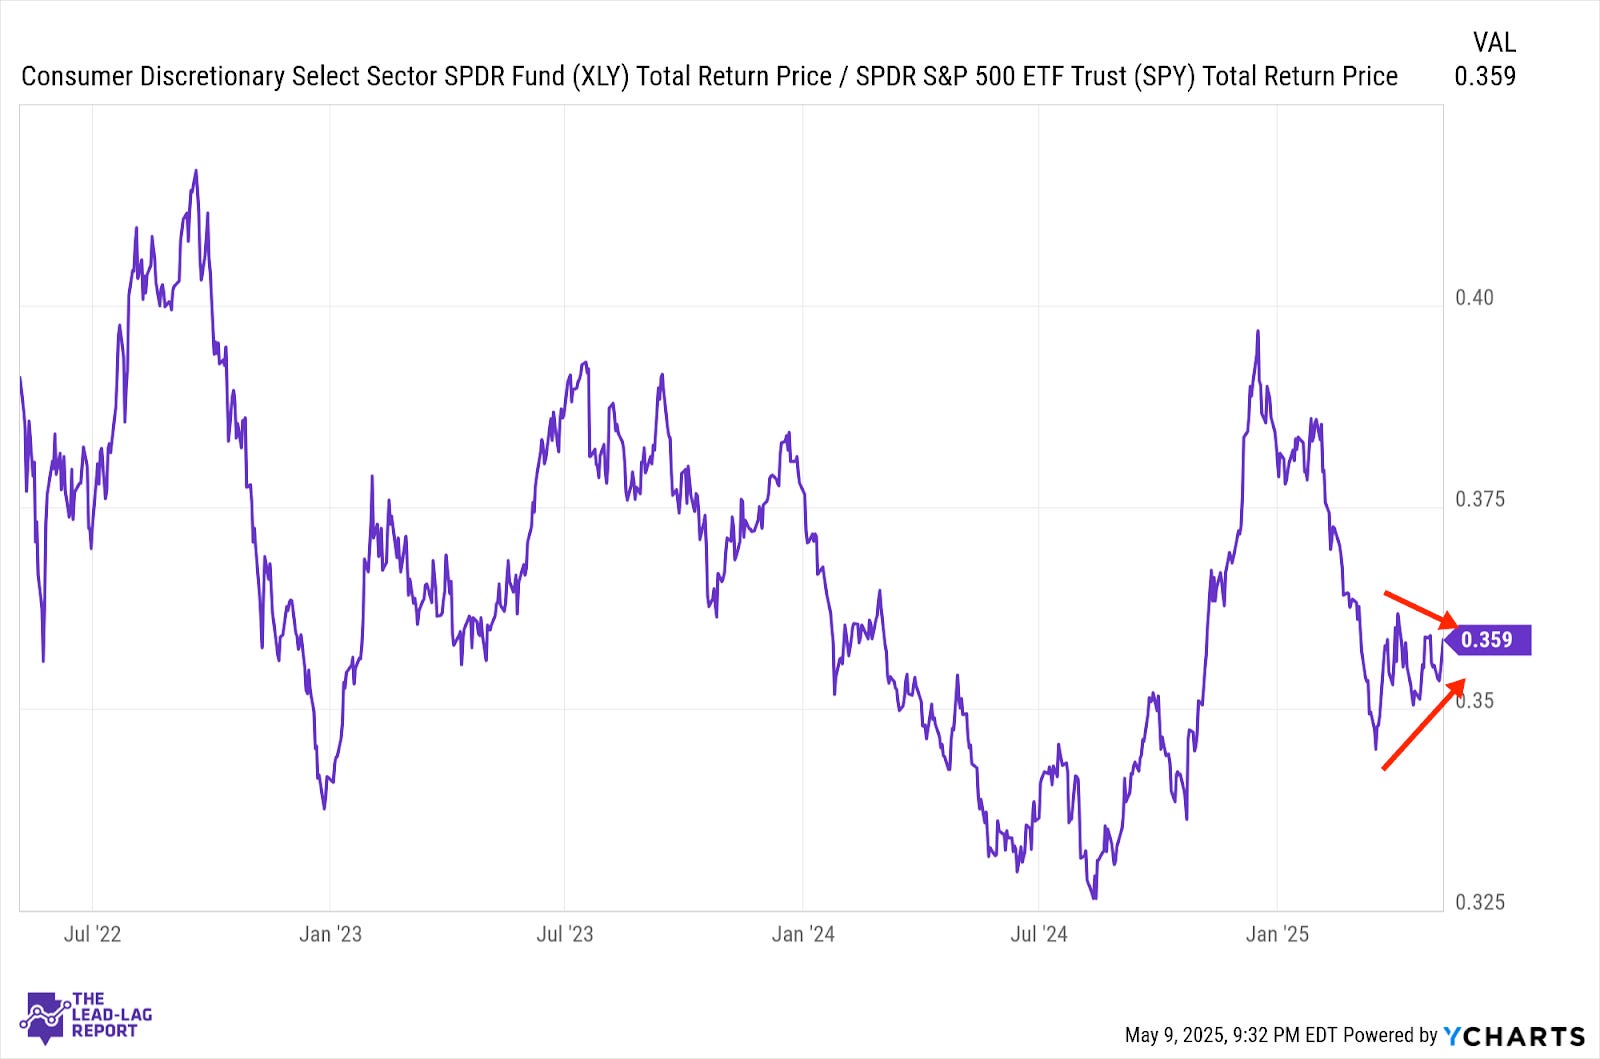
The relative narrowing of the range for this ratio suggests it may be readying itself to break out one direction or the other. The trade war de-escalation means this sector could be ready to break out to the upside. This sector was among the best-performing groups in the aftermath of the announcement, which suggests that it could be set up to do well in the near-term.
Industrials (XLI) – Looking A Little Overdone
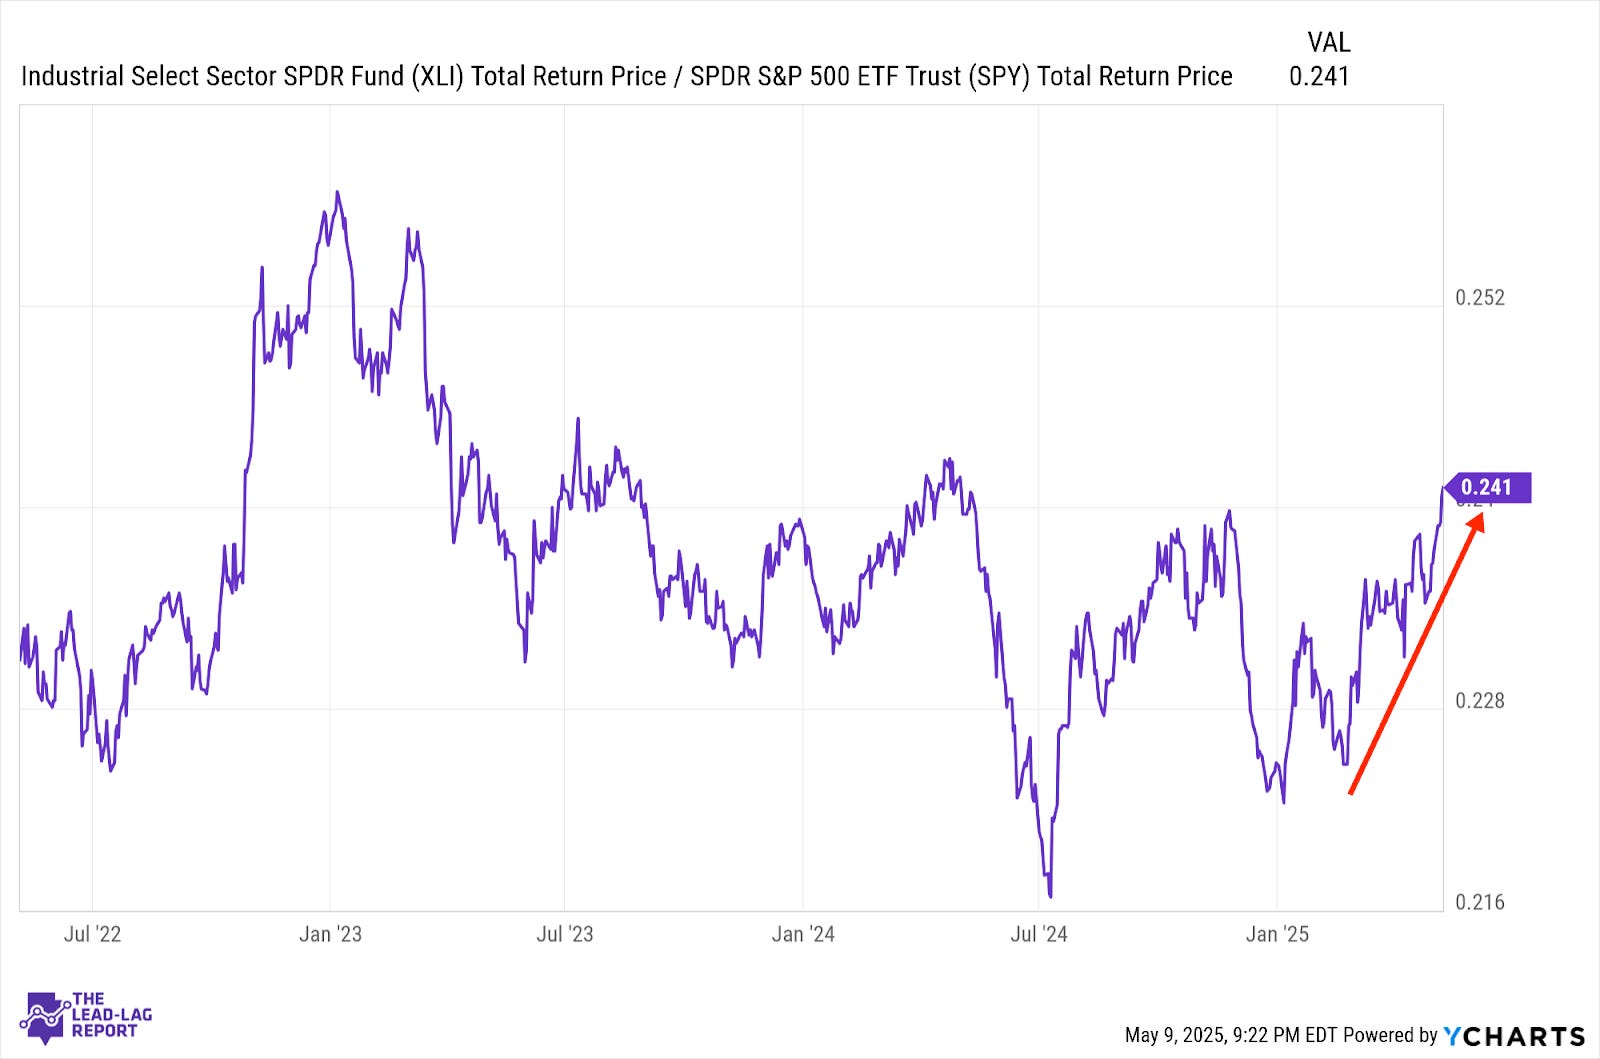
Despite concerns that the global economy could slow significantly (and we’ve already seen some evidence of that in the manufacturing data), this ratio is nearly at a one-year high. The Fed believes that the negative Q1 GDP print is an anomaly and if that proves to be the case, there’s a chance that cyclicals can hold up. This months-long outperformance trend, however, looks a little overdone.
Financials (XLF) – M&A Fuels Earnings
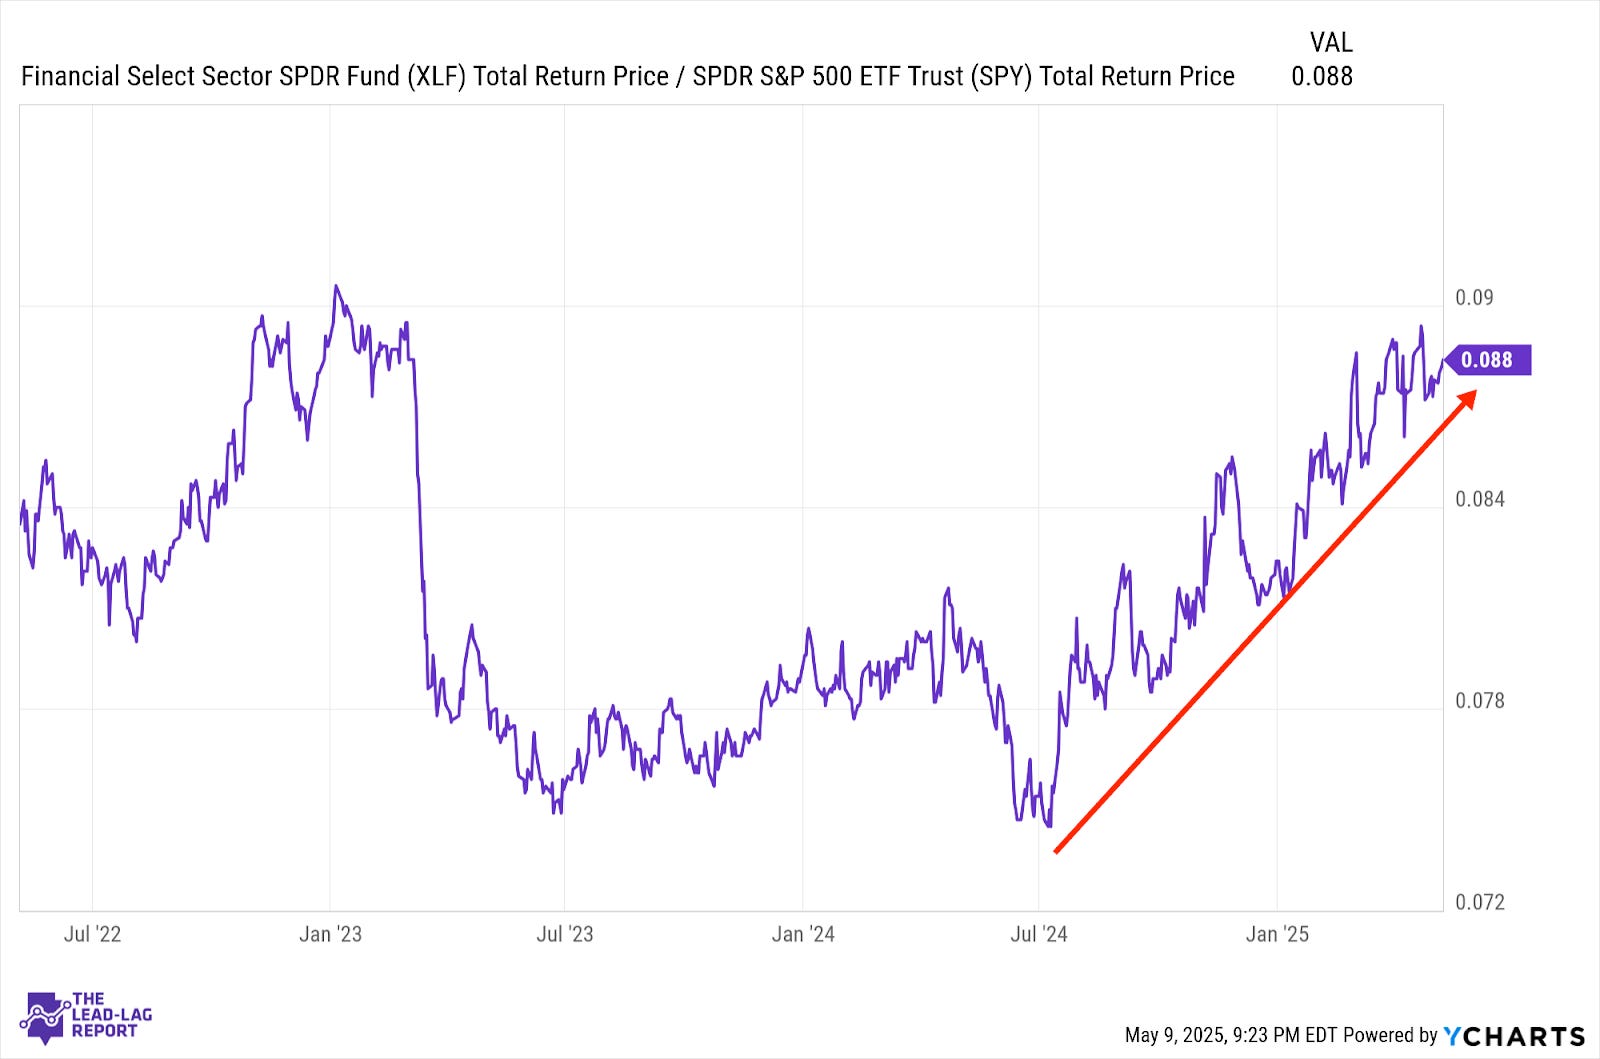
Lending conditions don’t look terribly good, especially with companies cutting back on capex until the trade situation gets settled. There has, however, been a pickup in M&A activity in the past couple of quarters and that’s helped fuel some of the earnings results we got in Q1. As long as lending rates remain elevated, and it looks like they could at this point, net interest margins for the banks are likely to be healthy.
Utilities (XLU) – Longer-Term Uptrend Not Yet Broken
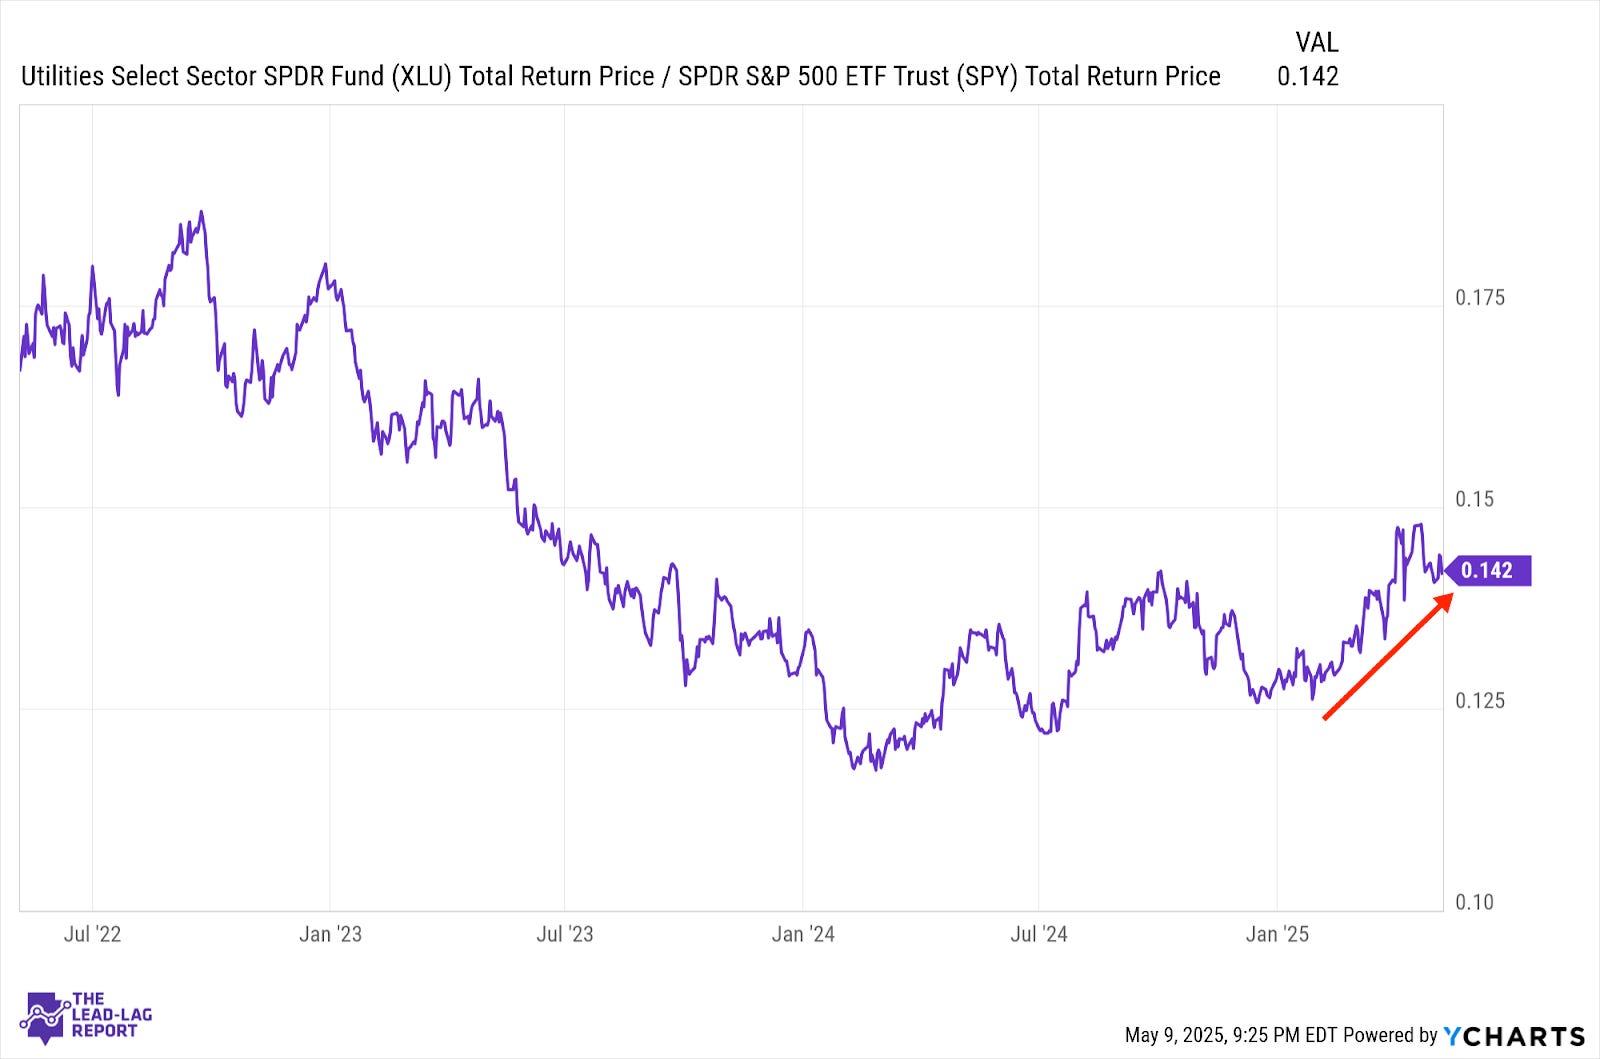
In the short-term, utilities stocks have lagged along with about every other defensive sector and strategy. Longer-term, however, it looks like the uptrend may not yet be broken. The lumber/gold ratio is still indicating a firm risk-off signal, volatility is still elevated and sentiment is through the floor. All of those factors taken together, it’s perfectly understandable while utilities are still seeing some demand in this environment, although that may be poised to change now.
Real Estate (XLRE) – Interest Rate Driven
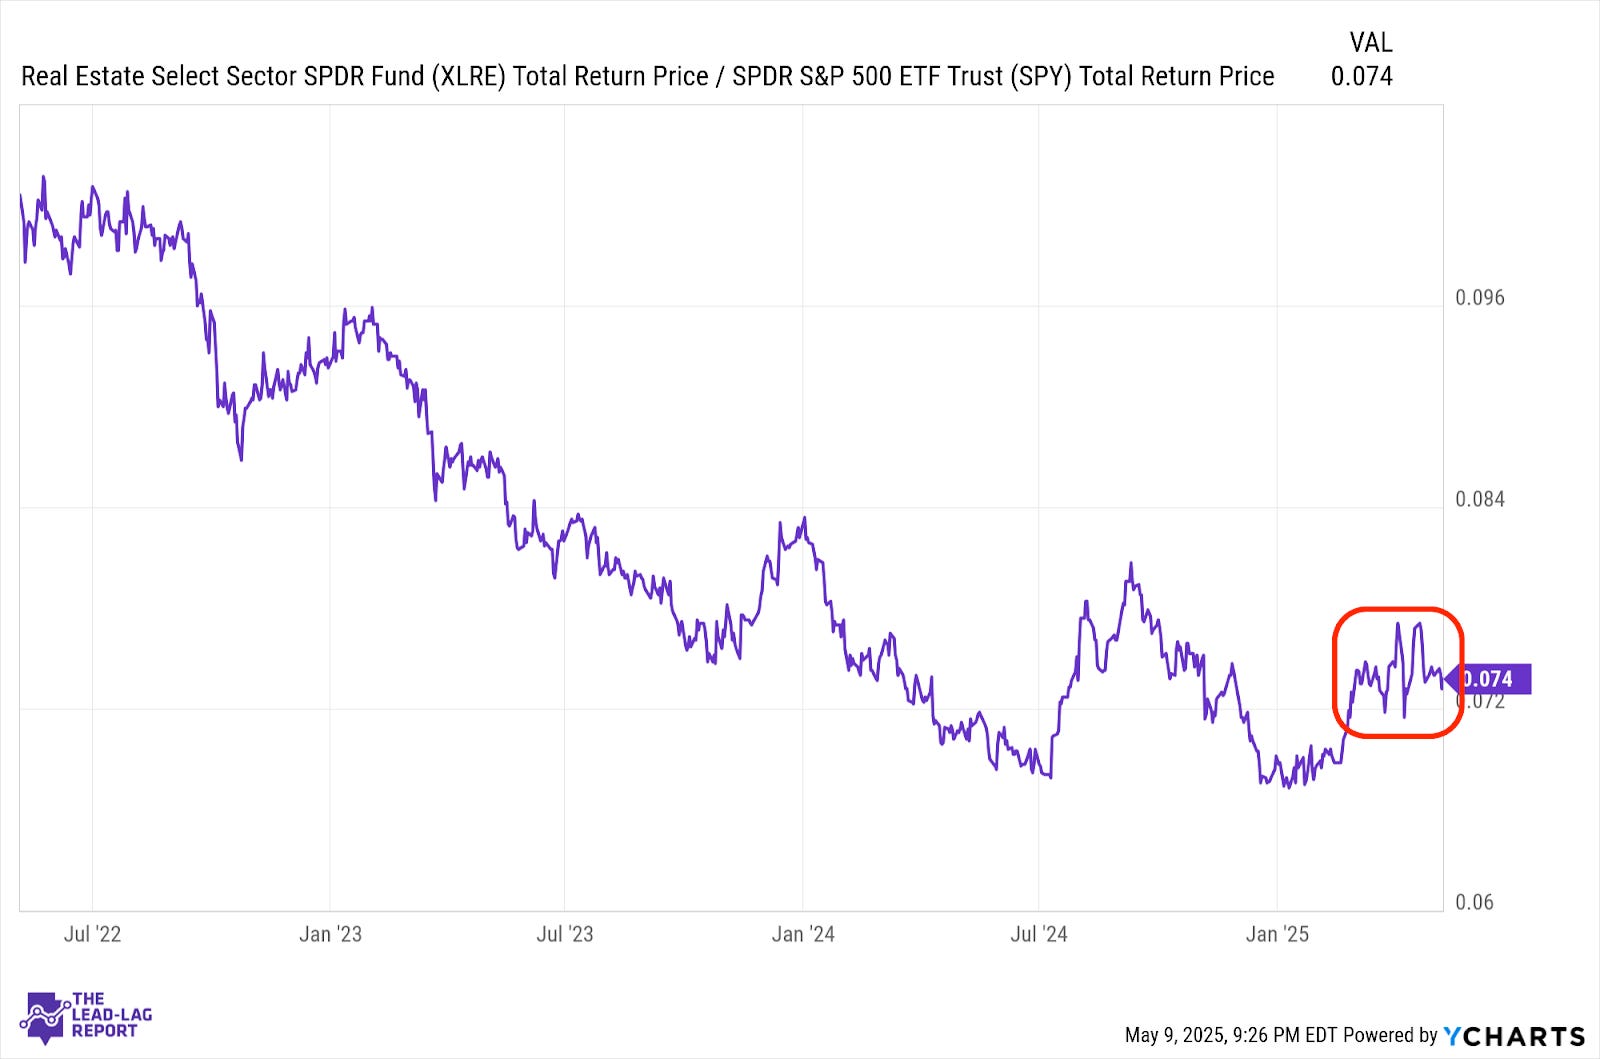
Real estate remains volatile without any firm pulse in either direction. As it has for some time, REIT prices are being heavily influenced by long-term interest rates, which are also struggling to pick a direction. Given inflationary pressures and how we’re starting to see those getting priced more and more into stocks and bonds, real estate might have some challenges in outperforming for the time being.
Treasury Inflation Protected Securities (SPIP) – Headed Towards A Lag
