

My award-winning research from 2014 showed that utility stocks typically outperform the broader stock market in advance of market volatility. Utilities are the perfect example of a low-beta, interest-rate-sensitive, non-cyclical sector. During times of risk-off, investors are drawn to them because their dividends and revenues are stable and regulated. This defensive behavior means that when utilities start to do better than the rest of the stock market, it often comes before big spikes in the VIX, major market drawdowns, and even fat-tail events.
One of the findings in the paper showed that the Utilities sector is already outperforming on a short-term basis the stock market 83% of the time during the stock market’s most volatile times (the top 1% of VIX readings). This shows how well the sector can signal when to buy and when to sell. Utilities have a unique profile that makes them good at predicting things: they are risk-averse and bond-like because they have a lot of debt and their prices are highly regulated. When utilities do well, it means that investors are getting ready for a risk-off environment and are moving away from high-beta growth stocks.
“Junk-Off” Signal Sets Off a Warning for Volatility
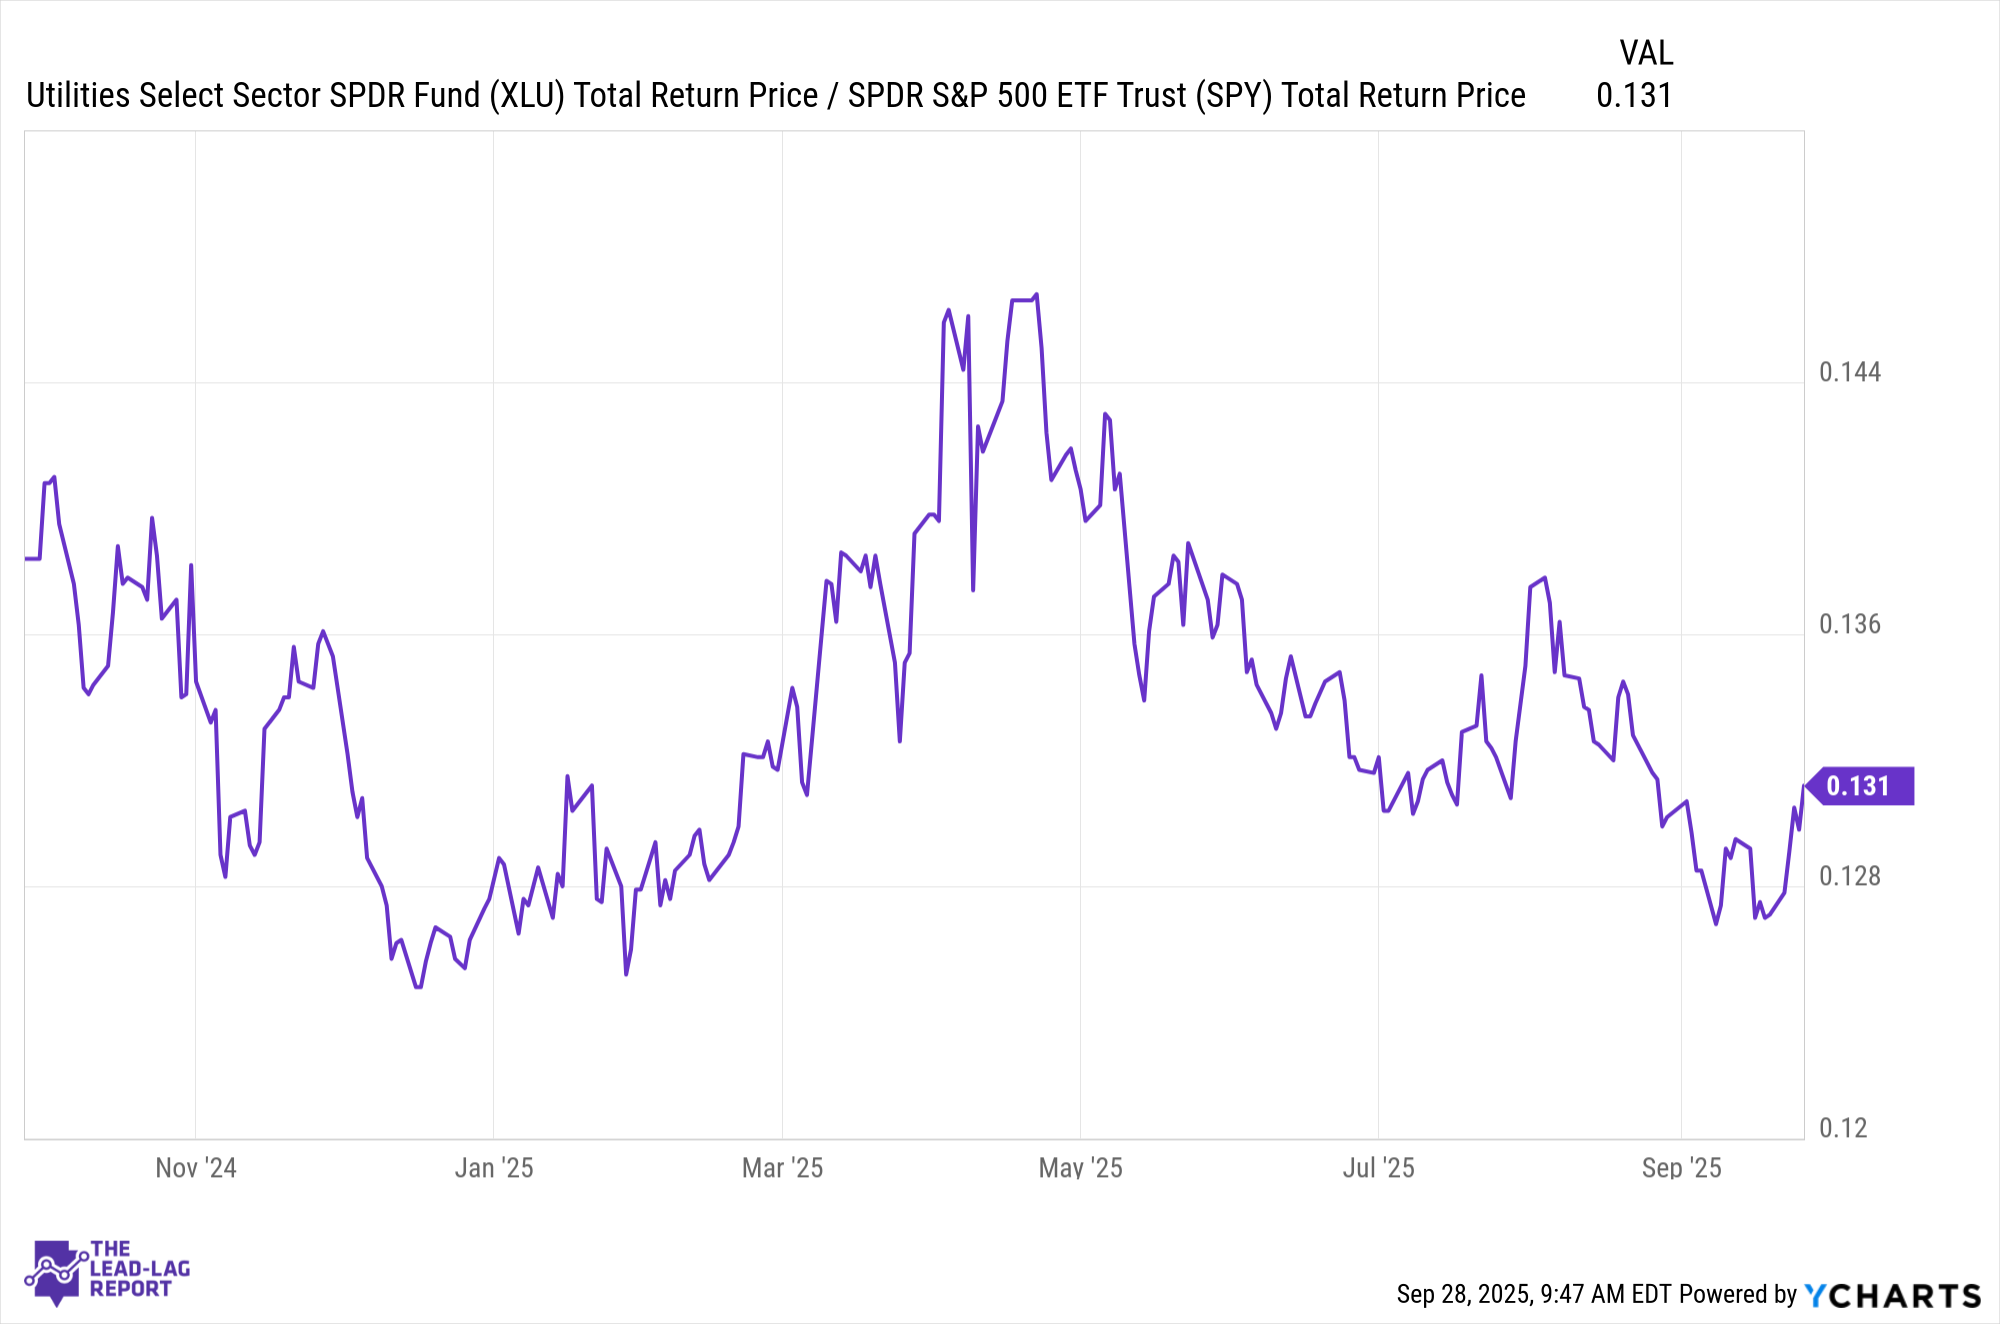
Picture: The ratio of XLU (an ETF for the utilities sector) to SPY (an ETF for the S&P 500)
An upward turn shows that utilities have been doing better than the overall market lately, which is a classic defensive leadership pattern.
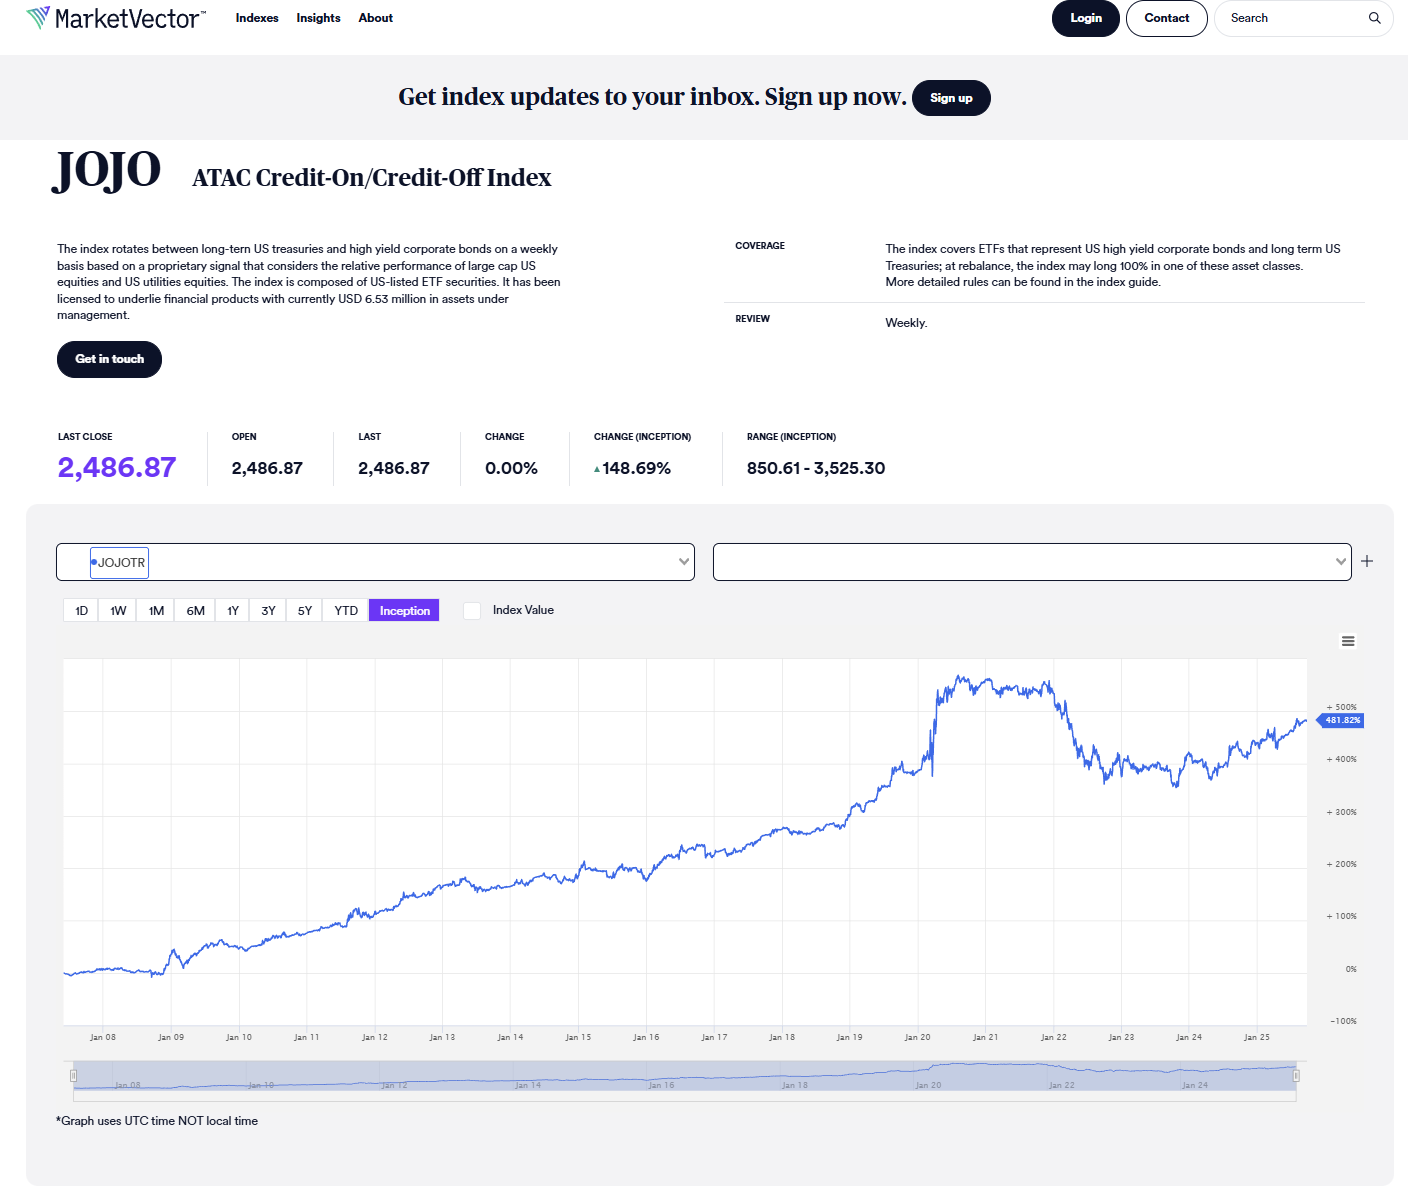
The ATAC Credit Rotation Index (Ticker: JOJO.INDEX) just sent out a “Junk-Off” signal on Friday. This index switches between high-yield “junk” bonds and Treasuries based on how well large-cap stocks do compared to utilities over a rolling three-week period. In practice, this means that the model has moved from risky credit to safer long-term Treasuries. This kind of change fits with the idea that volatility will likely rise. It fits with what the XLU/SPY ratio chart above says: utilities have been doing better than the S&P 500 in the past few weeks. Historically, when utilities do well for a few weeks in a row (like 3 to 6 weeks), the chances of a short-term spike in volatility or a market pullback go up a lot.
October Seasonality and Defensive Rotation
Could this be a false signal? It’s possible; no indicator is 100% certain. There have been times when utilities did better than expected, but stocks kept going up. In the short term, bullish momentum can ignore warning signs. But ignoring utilities’ message has usually been dangerous, so it’s best to be careful if you’re tactically offensive. Even if broad indices stay strong, it might make sense to think about moving into defensive assets as a strategy. When risk aversion goes up, it could mean better potential outperformance might come from positioning into utilities, long-term Treasuries, or even the U.S. dollar, all of which tend to do well during volatile markets.
