
When Mega-Cap Strength Masks Weak Breadth
Why the Index Can Be Above the 50-Day MA and Still Fragile

The S&P 500 sitting comfortably above its 50-day moving average often looks reassuring—an emblem of momentum and calm. Yet beneath the surface, a different picture emerges. Like a towering tree among wilted saplings, a handful of giant stocks can lift the index while most others struggle. This is precisely what has been happening in recent months: the market’s apparent strength has been fueled by a small number of mega-caps, disguising fragility in the broader market.
The Mirage of Index Highs
Market headlines continue to celebrate the “Magnificent Seven,” whose gains have kept the S&P 500 elevated even as the average stock falters. By early August 2025, the share of S&P 500 constituents trading above their 50-day moving averages had dropped from roughly 75 percent in late July to near 50 percent. In other words, the index neared record highs while half its members were trending lower.
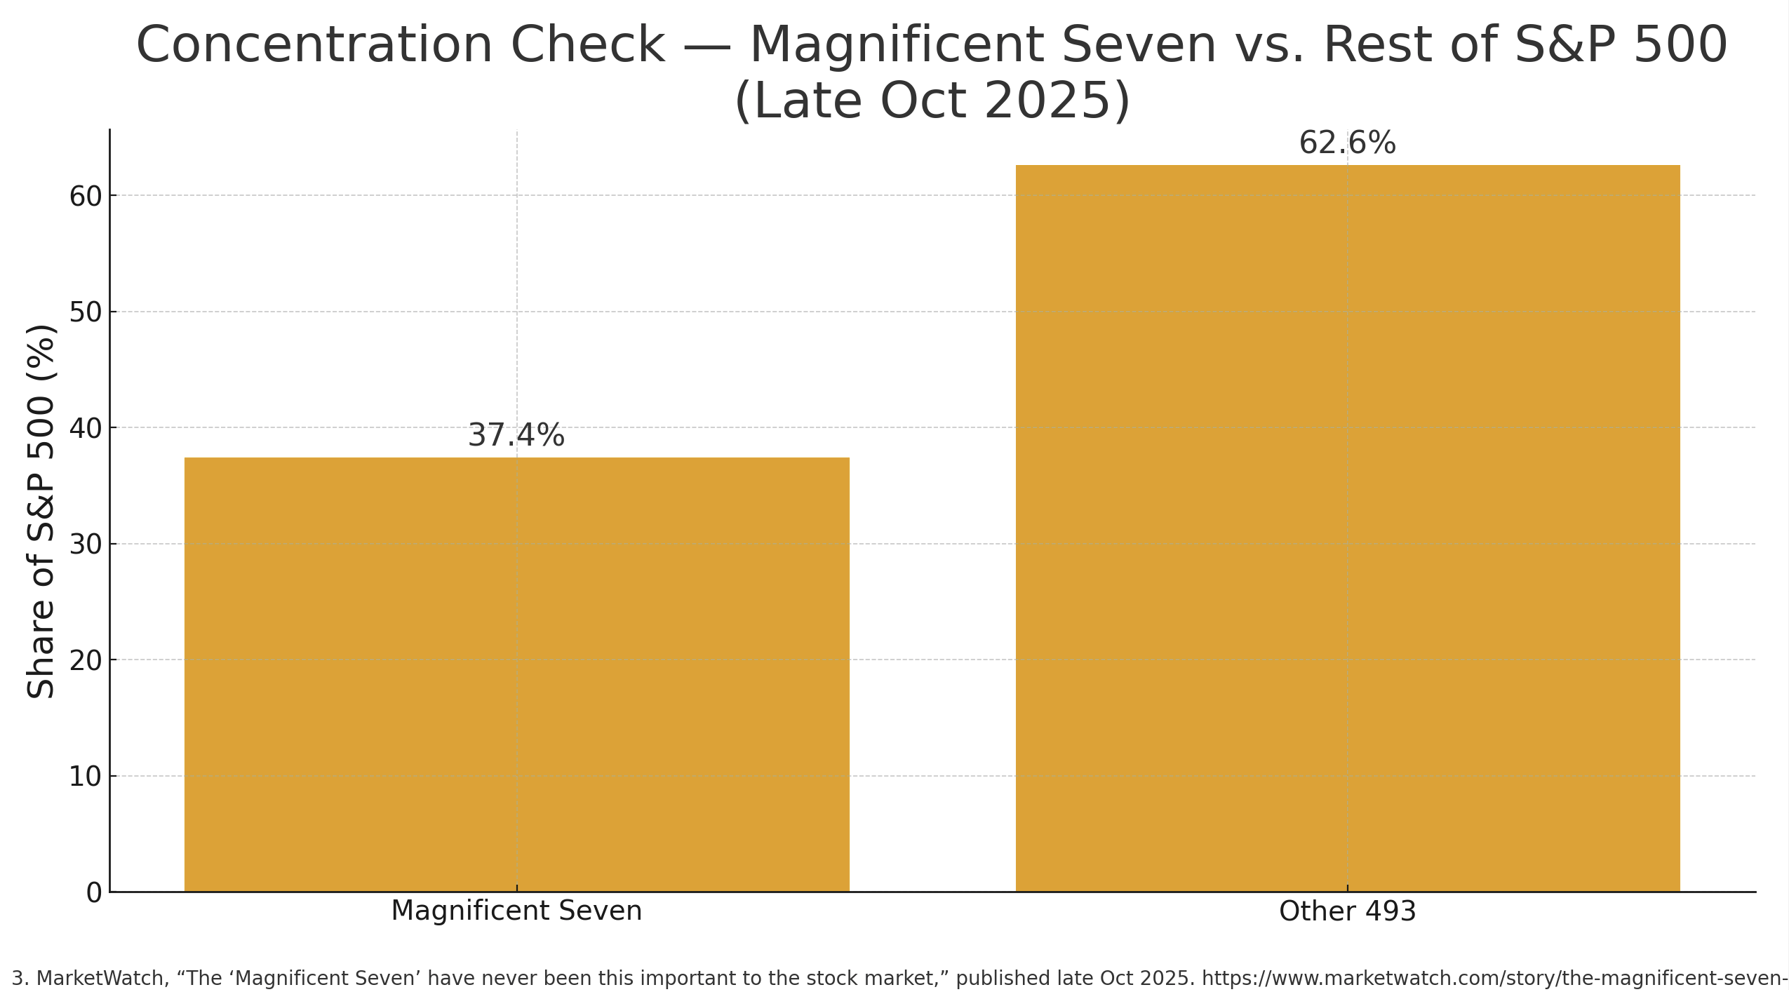
This pattern of bad breadth has often foreshadowed future volatility. Historically, rallies sustained by only a handful of stocks prove less stable than those supported by hundreds. The concentration is striking: by early 2025, the ten largest companies represented about 35 percent of the index’s market capitalization—the highest since the dot-com bubble¹. When leadership narrows to that extent, any stumble among those few names can rattle the entire index.
An internal “X-ray” of the market confirms the imbalance. As of late October 2025, only about 40 percent of S&P 500 stocks remained above their 50-day average. A soccer team relying on one star scorer may still win—until the star gets hurt. Likewise, today’s market strength rests precariously on a handful of corporate superstars.
Above the 50-Day: Signal or Mirage?
Being above a moving average is often interpreted as a bullish sign, but it tells us as much about volatility as direction. Stocks generally move with smoother, lower-volatility trends when above their 50-day MA; below it, price action tends to be erratic and full of whipsaws. Thus, the 50-day line is more a barometer of market calm than a guarantee of strength.
The current rally illustrates the risk of mistaking calm for health. The S&P 500’s break back above its 50-day line looks constructive, yet that movement has been powered by only a small cadre of giants while the majority of stocks remain weak. Such conditions often precede reversals: the index can stay aloft briefly before deteriorating breadth pulls it back down.
Confirmation from classic indicators is also missing. The Dow Jones Transportation Average, a proxy for the real economy, has failed to confirm the S&P’s rise and instead turned lower—a divergence that preceded earlier corrections. A market can appear strong technically while its foundation quietly erodes.
Narrow Rallies, Higher Risk
Breadth isn’t a statistic for technicians alone; it’s a health check for the entire market. When participation narrows, risk rises. During the late-1990s tech bubble, record-high indices masked broad weakness that ended in a painful bear market. Similar conditions are visible today. Analysts increasingly warn that a rally driven by so few participants “is not healthy” and could falter without broader support².
