
When the Top 10 Carry the Tape
Breadth, Concentration, and the Risk Hiding in Plain Sight

Today’s Lead-Lag Report post is sponsored by Evoke

The future is highly uncertain, with potential challenges in growth, inflation, and geopolitics, making diversification crucial.
Most investors are unknowingly underdiversified. A traditional 60/40 portfolio is 98% correlated to the stock market, potentially exposing investors to more risk than they realize. The S&P 500 historically experienced extended periods of underperformance, including:
1. Underperforming cash from 1966 to 1982 during inflationary times
2. A 0% average return from 1929 to 1949
3. A lost decade prior to the recent 15-year bull market
Historical bear markets often started with high valuations. Given current high valuations, we may be on the verge of another challenging period for U.S. equities.
Risk parity seeks to offer a more diversified allocation than conventional mixes. By spreading risk across global equities, Treasuries, TIPS, and commodity producers and gold, investors can maintain a low-cost, tax-efficient passive mix seeking:
1. Equity-like long-term expected returns
2. Lower risk than stocks
3. Reduced risk of a lost decade
To learn more about the RPAR Risk Parity ETF, visit rparetf.com.
Before investing you should carefully consider the Fund’s investment objectives, risks, charges, and expenses. This and other information is in the prospectus. A prospectus may be obtained by clicking here. Please read the prospectus carefully before you invest.
Investing involves risk. Principal loss is possible.
Distributed by Foreside Fund Services, LLC.
Data source: Bloomberg.
DISCLAIMER – PLEASE READ: This is sponsored advertising content for which Lead-Lag Publishing, LLC has been paid a fee. The information provided in the link is solely the creation of Evoke Advisors. Lead-Lag Publishing, LLC does not guarantee the accuracy or completeness of the information provided in the link or make any representation as to its quality. All statements and expressions provided in the link are the sole opinion of Evoke Advisors and Lead-Lag Publishing, LLC expressly disclaims any responsibility for action taken in connection with the information provided in the link.
When the Top 10 Carry the Tape
KEY HIGHLIGHTS
• The ten largest S&P 500 companies still command roughly 36 to 40 percent of the index, the most top-heavy structure in nearly a century and well above the dot-com peak near 27 percent.
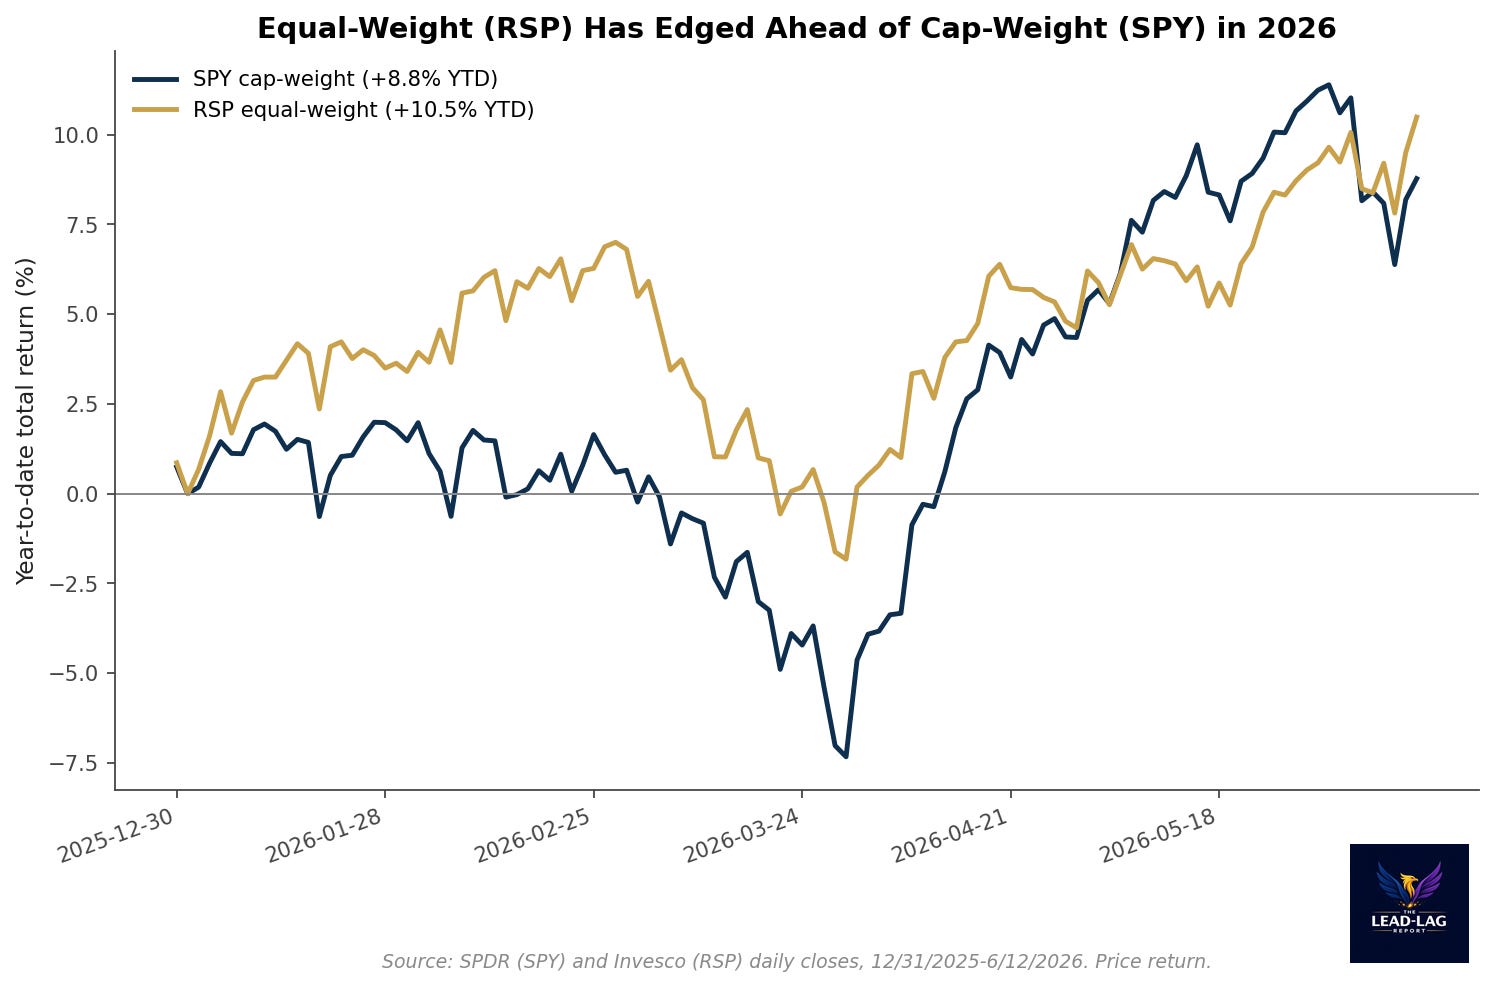
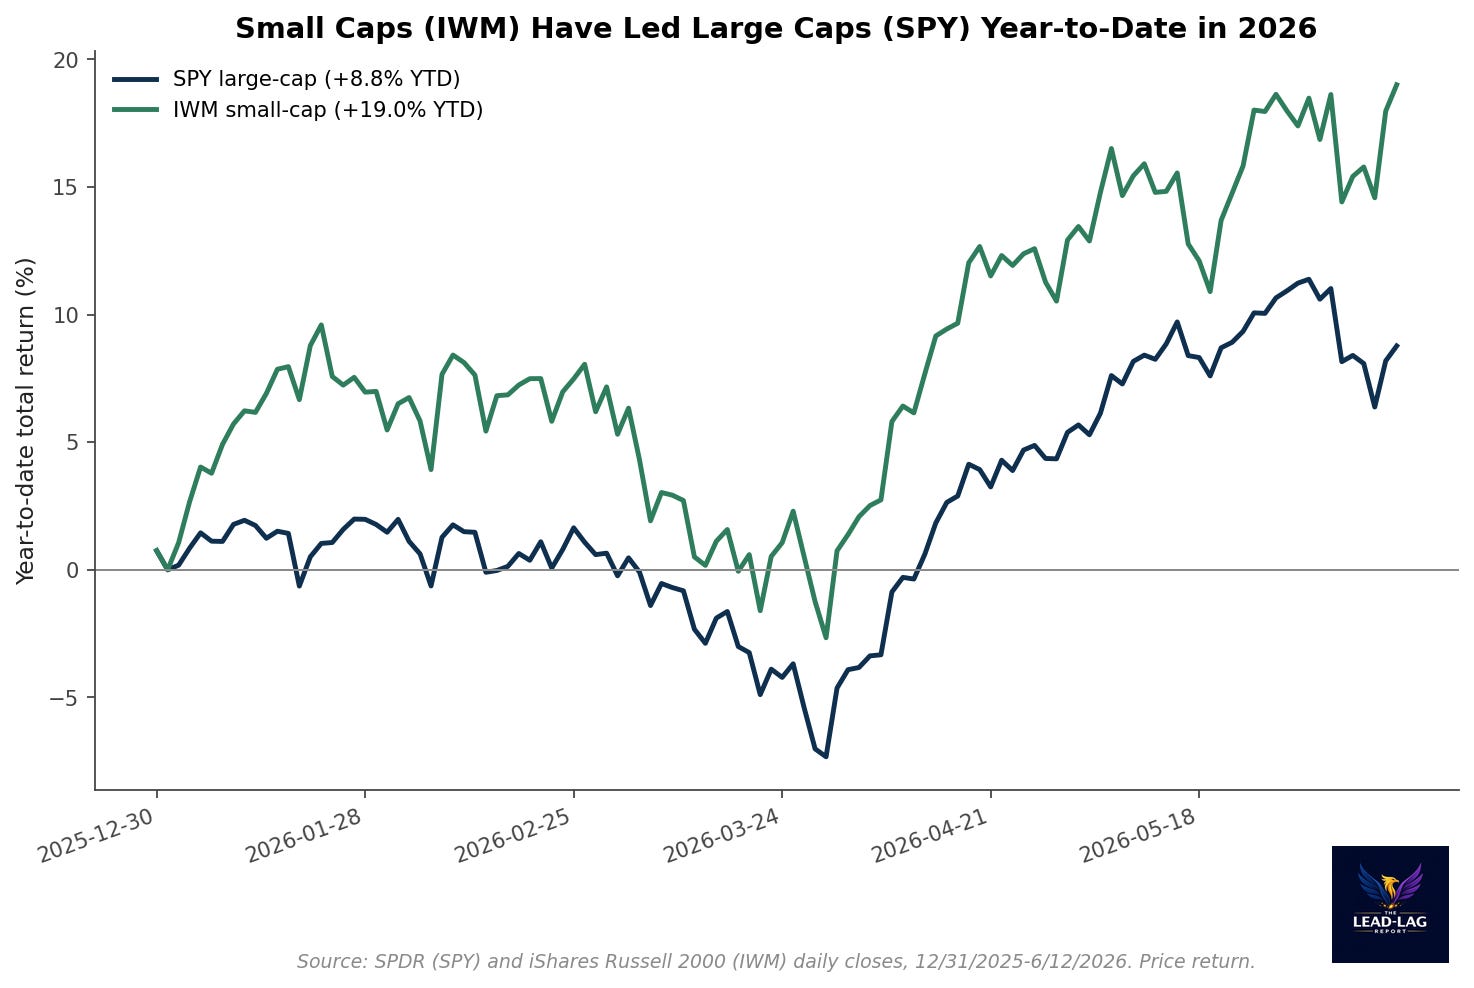
• Yet 2026 has quietly broadened: by mid-June, equal-weight (RSP) and small caps (IWM) had both outrun cap-weight (SPY) year-to-date, reversing three years of mega-cap dominance.
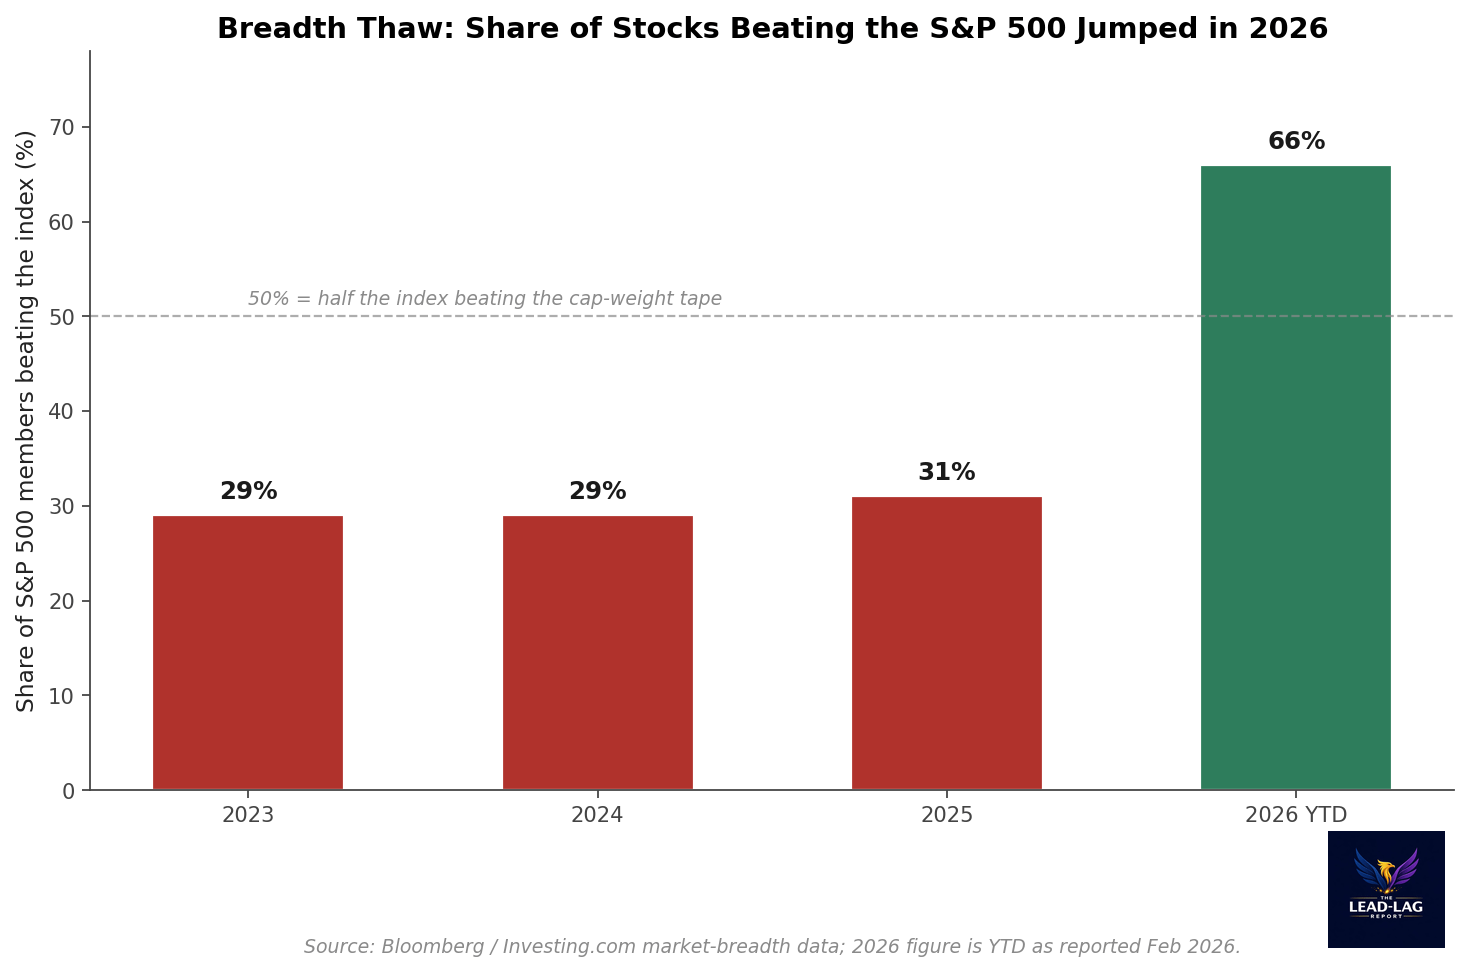
• Roughly 66 percent of S&P 500 members were outpacing the index this year, against 29 to 31 percent in each of the prior three years.
• The tension is not that breadth is dead. It is that the structural concentration that built up through 2024 and 2025 has not gone away while the tape broadened, leaving the index dependent on the same handful of names if the rotation stalls.
There are two markets inside the S&P 500 right now, and they are telling opposite stories. The first is the index you read about, the one that closed at 7,431.46 on June 12, a level that owes its existence to a small cluster of mega-cap technology names that have done the heavy lifting for three straight years. The second is the market underneath it, where a growing majority of stocks have started to participate again. Both are true at once, and the gap between them is the most important thing happening in equities this year.
Consensus has spent the better part of two years treating concentration as a permanent feature, an immovable fact of indexing in the age of the Magnificent Seven. The contrarian observation is narrower and more uncomfortable. Concentration at the top has not unwound. What has changed is that the rest of the index finally started to move, and that broadening is precisely the kind of regime shift that looks healthy in the moment and dangerous in hindsight if the leadership it leans on cannot be replaced.
The structure: two-fifths of the index in ten names
Start with what is not in dispute. By the end of 2025, the ten largest companies in the S&P 500 represented more than 40 percent of the index, according to Bloomberg data cited by Tema ETFs. That is up from roughly 39 percent at the end of 2024 per Charles Schwab, and from the low-20s and high-teens that prevailed through most of the 1980s, 1990s, and 2010s. As of June 12, the live top-10 weight in the SPDR S&P 500 ETF stood at about 36.4 percent, with NVIDIA alone at 7.6 percent and Apple at 6.8 percent. The exact figure moves with the tape, but the order of magnitude is the point.
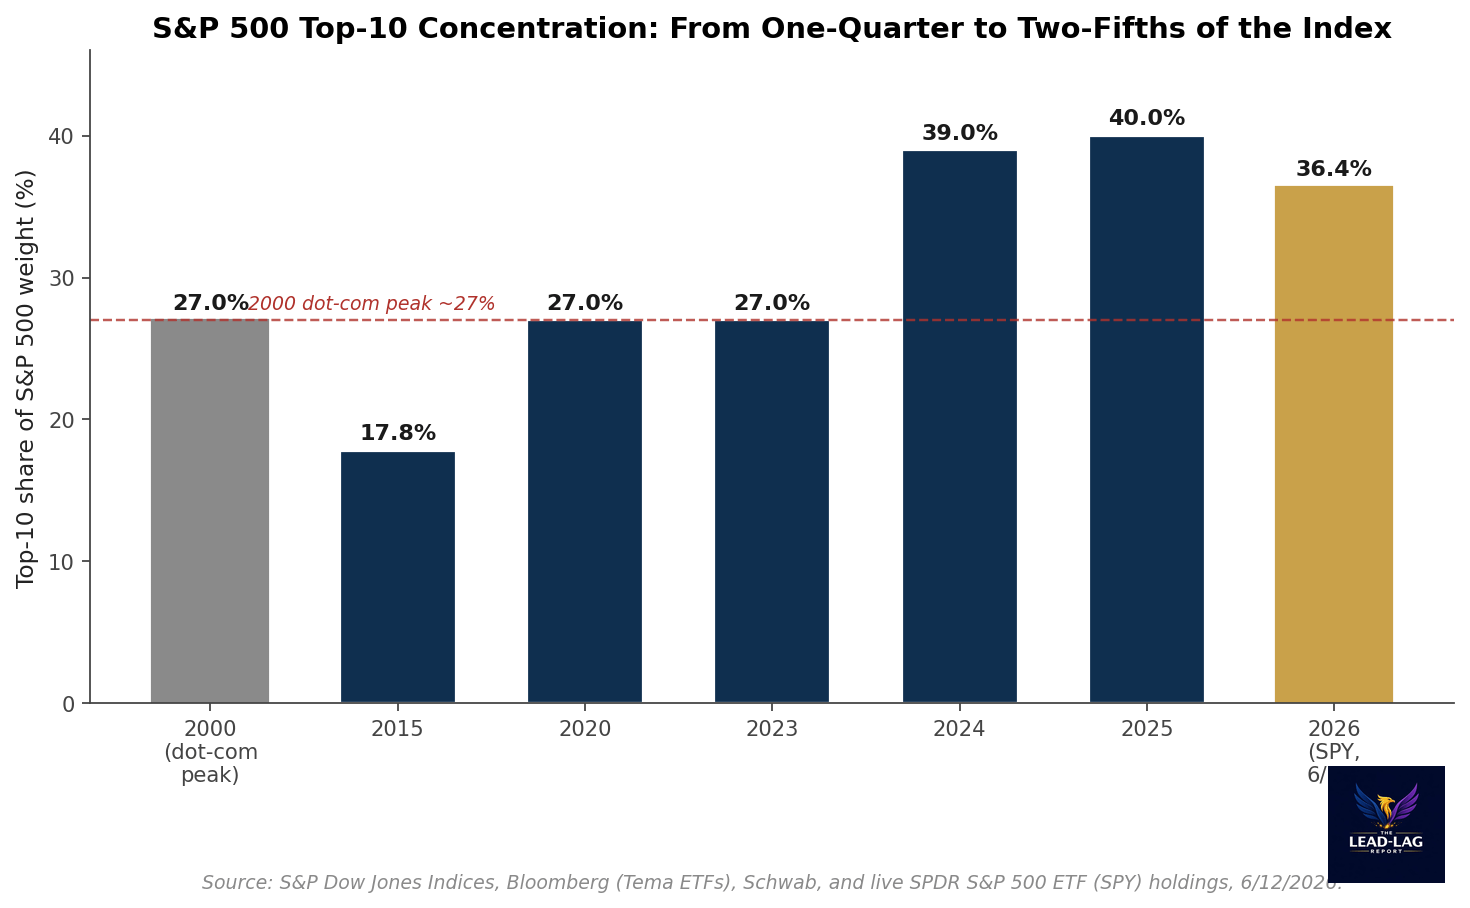
For perspective, the top-10 share at the height of the dot-com mania in 2000 peaked near 27 percent. Today’s structure is not a rhyme with that era. It is a meaningful step beyond it. By several broad-market measures, U.S. equity concentration is the highest in roughly a century. That alone is not a forecast. Concentration can persist for years, and high concentration has historically said far more about who led than about what happens next. But it does define the shape of the risk: an index this top-heavy has tied its fate to the continued execution of a very small number of companies.
There is a second layer to the structure that matters more than the headline weight. The top-10 names carried roughly 41 percent of the index weight at the end of 2025 while contributing only about 32 percent of its earnings, a gap that RBC notes has widened meaningfully since 2015, when weight and earnings contribution were far more closely aligned. Weight has outrun fundamentals. When price leadership leans on a group whose earnings share trails its index share, the margin for disappointment narrows.
The tape: breadth quietly came back in 2026
Here is where the story turns, and where it diverges from the lazy version of the concentration trade. Through the first half of 2026, the market broadened. The clearest read is the equal-weight comparison. Invesco’s equal-weight S&P 500 (RSP) returned about 10.5 percent year-to-date through June 12 on a price basis, ahead of the cap-weight SPDR S&P 500 (SPY) at roughly 8.8 percent. When equal-weight beats cap-weight, it means the average stock is doing better than the index’s largest stocks, the opposite of the 2023 through 2025 pattern.
Small caps tell the same story, only louder. The iShares Russell 2000 (IWM) returned roughly 19.0 percent year-to-date through June 12, more than double SPY’s gain over the same window. Small-cap leadership of this magnitude is historically a signal of risk appetite and broadening participation, not of a narrowing, defensive tape. For three years the small-cap complex was left behind by the mega-cap engine. In 2026 it has been out front.
The participation data confirms what the relative returns imply. Approximately 66 percent of S&P 500 constituents were outperforming the index year-to-date in 2026, a level that, if sustained, would mark the strongest market breadth since this series began in 1986. Compare that with the prior three years, when only 29 percent of members beat the index in 2023, 29 percent in 2024, and 31 percent in 2025. For most of the post-2022 cycle, owning the index meant owning a handful of winners and a long tail of laggards. In 2026, that arithmetic flipped.
Why a broadening tape does not cancel the concentration risk
It would be easy to read the breadth thaw as the all-clear, the moment concentration stopped mattering. That reading misses the asymmetry. Breadth improving and concentration unwinding are not the same event. The average stock can outperform for months while the ten largest names still anchor 36 to 40 percent of the index. That is exactly the configuration we have now: a broader tape sitting on top of an unchanged, historically extreme concentration base.
The risk lives in the dependency, not in the direction. As long as breadth is improving, the index gets a tailwind from both the leaders and the laggards, and the concentration looks benign. The fragility appears if the rotation stalls. If the broadening fades and leadership narrows back to the top names, the index is once again hostage to the earnings trajectory of a group whose weight already exceeds its profit share. A market can be broad and concentrated at the same time. It cannot stay resilient if it is concentrated and the breadth that masked it goes away.
This is the regime question that matters for positioning, framed as exposure rather than prediction. An investor who owns only the cap-weight index is, by construction, still making a concentrated wager on ten companies, regardless of how broad the tape has become beneath the surface. The 2026 broadening is the market offering an option on the rest of the index. Whether that option is worth holding depends entirely on whether the rotation is durable or merely a pause in mega-cap dominance.
None of this resolves cleanly in real time. The honest position is that the structural setup and the cyclical tape are pointing in different directions, and the reconciliation has not happened yet. Concentration this extreme has historically demanded an eventual mean reversion in leadership. The 2026 breadth thaw may be the early innings of exactly that. Or it may be a head-fake that ends with capital flooding back into the same ten names, leaving the index more dependent on them than ever. Both outcomes are live. What is not in dispute is that the index has never been more exposed to being wrong about which one arrives.
The market broadened in 2026 without ever loosening its grip on the top, and that combination, breadth on the surface and concentration underneath, is the risk hiding in plain sight.
Few understand this.
— — —
Notes
[1] S&P 500 closing level of 7,431.46 on June 12, 2026 (index level provided in research context; corroborated by SPDR S&P 500 ETF (SPY) close of 741.75 the same day via Realtime Finance Data).
[2] Top-10 S&P 500 weight exceeding 40 percent at year-end 2025 and the dot-com peak near 27 percent in 2000: Tema ETFs, citing Bloomberg as of Feb 13, 2026. https://temaetfs.com/insights/the-sp-500-has-a-concentration-problem
[3] Top-10 weight of roughly 39 percent at the end of 2024: Charles Schwab, It Was a Very Good Year. https://www.schwab.com/learn/story/it-was-very-good-year
[4] Live SPDR S&P 500 ETF (SPY) holdings as of June 12, 2026 (top-10 sum approximately 36.4 percent; NVIDIA 7.6 percent, Apple 6.8 percent): Realtime Finance Data ETF holdings. https://www.perplexity.ai/finance/SPY/holdings
[5] Historical top-10 weight range of high-teens to low-20s through the 1980s to 2010s, and U.S. concentration near a century high: Barchart, citing S&P Dow Jones Indices. https://www.barchart.com/story/news/2204907/the-s-p-500s-price-is-getting-better-every-week-but-this-indicator-keeps-getting-worse-why-52-could-be-the-markets-tragic-number
[6] Top-10 representing about 41 percent of index weight versus roughly 32 percent of earnings, with the gap widening since 2015 (RBC): summarized at Art of Truth. https://artoftruth.org/market-concentration-sp500-record-2026/
[7] RSP (Invesco S&P 500 Equal Weight ETF) year-to-date price return of approximately 10.5 percent and SPY approximately 8.8 percent, 12/31/2025 to 6/12/2026: computed from daily closes via Realtime Finance Data. https://www.perplexity.ai/finance/RSP/historical-data
[8] IWM (iShares Russell 2000 ETF) year-to-date price return of approximately 19.0 percent, 12/31/2025 to 6/12/2026: computed from daily closes via Realtime Finance Data. https://www.perplexity.ai/finance/IWM/historical-data
[9] Approximately 66 percent of S&P 500 constituents outperforming the index year-to-date in 2026, on track for the highest breadth since records began in 1986: Investing.com. https://www.investing.com/analysis/record-share-of-sp-500-stocks-now-outperforming-the-index-200675542
[10] Share of S&P 500 stocks beating the index of roughly 29 percent in 2023, 29 percent in 2024, and 31 percent in 2025: market-breadth data compiled by Bloomberg/Investing.com, as summarized in market commentary. https://www.investing.com/analysis/record-share-of-sp-500-stocks-now-outperforming-the-index-200675542
[11] S&P 500 Equal Weight relative performance context: S&P Dow Jones Indices, Index Dashboard: S&P 500 Factor Indices, May 2026. https://www.spglobal.com/spdji/en/documents/performance-reports/dashboard-sp-500-factor.pdf
The Lead-Lag Report is provided by Lead-Lag Publishing, LLC. All opinions and views mentioned in this report constitute our judgments as of the date of writing and are subject to change at any time. Information within this material is not intended to be used as a primary basis for investment decisions and should also not be construed as advice meeting the particular investment needs of any individual investor. Trading signals produced by the Lead-Lag Report are independent of other services provided by Lead-Lag Publishing, LLC or its affiliates, and positioning of accounts under their management may differ. Please remember that investing involves risk, including loss of principal, and past performance may not be indicative of future results. Lead-Lag Publishing, LLC, its members, officers, directors and employees expressly disclaim all liability in respect to actions taken based on any or all of the information on this writing.