The S&P 500 Dropped 1.9% on Monday. The 10-Year Yield Is Still Above 5%.
The 10-year sits at 5.12% while stocks slip. Gold is at a 52-week low and the dollar is at a 52-week high. The market is repricing the risk-free rate, not forecasting a recession.


Digital credit is coming up more often in client conversations. This session gives you a framework for evaluating it.
Lead-Lag Live Webinar: Digital Credit Panel with Tuttle Capital and Strive Asset Management
Wednesday, November 18 | 2:00 to 3:00 PM ET
This live webinar is eligible for 1 CFP® CE credit (CFP Board Program ID 354716). To receive credit, attend the live session for at least 30 minutes and provide your CFP Board ID. Replay viewing does not qualify.
What we will cover:
- What digital credit is and how its structures work
- How it differs from conventional credit
- Risk, liquidity, custody and counterparty questions to ask in due diligence
- Where it may fit, and where it may not, in a client's plan
- Live Q&A
Panelists: Matt Tuttle, Founder and CEO, Tuttle Capital Management; Chris Nicholson, Portfolio Manager & Head of Research, Strive Asset Management; and Frances Newton, Chief Investment Officer, Tuttle Capital Management. Moderated by Michael Gayed, CFA.
Free to attend. Registration is required.
Sponsored by Tuttle Capital and Strive Asset Management.
Sponsored content. Lead-Lag Media receives compensation from Tuttle Capital and Strive Asset Management for producing and distributing this webinar. Views expressed are those of the panelists. This is not investment advice and is not an offer to sell or a solicitation to buy any security. Investing involves risk, including possible loss of principal.
The S&P 500 Dropped 1.9% on Monday. The 10-Year Yield Is Still Above 5%.
Stocks are waiting on one earnings report tonight. The bond market is pricing a different world, and this week it stopped hiding.
MICHAEL A. GAYED, CFA
Key Highlights
- The S&P 500 fell 1.9% on Monday to 7,416.59, its worst day in over a year, and slipped again Tuesday after October retail sales came in at an in-line 0.2%. [1] [2]
- The 10-year Treasury yield sits at 5.12%, down only slightly from late Monday. Nothing about this week's equity drawdown has come out of the bond market. [2]
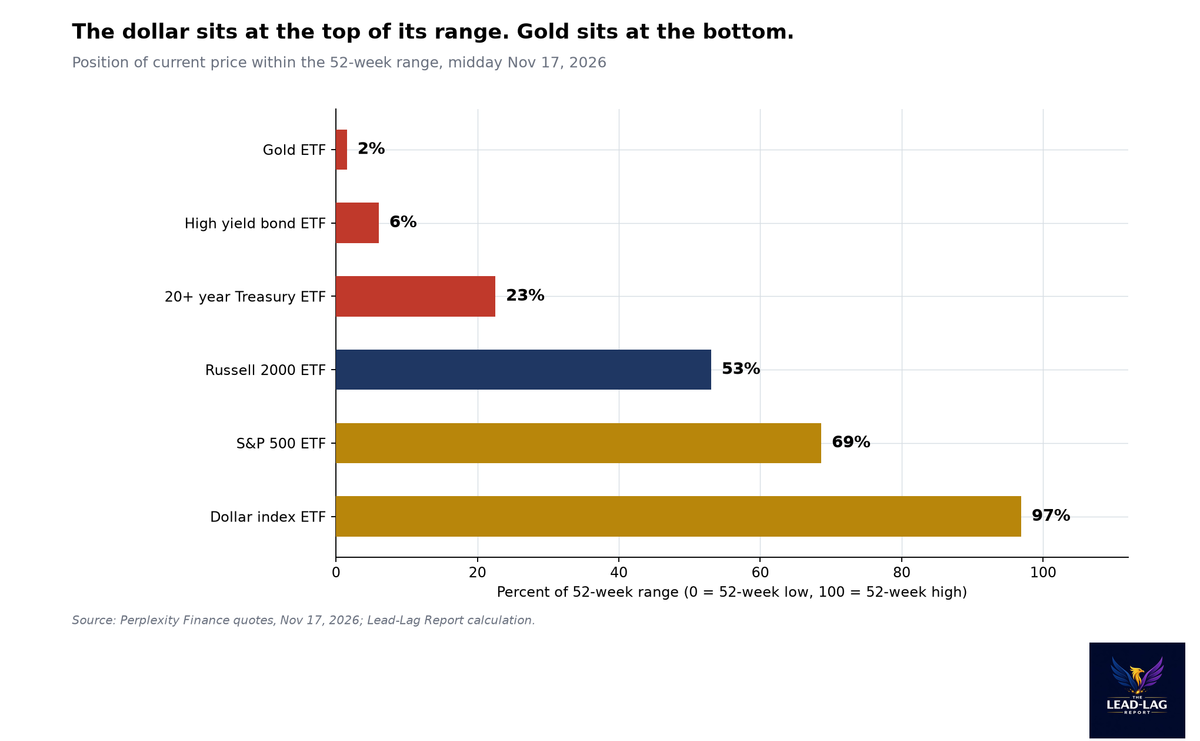
- The gold ETF and the 20-year-plus Treasury ETF trade near 52-week lows. The dollar ETF sits at the top of its 52-week range. [3]
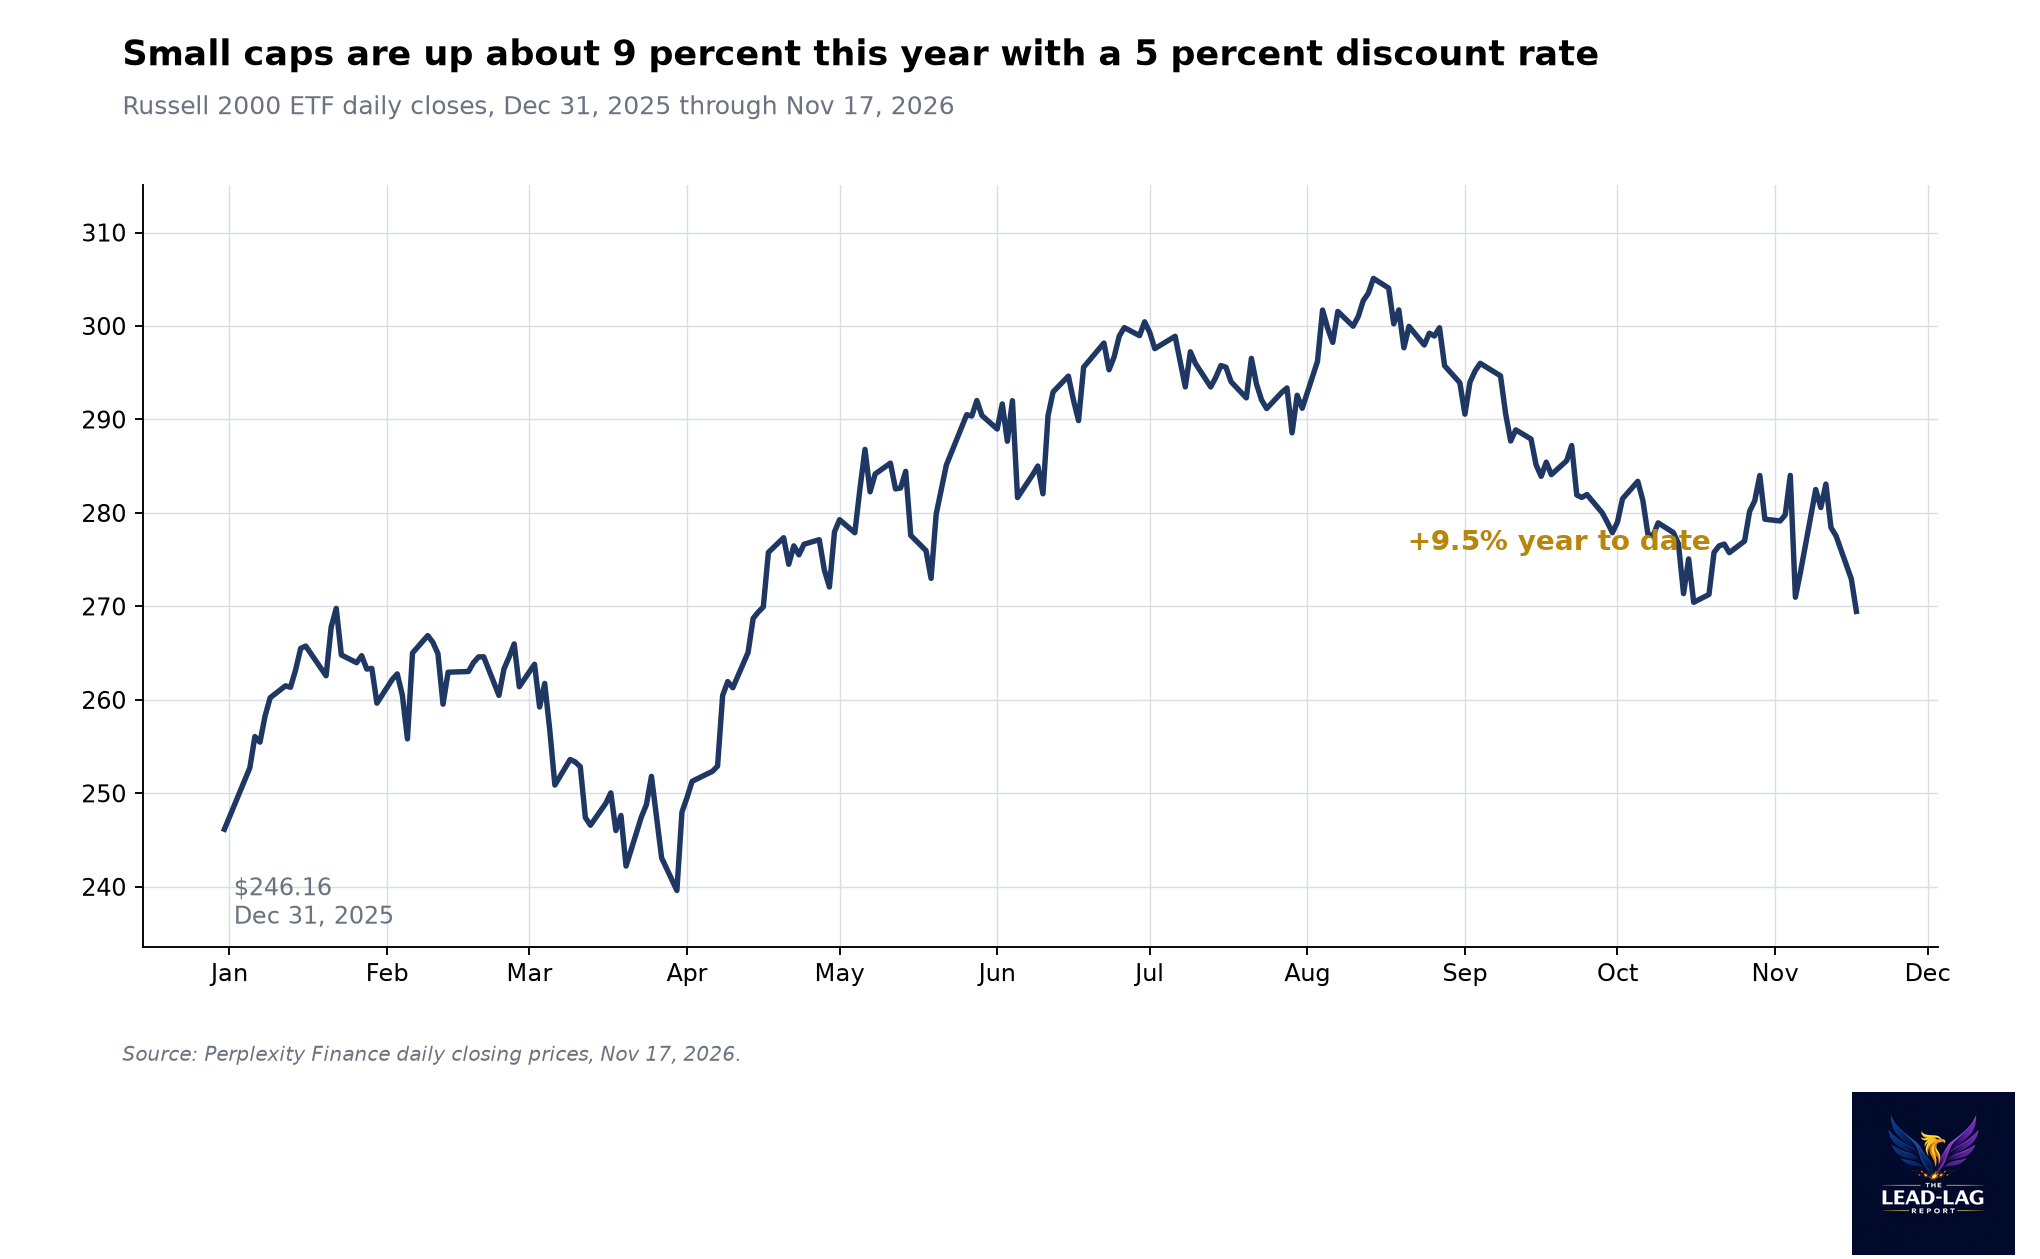
- The Russell 2000 ETF is down 1.3% today and up about 9% for the year, carrying the heaviest sensitivity to that discount rate. [3] [4]
- Nvidia reports after the bell tonight, its first earnings release without Jensen Huang at the helm. [2]
The Day in One Paragraph
Monday was the worst day for the S&P 500 in more than a year, a 1.9% drop that took the index to 7,416.59 and left it roughly 5% below its record high. [1] Tuesday brought no relief rally and no panic either. The Dow slipped after October retail sales rose 0.2%, exactly what economists expected, and by midday the S&P 500 was down about 0.8% with the Nasdaq roughly flat. [2] [4] All of that is the noise. The signal is the level of the 10-year Treasury yield, which sits at 5.12% and has not meaningfully moved during the equity drawdown. [2] When stocks fall and bond yields do not, the market is not forecasting a recession. It is repricing the risk-free rate that every equity multiple is built on.
The Discount Rate Is the Story
The chart below is the whole macro picture in one image. Where does each asset sit inside its own 52-week range? The dollar is at the top. Gold is at the bottom. Long Treasuries are near the bottom. High yield credit is near the top of its range, and stocks sit in the upper middle, closer to their highs than their lows. [3]
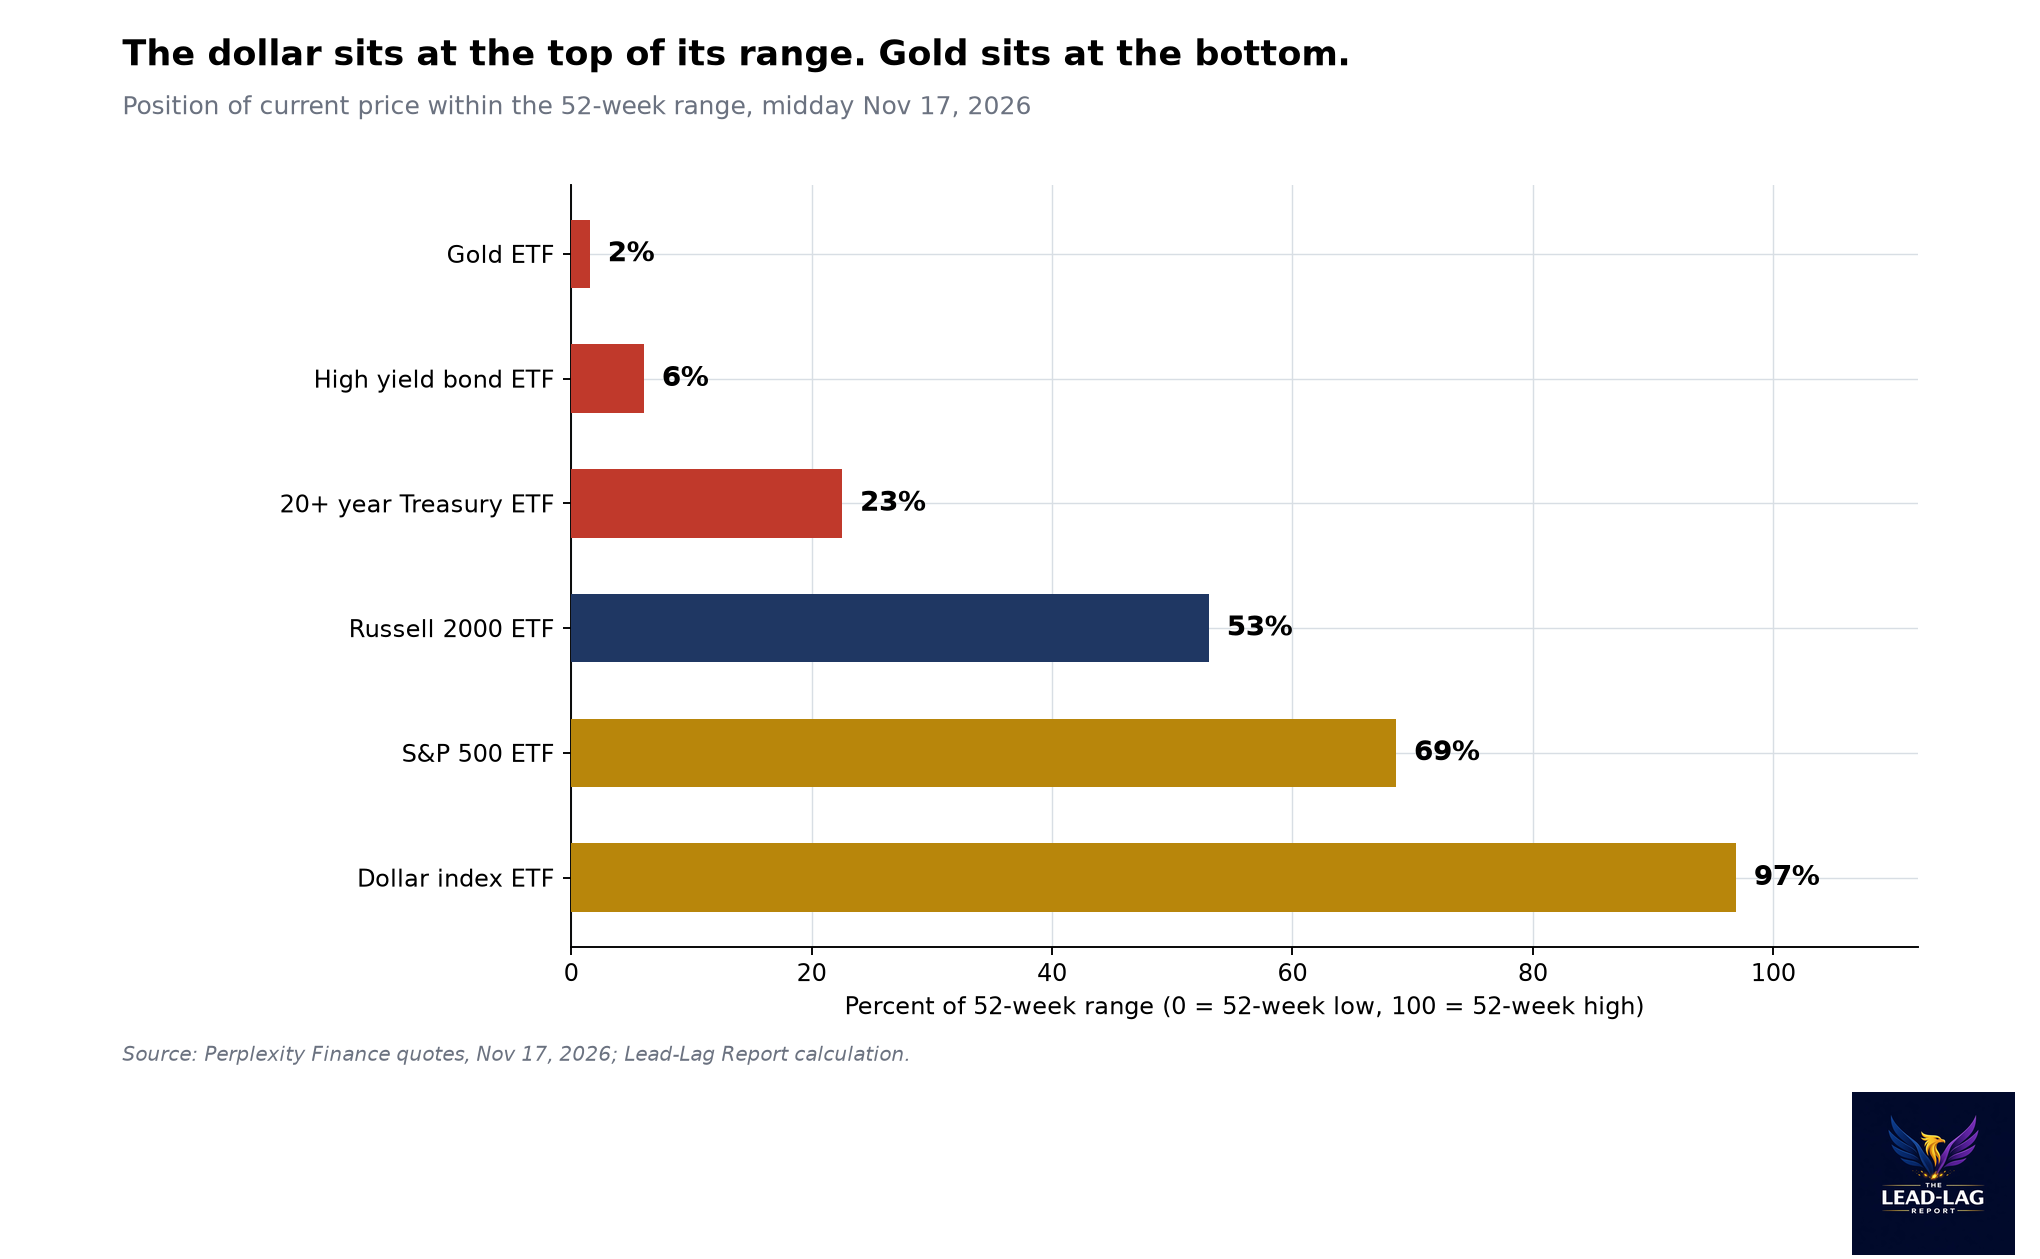
Read those positions together and the story is clear. This is not a flight to safety, because safe assets are cheap and the dollar is expensive. It is a market that has accepted a higher plateau for interest rates. The 10-year above 5% with the Fed's ceiling at 4% means the curve is inverted at the front and demanding a real return at the back. [2] Gold at a 52-week low while inflation is still running hot tells you investors no longer fear the inflation trade itself; they fear the rate level that fights it. That is a different regime from the last two years, and equity multiples have not fully adjusted to it. The S&P 500 is roughly 5% below its high while the 10-year sits 30 basis points higher than the level that coincided with the last stock market peak. [1] [2]
Small caps are where that tension is sharpest. The Russell 2000 ETF is up about 9% this year against a 5% discount rate, and it fell harder than the large caps today, down 1.3% midday. [3] [4] Smaller companies carry more floating-rate debt, refinance more often, and depend more on domestic bank credit, so a 10-year that stays above 5% taxes them long before it taxes the megacaps whose earnings dominate the index. The market keeps pricing a broadening that the bond market keeps refusing to underwrite.
What Credit Is Saying
The one market not sounding an alarm is corporate credit. The high yield bond ETF is near the top of its 52-week range, which is a valuation statement, and the spread story behind it has been compression, not widening. [3] Credit is not forecasting default cycles. It is forecasting a higher-for-longer rate world in which balance sheets hold. That combination, tight credit spreads and a 5% Treasury, is the market paying you very little to take credit risk while paying you a great deal to take none. I have seen this configuration before, in 2006 and in 2019. It does not predict a crash. It does say the easy returns have been harvested, and that the next leg belongs to either the economy growing into its rates or the Fed being forced to cut into weakness. Neither happens tonight.
The Consumer's Handoff
October retail sales rose 0.2%, in line with expectations, and Home Depot's guidance this morning put sales growth at the high end of its prior range but earnings near the bottom. [2] That is the consumer in one sentence: still spending, with less left over. The retail earnings this week will tell us whether the holiday season extends the cycle or ends it. For the market's purposes, in-line is enough to keep the soft-landing narrative alive, and not enough to justify paying premium multiples for it.
What I Am Watching
Tonight's earnings report is the near-term event, and it is a bigger deal than a quarter: the first read on the AI trade from a company reporting without the founder who defined it. [2] But the report I care about is the 10-year. If it holds above 5% through the week's retail earnings and the equity market stabilizes anyway, the multiple compression trade has further to run. If it breaks below 5% on weak retail guidance, the rate-cut trade comes back and small caps lead again. Position for the range, not the headline. Few understand this.
Notes
- Zacks via Yahoo Finance, Stock Market News for Nov 17, 2026: S&P 500 shed 1.9% Monday to close at 7,416.59, its worst day in over a year
- Yahoo Finance, 5 Things Investors Need to Know About Tuesday's Markets, November 17, 2026: 10-year Treasury yield 5.12%; October retail sales +0.2% in line; Nvidia reports after the bell, first release without Jensen Huang; Home Depot full-year guidance
- Perplexity Finance, quotes for the S&P 500 ETF (733.79, -0.8%), Russell 2000 ETF (269.35, -1.3%), 20+ year Treasury ETF (79.68), gold ETF (354.38), high yield bond ETF (76.69) and dollar index ETF (29.50), with 52-week ranges, midday November 17, 2026
- Yahoo Finance live coverage, Stock market today: Dow, S&P 500, Nasdaq slip in countdown to Nvidia earnings, November 17, 2026
- Perplexity Finance, Russell 2000 ETF daily closing prices, December 31, 2025 through November 17, 2026: $246.16 year-end close to $269.47