Leaders-Laggards
Tech Crosses Three Sigma While Gold Breaks: The Streak Turns Ten
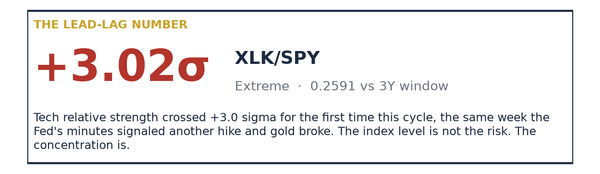
Tech crosses +3 sigma, gold breaks to a two-month low, credit confirms at +1.64 sigma, and utilities log a tenth straight negative week.

Leaders-Laggards
Tech crosses +3 sigma, gold breaks to a two-month low, credit confirms at +1.64 sigma, and utilities log a tenth straight negative week.
Leaders-Laggards
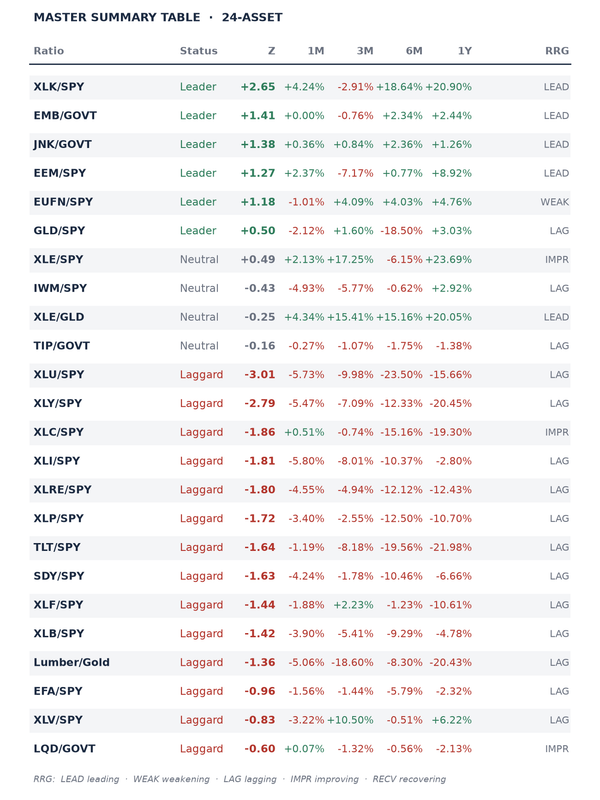
XLK/SPY at +2.65 sigma, XLU/SPY at -3.01 in Week 6 of the deeply broken framework, credit confirms risk appetite as the Fed hikes into tech strength
Leaders-Laggards
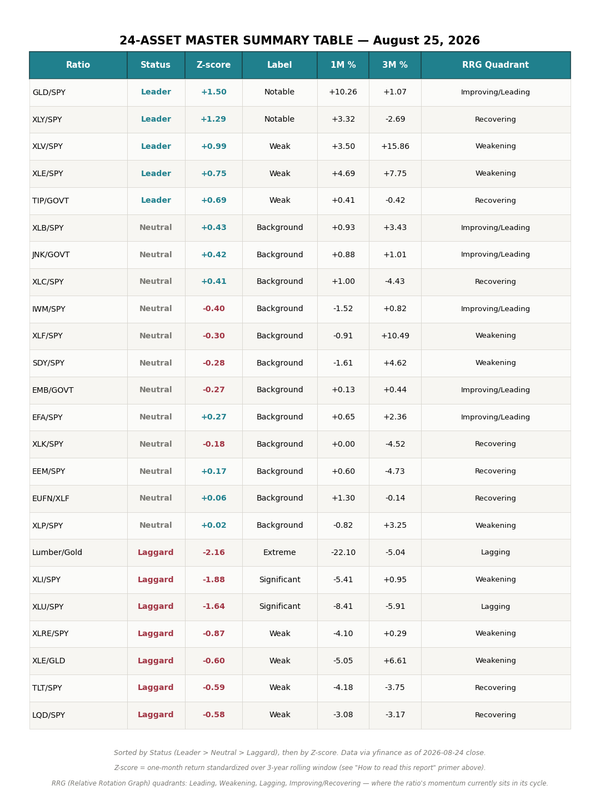
First Lumber/Gold Extreme reading in 3 years. XLI CRASHED to Significant Laggard. Gold Notable Leader. Late-cycle rotation widening.
Weekly
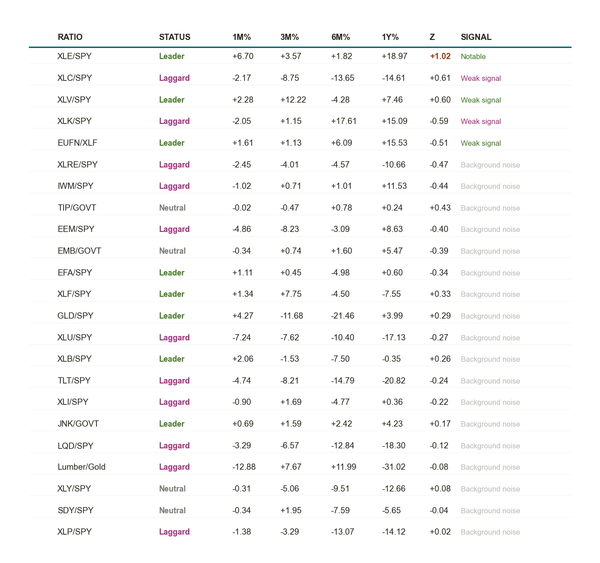
SPY +2.0% to $773. XLU 4W ROC -8.58% (Framework Check broken week 3). XLE Notable +1.02σ week 4 confirmed. GLD flips back to Leader. Rotation broadens but stays narrow. Run #26: 5 of 6 forward calls correct.

Leaders-Laggards
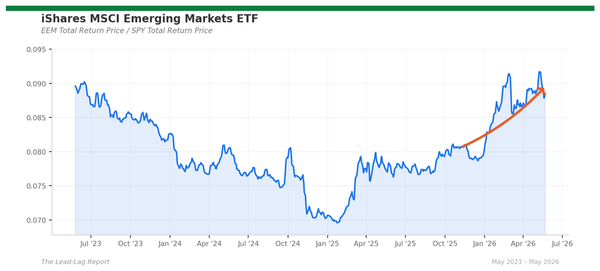
Warsh Kills Cuts; EEM +1.81σ Extreme; Russell +2.03%; XLE -5.86% Worst Sector; Lumber/Gold +8.11%; Credit Diverging Now

Leaders-Laggards
S&P -2.55% Snaps 9-Week Run; Nasdaq -4.65% On Broadcom Miss + AI Pullback; XLE +2.45% Flips Back To Leader On Iran/Israel Strikes; Jobs +172K Pushes Fed Cuts To 2027; Gold -5.0%; 10Y Holds 4.55%

Leaders-Laggards
S&P +1.5% On Week 9; XLK +5.9% On NVDA Beat; XLE -5.4% Flips To Laggard On Iran Ceasefire; 10Y Softens To 4.45%; EEM Leads All Major Indexes
Leaders-Laggards
Fed Minutes Reveal Members Anticipate Hikes If Inflation Persists; Kevin Warsh Sworn In As Fed Chair Friday; S&P +0.9%, Russell 2000 +2.7% Leads, Tech +3.5% Reasserts; Brent Oil -4% On Iran Whipsaw
Leaders-Laggards
S&P, Nasdaq Hit Fresh Records on Six-Week Rally; XLK +9.8% On The Week
Leaders-Laggards
Trump Cancels Pakistan Talks, Big Tech Earnings Loom, S&P Notches Ninth Record of 2026 — But Five of Eleven Sectors Are Already Lower
Leaders-Laggards
Trump Extends Truce Indefinitely, GLD Prints a Gravestone Doji, Oil Whipsaws Between $90 and $93, and the Tech Leader Holds While

Leaders-Laggards
Below is an assessment of the performance of some of the most important sectors and asset classes relative to each other with an interpretation of what underlying market dynamics may be signaling about the future direction of risk-taking by investors. The below charts are all price ratios which show