Tech Slips From Three Sigma as Credit Turns and the Utilities Streak Ends
XLK/SPY eases to +2.09 sigma, JNK/GOVT logs its first negative month, and utilities end a ten-week losing streak in a hot-CPI week.

Today’s Lead-Lag Report post is sponsored by Evoke

The future is highly uncertain, with potential challenges in growth, inflation, and geopolitics, making diversification crucial.
Most investors are unknowingly underdiversified. A traditional 60/40 portfolio is 98% correlated to the stock market, potentially exposing investors to more risk than they realize. The S&P 500 historically experienced extended periods of underperformance, including:
1. Underperforming cash from 1966 to 1982 during inflationary times
2. A 0% average return from 1929 to 1949
3. A lost decade prior to the recent 15-year bull market
Historical bear markets often started with high valuations. Given current high valuations, we may be on the verge of another challenging period for U.S. equities.
Risk parity seeks to offer a more diversified allocation than conventional mixes. By spreading risk across global equities, Treasuries, TIPS, and commodity producers and gold, investors can maintain a low-cost, tax-efficient passive mix seeking:
1. Equity-like long-term expected returns
2. Lower risk than stocks
3. Reduced risk of a lost decade
To learn more about the RPAR Risk Parity ETF, visit rparetf.com.
Before investing you should carefully consider the Fund’s investment objectives, risks, charges, and expenses. This and other information is in the prospectus. A prospectus may be obtained by clicking here. Please read the prospectus carefully before you invest.
Investing involves risk. Principal loss is possible.
Distributed by Foreside Fund Services, LLC.
Data source: Bloomberg.
DISCLAIMER – PLEASE READ: This is sponsored advertising content for which Lead-Lag Publishing, LLC has been paid a fee. The information provided in the link is solely the creation of Evoke Advisors. Lead-Lag Publishing, LLC does not guarantee the accuracy or completeness of the information provided in the link or make any representation as to its quality. All statements and expressions provided in the link are the sole opinion of Evoke Advisors and Lead-Lag Publishing, LLC expressly disclaims any responsibility for action taken in connection with the information provided in the link.
Tech Slips From Three Sigma as Credit Turns and the Utilities Streak Ends
XLK/SPY eases to +2.09 sigma, JNK/GOVT logs its first negative month, and utilities end a ten-week losing streak in a hot-CPI week.
MICHAEL A. GAYED, CFA
OCT 16, 2026
KEY HIGHLIGHTS
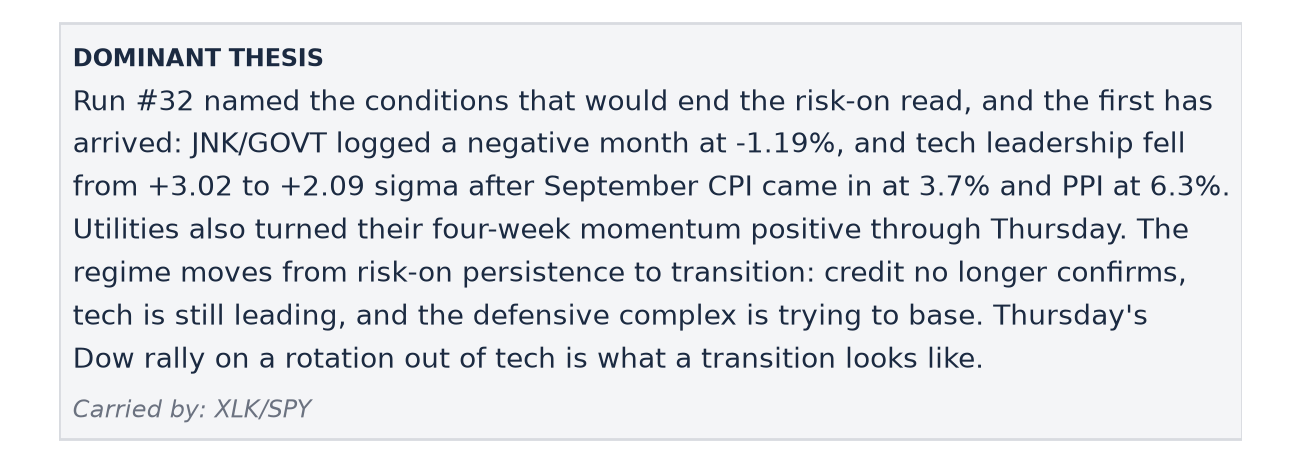
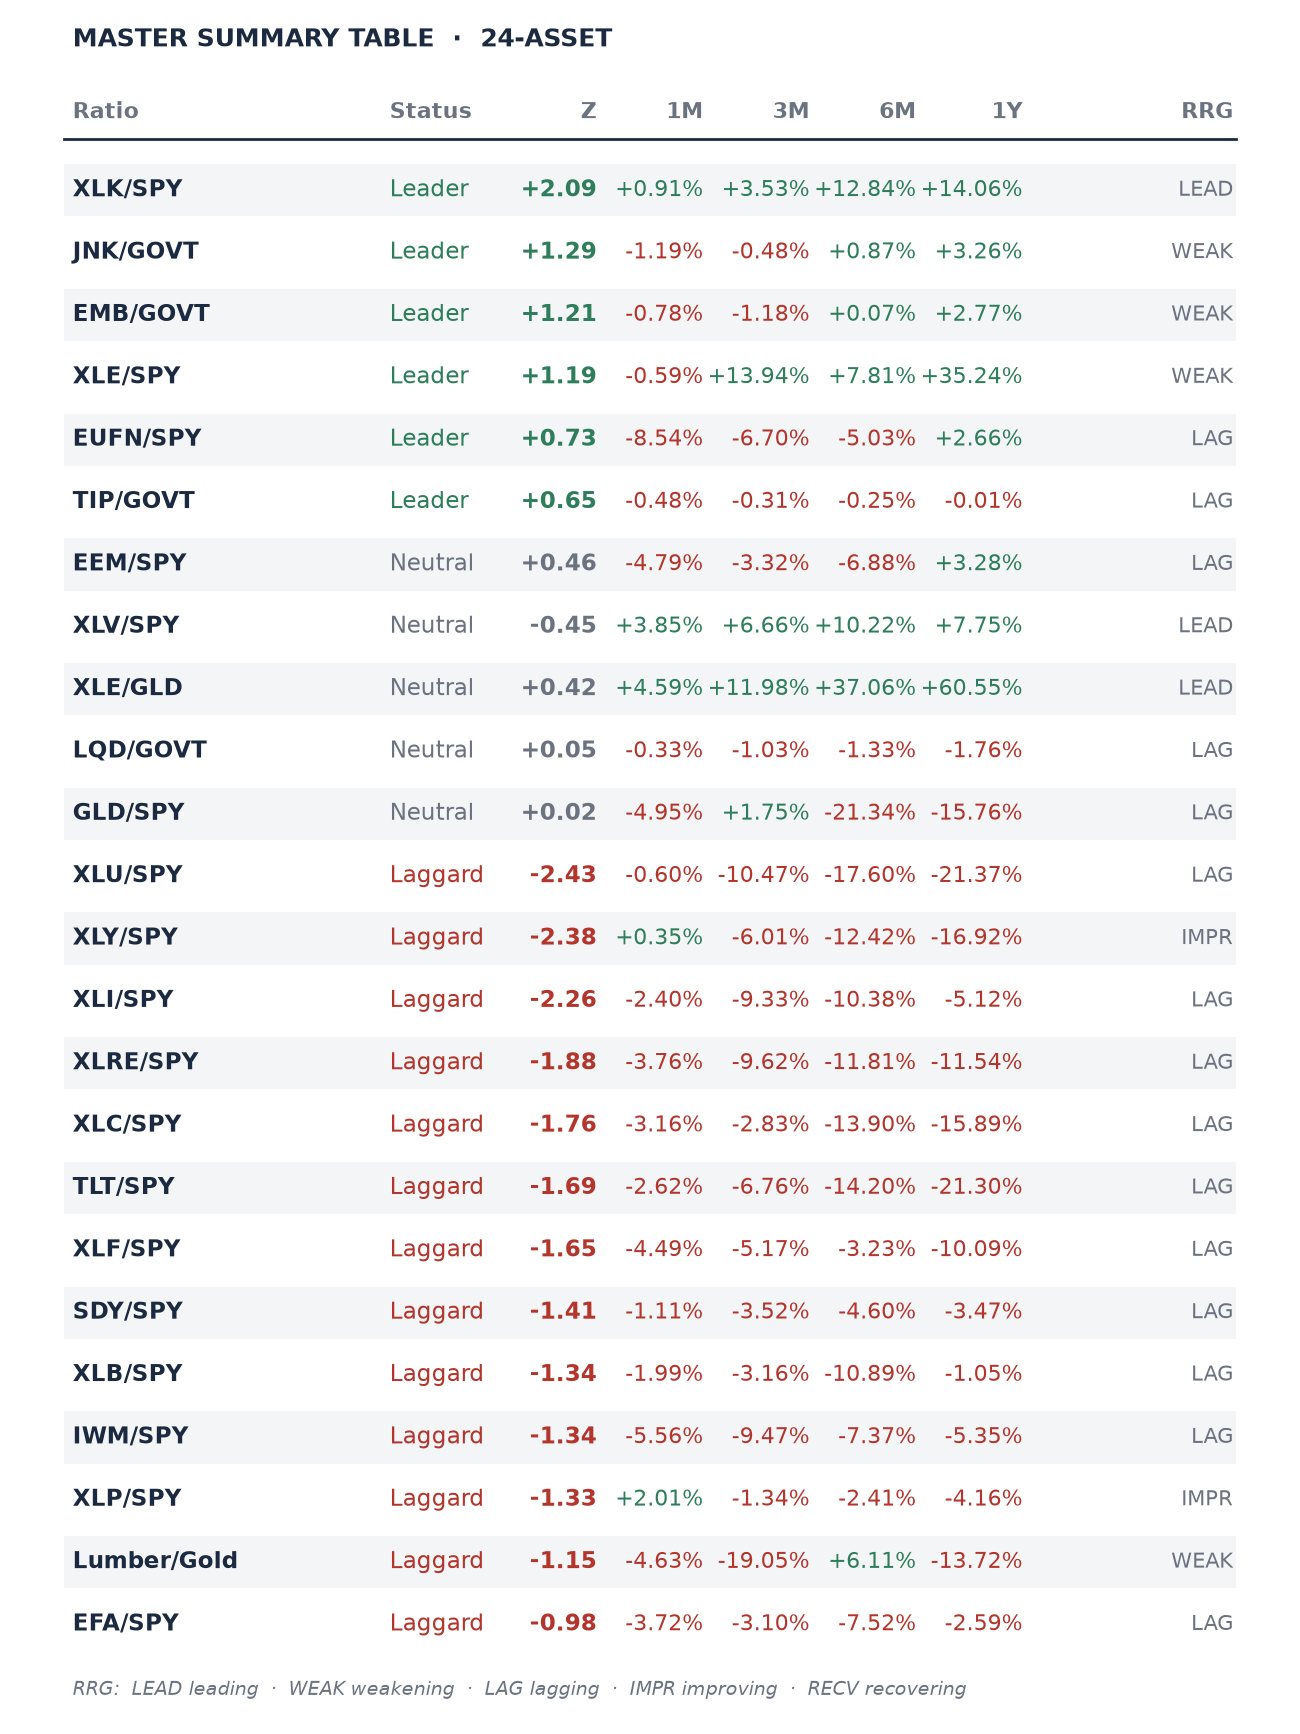
- JNK/GOVT logged its first negative month of the cycle at -1.19%, the flip condition set in Run #32, so credit no longer confirms the risk-on read.
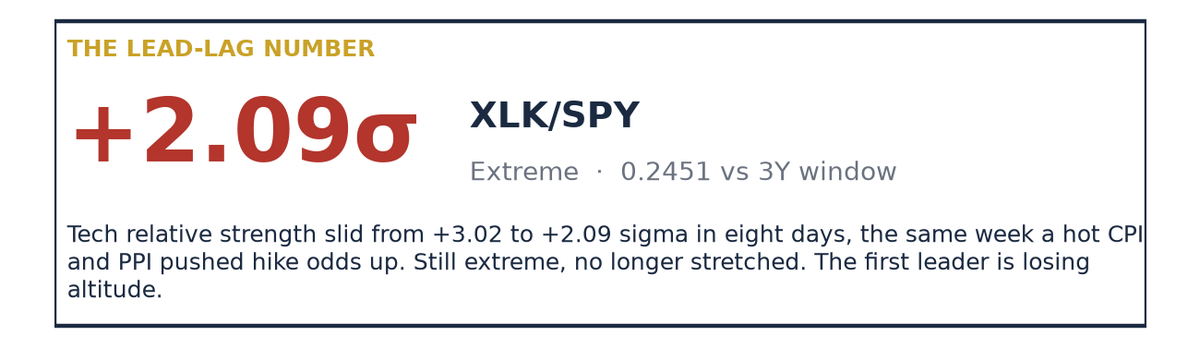
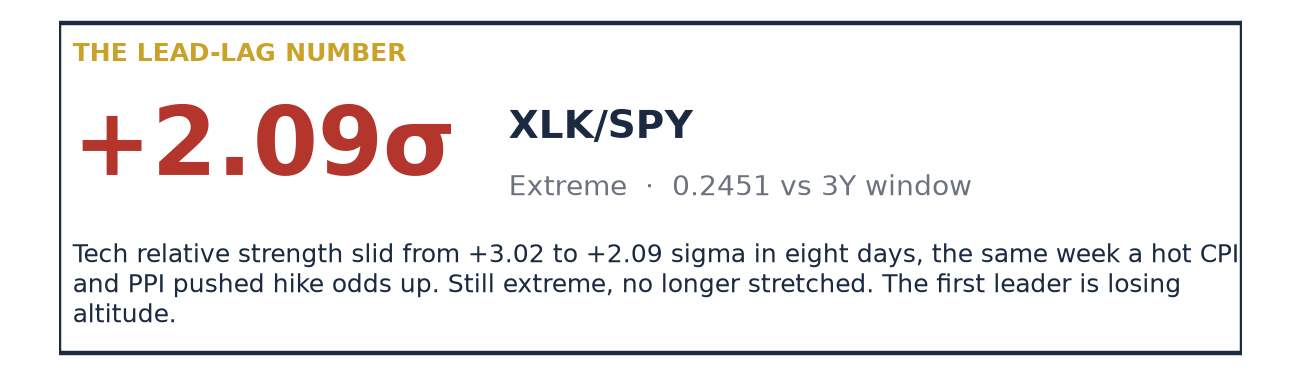
- XLK/SPY eased from +3.02 to +2.09 sigma in eight days while staying positive on the month at +0.91%.
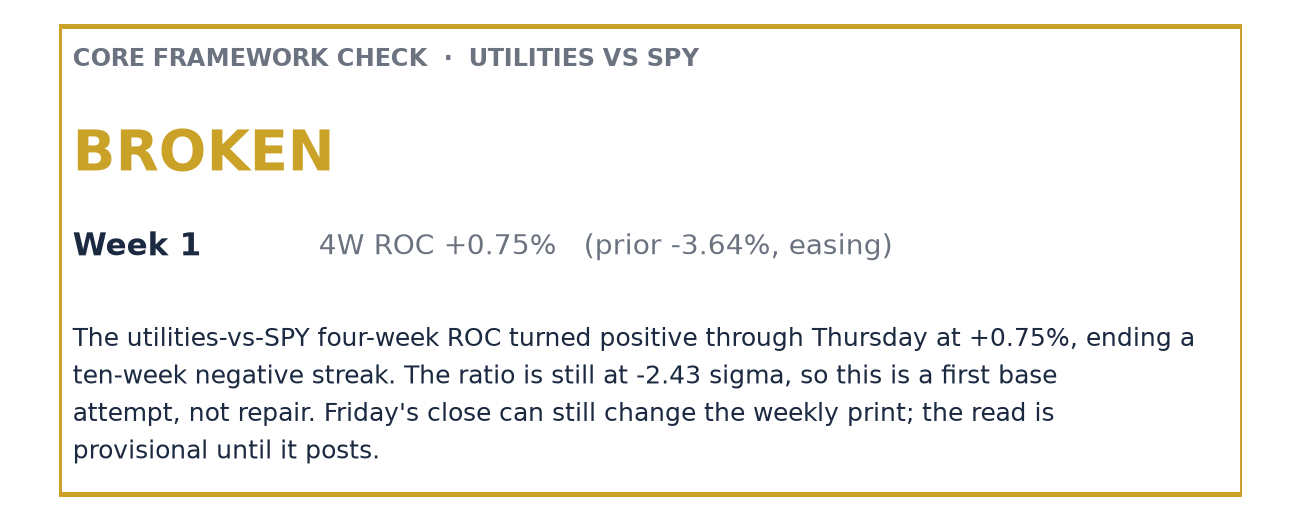
- Utilities versus the S&P 500 turned its four-week momentum positive at +0.75% through Thursday, ending a ten-week negative streak; the reading is provisional until Friday's close.
- September CPI ran 3.7% year over year and PPI 6.3%, and CME FedWatch showed 88% odds of at least a quarter-point hike by December.
Previously on Leaders-Laggards
Run #32 published October 9. Scoring its six forward calls against Thursday's October 15 close, computed from yfinance daily closes. Provisional scoring; definitive scoring is deferred to the Forward Call Scorecard, which holds the canonical ledger.
- XLK/SPY 1M return stays positive: read +0.91%. [CORRECT]
- XLU/SPY 4W ROC remains negative and the streak reaches eleven weeks: read +0.75% on the weekly series through Thursday. [INCORRECT, provisional until Friday's close]
- JNK/GOVT Z stays above +1.0 sigma: read +1.29 sigma. [CORRECT]
- GLD/SPY 1M return stays negative: read -4.95%. [CORRECT]
- XLY/SPY Z remains below -2.5 sigma: read -2.38 sigma. [INCORRECT]
- TLT/SPY 1M return stays negative: read -2.62%. [CORRECT]
Four of six, and the two misses are the story. Last edition scored six for six on persistence calls. This one saw the regime stop persisting: utilities attempted a base and consumer discretionary moved off its extreme. Persistence calls work until the regime turns, and the turn tends to show up in the calls that were most confident.
Streak tracking, verified against the computed series:
- XLU/SPY: the ten-week negative streak ended on Thursday's data; 4W ROC +0.75%, provisional until Friday.
- XLK/SPY: leadership fell from +3.02 to +2.09 sigma; the month remains positive at +0.91%.
- JNK/GOVT: the confirming streak broke on the month, -1.19%, with the level still at +1.29 sigma.
- TLT/SPY: laggard streak extended; -1.69 sigma, 1M -2.62%, 1Y -21.30%.
- GLD/SPY: the monthly decline eased from -8.66% to -4.95%; gold stabilized near 4,170 dollars.
Leaders: Ratios Where the Denominator Is Losing
XLK/SPY · Signal strength: +2.09σ Extreme · RRG: leading
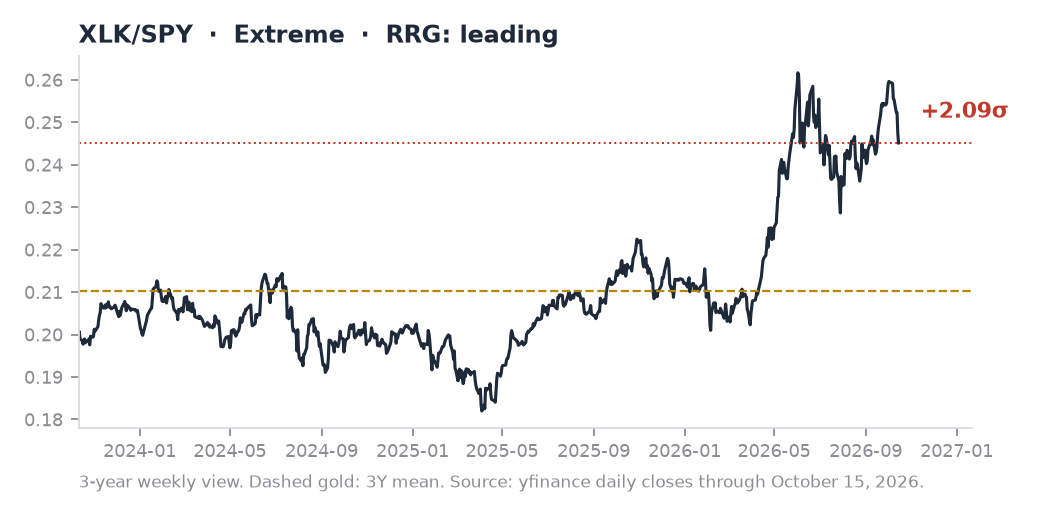
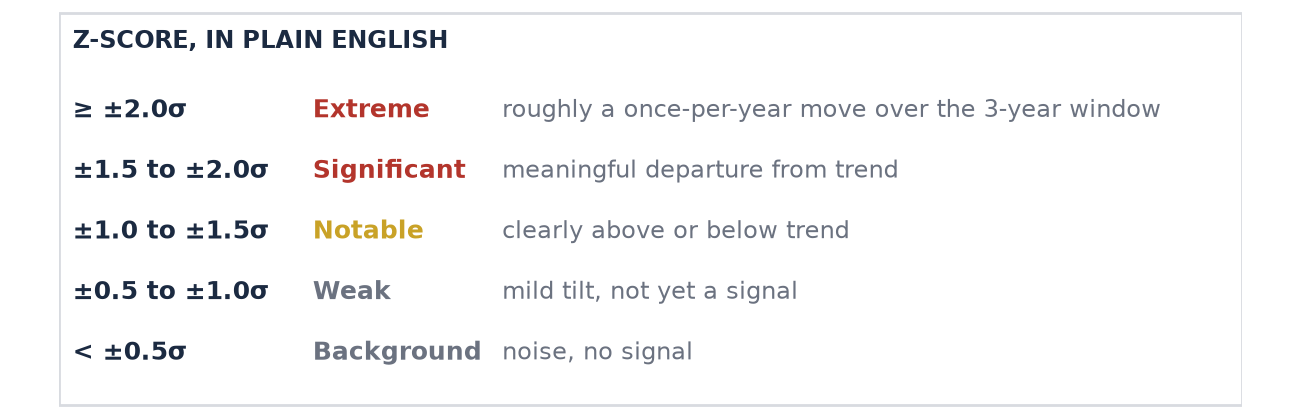
Plain-English: still extreme, but down a full sigma from last edition.
Returns: 1M +0.91% · 3M +3.53% · 6M +12.84% · 1Y +14.06%
Tech relative strength eased to +2.09 sigma from +3.02 eight days ago, with +0.91% on the month and +12.84% over six. The slide came as September CPI printed 3.7% year over year and Thursday's rotation out of tech on AI debt-financing worries, per Investopedia, pulled the Nasdaq from steep losses to a 0.1% gain. The ratio is still extreme, and the month is still positive, so the leadership read stands. What changed is the slope: a three-sigma reading that loses a full sigma in eight days is a leader decelerating, and the next print decides whether it is a pause or a turn.
JNK/GOVT · Signal strength: +1.29σ Notable · RRG: weakening
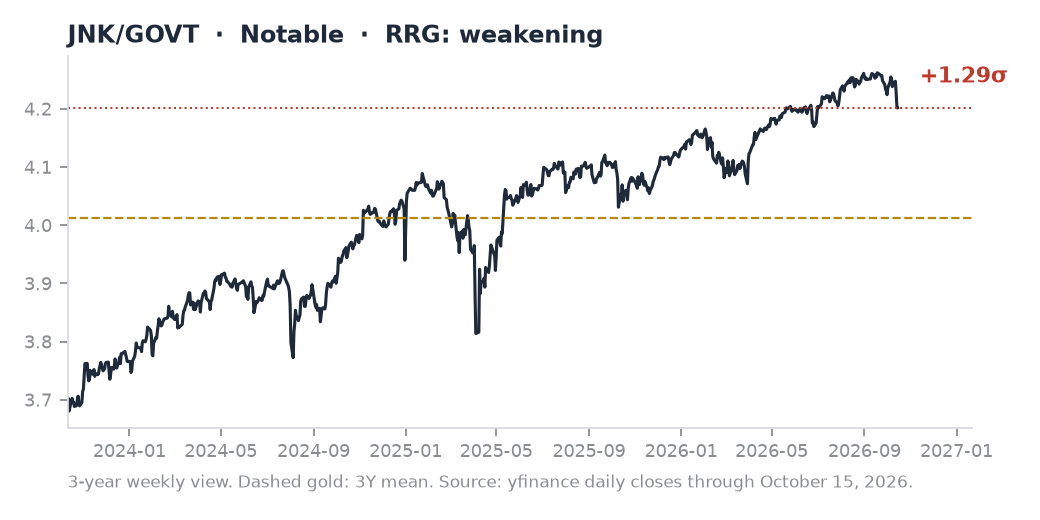
Plain-English: clearly above trend on level, but the month turned negative.
Returns: 1M -1.19% · 3M -0.48% · 6M +0.87% · 1Y +3.26%
High yield against Treasuries printed +1.29 sigma with -1.19% on the month, the first negative month of this cycle and the exact flip condition named in Run #32. The level still sits above the +1.0 line, which is why this is a downgrade and not a reversal. The ten-year touching 5.33% after CPI, per Investopedia, and a September PPI of 6.3% year over year explain the pressure: carry is not compensating for rates that keep rising. Credit no longer confirms the risk-on read on the rule set last week; it is now a watch item.
EMB/GOVT · Signal strength: +1.21σ Notable · RRG: weakening
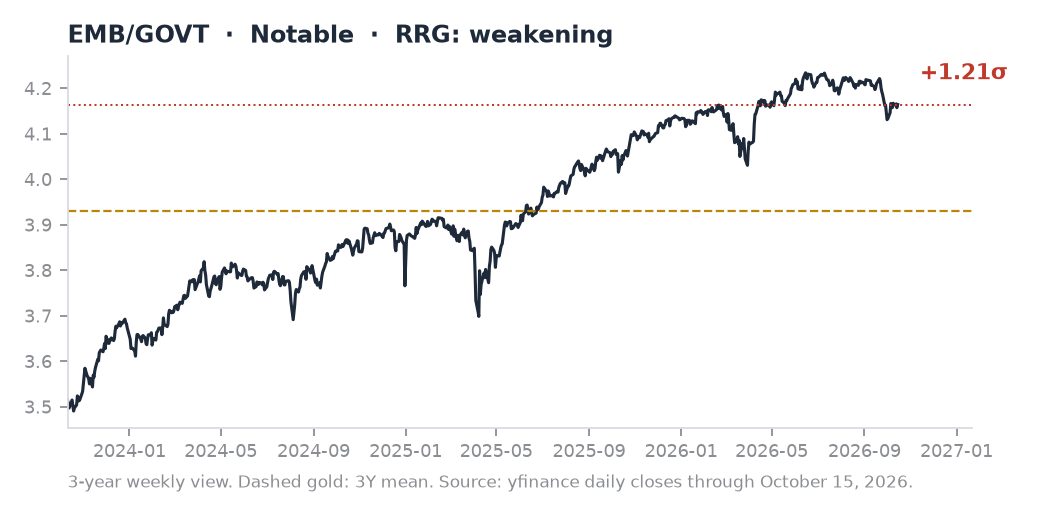
Plain-English: clearly above trend, with the monthly decline easing.
Returns: 1M -0.78% · 3M -1.18% · 6M +0.07% · 1Y +2.77%
Emerging-market debt against Treasuries holds +1.21 sigma with -0.78% on the month and -1.18% over three. The level is unchanged from last edition at +1.20, but the month improved from -1.37%, a small sign that the pressure is easing at the margin. The six-month at +0.07% means the quadrant is leading-to-weakening at best. Emerging-market borrowers are absorbing a hot US inflation print and a 5% ten-year without stress, which is the quiet part of the credit story: the damage so far is in US high yield, not in emerging markets.
XLE/SPY · Signal strength: +1.19σ Notable · RRG: weakening
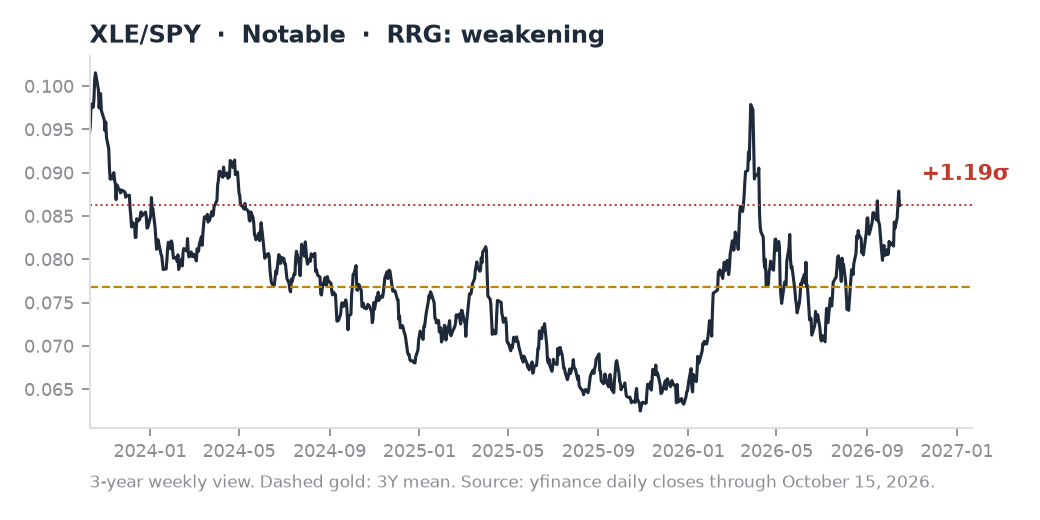
Plain-English: clearly above trend, with the inflation data as the catalyst.
Returns: 1M -0.59% · 3M +13.94% · 6M +7.81% · 1Y +35.24%
Energy against the S&P rose to +1.19 sigma from +0.58, with -0.59% on the month but +13.94% over three and +35.24% over the year. The driver is visible in the CPI: the energy index rose 5.2% in September and 20.4% over twelve months, with gasoline up 9.1% on the month, per BLS, tied to the US-Iran war that began in late February, per CNBC. Energy is the one cyclical group with a macro catalyst the Fed cannot fix, and the ratio crossing +1.0 sigma again says the market is paying for it.
EUFN/SPY · Signal strength: +0.73σ Weak · RRG: lagging
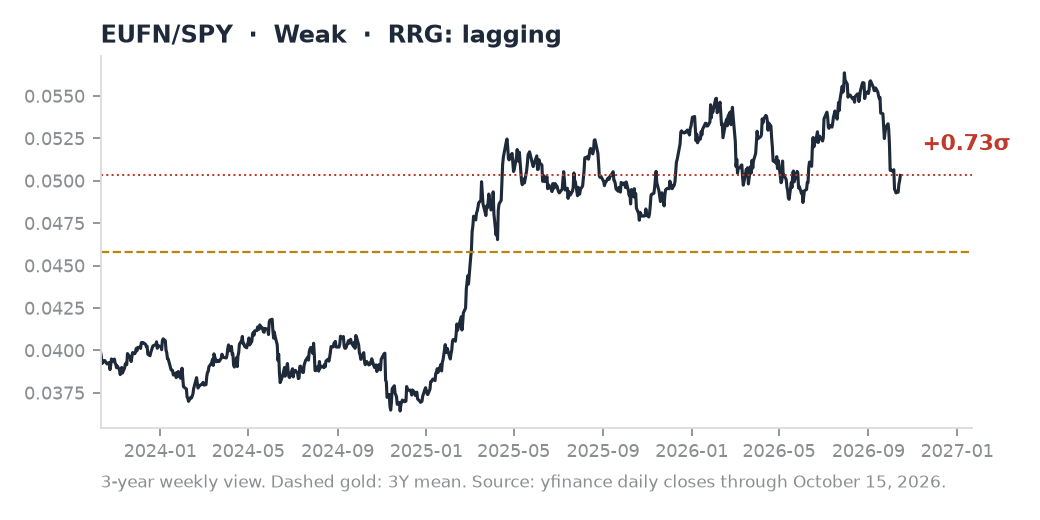
Plain-English: a mild tilt above trend, with the steepest monthly loss among leaders.
Returns: 1M -8.54% · 3M -6.70% · 6M -5.03% · 1Y +2.66%
European financials against the S&P printed +0.73 sigma with -8.54% on the month, easing from the -11.44% pace of Run #32 but still the sharpest monthly decline among the leaders. The one-year at +2.66% keeps it in the leader column, but a monthly loss this size makes it the least stable entry on the list. If the one non-US leadership complex keeps losing ground, the global base under the tech trade is thinner than the S&P level implies.
TIP/GOVT · Signal strength: +0.65σ Weak · RRG: lagging
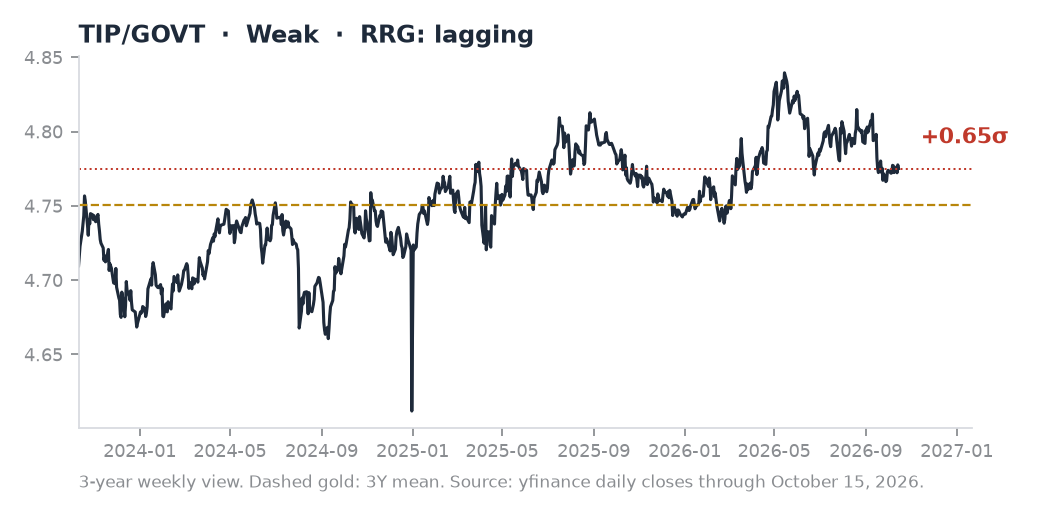
Plain-English: a mild tilt above trend, muted despite a hot inflation print.
Returns: 1M -0.48% · 3M -0.31% · 6M -0.25% · 1Y -0.01%
TIPS against nominal Treasuries printed +0.65 sigma with -0.48% on the month. A hot CPI should have lifted this ratio and it did not, which is a notable absence. The market is treating the September print as an energy shock that the Fed answers with higher real yields, not as a breakeven scare. For a ratio that is supposed to measure inflation fear, the muted reading says fear is of the Fed, not of prices.
EEM/SPY · Signal strength: +0.46σ Background · RRG: lagging
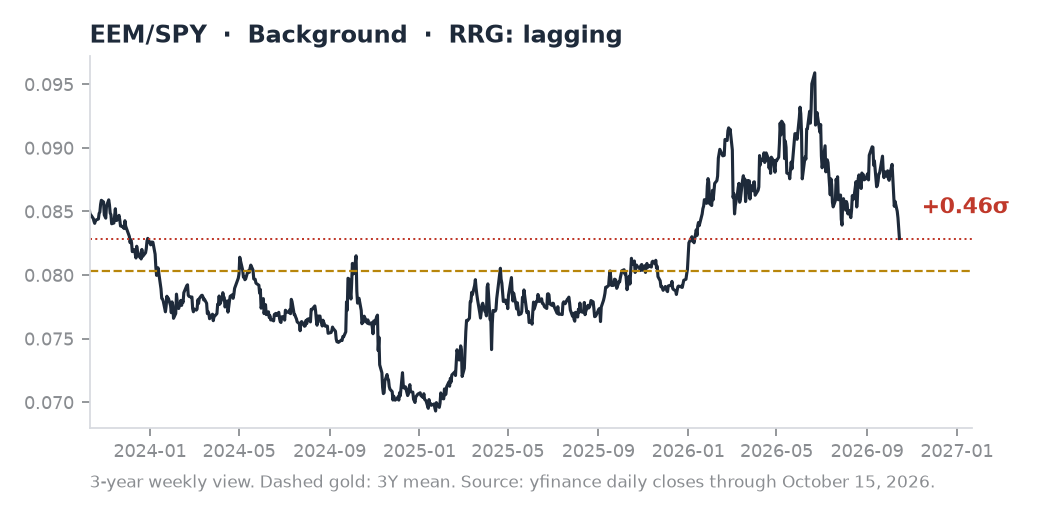
Plain-English: back in the neutral band after losing leader status.
Returns: 1M -4.79% · 3M -3.32% · 6M -6.88% · 1Y +3.28%
Emerging-market equity against the S&P printed +0.46 sigma with -4.79% on the month and -6.88% over six. The ratio has slipped from the +1.14 sigma reading of Run #32 into neutral territory, which is a loss of leader status in eight days. The one-year at +3.28% is all that remains of the argument. With the ten-year near 5.1% and the Fed expected to hike again, dollar-funded emerging equity is the kind of exposure that tends to stall first.
XLE/GLD · Signal strength: +0.42σ Background · RRG: leading
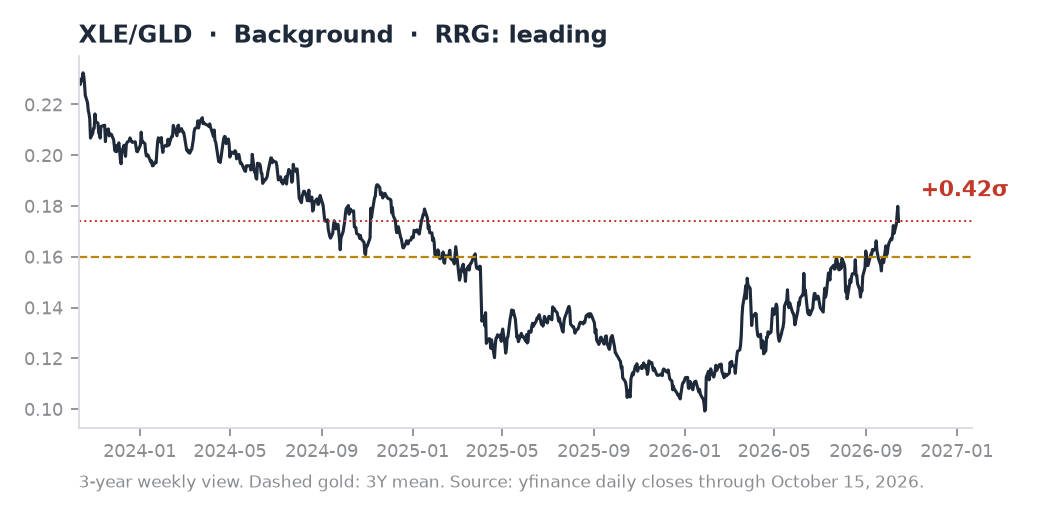
Plain-English: neutral by Z-score, extreme on the year.
Returns: 1M +4.59% · 3M +11.98% · 6M +37.06% · 1Y +60.55%
Energy against gold printed +0.42 sigma with +4.59% on the month, +11.98% over three and +60.55% over the year. The pair has been the cleanest cross-asset statement of the energy-shock regime: the supply-driven commodity beats the monetary metal. Gold futures closed Thursday near 4,170 dollars per yfinance, roughly 1.5% above the 4,110 level of October 7, which narrows the gap but does not change the year. The ratio is neutral by Z-score and extreme by the one-year return.
LQD/GOVT · Signal strength: +0.05σ Background · RRG: lagging
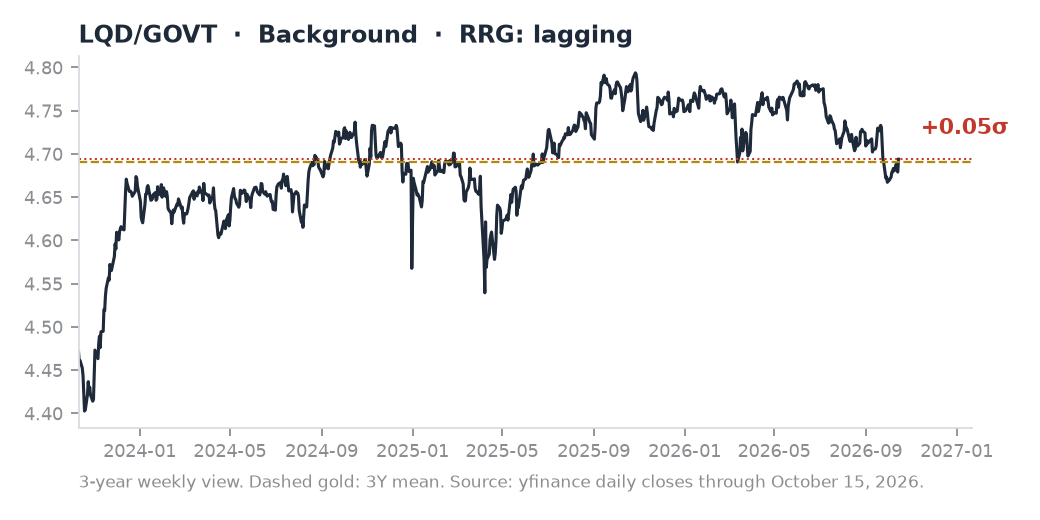
Plain-English: background noise today, the credit signal to watch next.
Returns: 1M -0.33% · 3M -1.03% · 6M -1.33% · 1Y -1.76%
Investment-grade credit against Treasuries sits at +0.05 sigma with -0.33% on the month and -1.76% on the year. This is the quiet credit signal: investment grade has not repriced the way high yield did. Spreads on the safest corporate credit are not where the stress shows, so the credit weakness is a lower-quality story. If LQD/GOVT starts to follow JNK/GOVT lower, the signal upgrades from a high-yield warning to a credit-market one.
GLD/SPY · Signal strength: +0.02σ Background · RRG: lagging
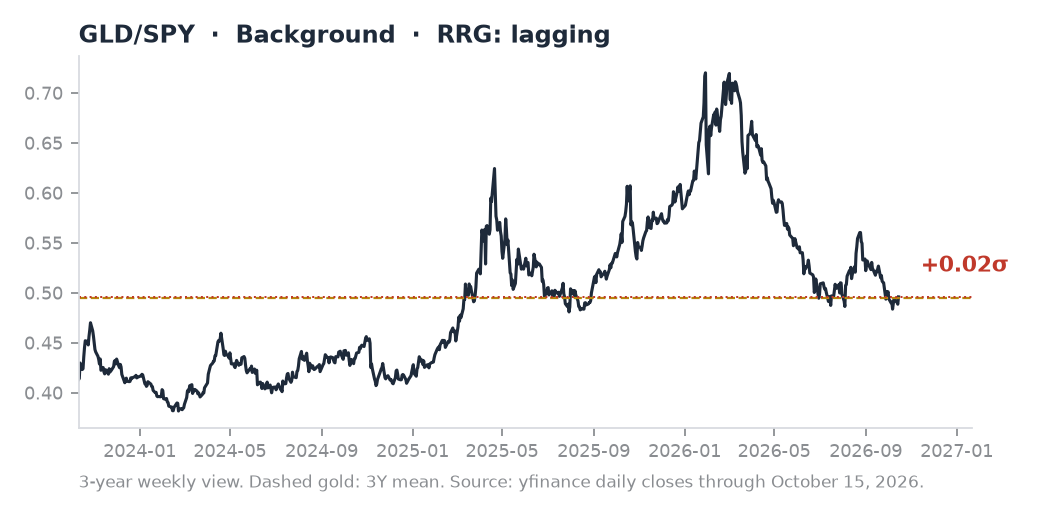
Plain-English: background noise by Z-score, a stabilizing hedge rather than a recovering one.
Returns: 1M -4.95% · 3M +1.75% · 6M -21.34% · 1Y -15.76%
Gold against the S&P sits at +0.02 sigma with -4.95% on the month, +1.75% over three and -21.34% over six. The month improved from the -8.66% pace of Run #32 as gold stabilized near 4,170 dollars, but the six-month decline shows how much of the earlier rally has been unwound. With the ten-year at 5.09% late Thursday, per Investopedia, the opportunity cost of holding gold stays high. The hedge is stable, not repaired.
Credit Confirmation: JNK/GOVT
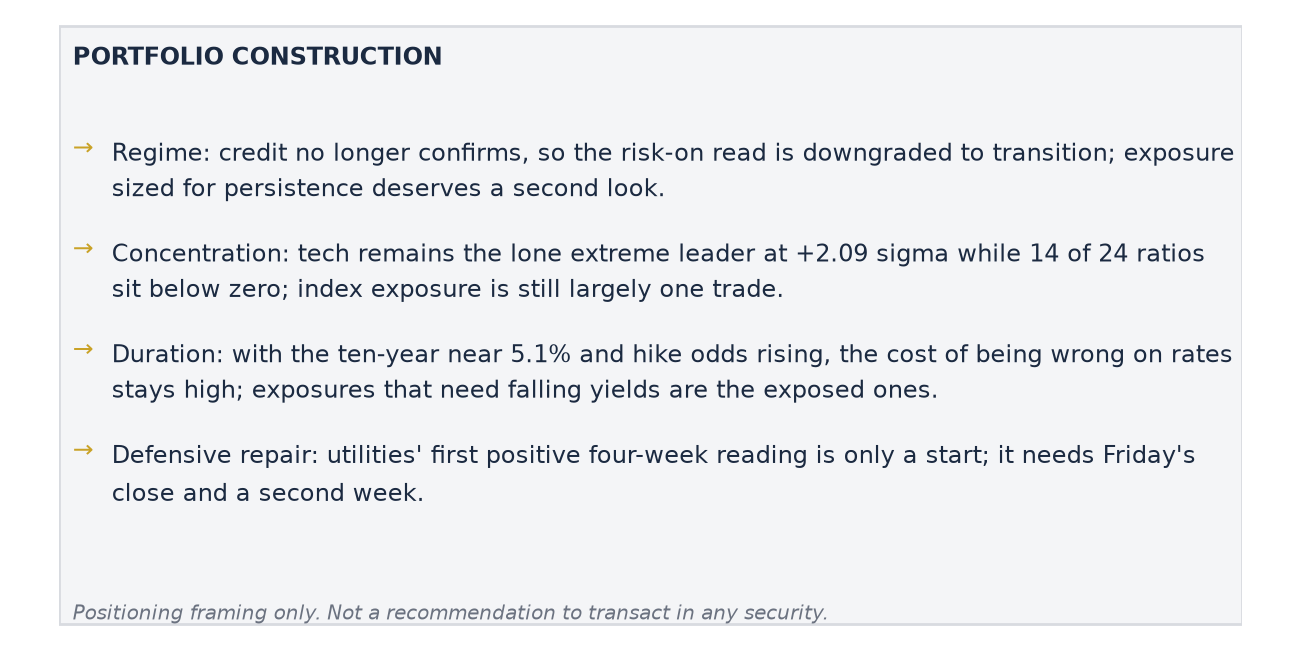
Credit no longer confirms. JNK/GOVT printed -1.19% on the month, its first negative month of the cycle, while the Z-score held at +1.29 sigma. Run #32 set the condition precisely: one clean negative month in JNK/GOVT would move credit from confirming to disconfirming, and that happened in the same week as hot inflation data. September CPI rose 3.7% year over year, above the 3.6% forecast, and PPI rose 6.3%, per BLS and Investopedia. The ten-year hit 5.33% after CPI before easing to about 5.09% on Thursday, per Investopedia. High yield is the part of the credit market most sensitive to that path, and it has started to show it. LQD/GOVT at +0.05 sigma says investment grade has not followed. The distinction matters: a high-yield-only weakness is a risk-appetite signal, while a broad credit move would be a funding signal. For now it is the former.
Laggards: Ratios Where the Denominator Is Winning
XLV/SPY · Signal strength: -0.45σ Background · RRG: leading
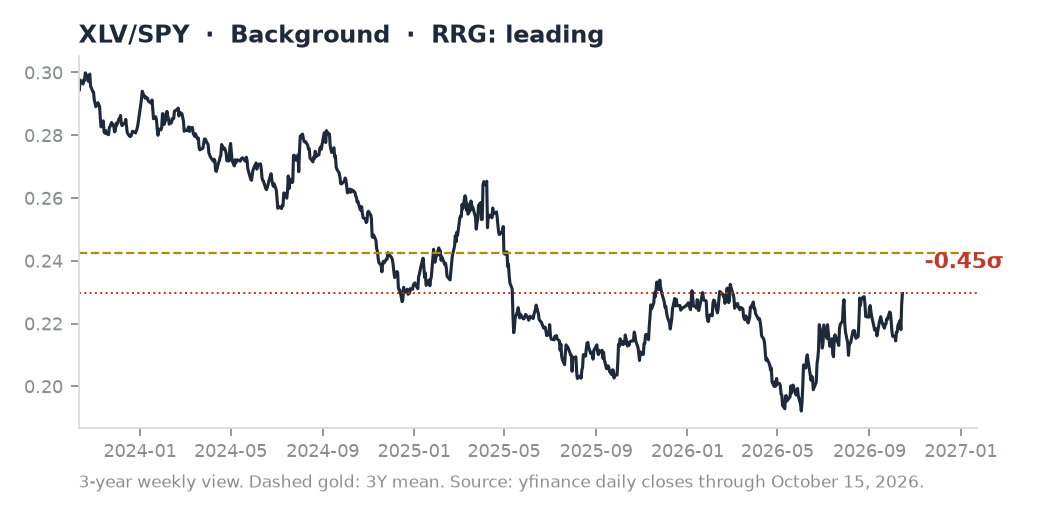
Plain-English: a mild tilt below trend, improving.
Returns: 1M +3.85% · 3M +6.66% · 6M +10.22% · 1Y +7.75%
Health care against the S&P printed -0.45 sigma with +3.85% on the month and +6.66% over three, the best monthly gain in the laggard column and an improvement from -0.89 sigma. Defensive capital is finding the group as tech cools. If the rotation continues, XLV is the first laggard to cross zero and become a leader, which would be the cleanest sign that the rotation is real and not a one-day move.
EFA/SPY · Signal strength: -0.98σ Weak · RRG: lagging
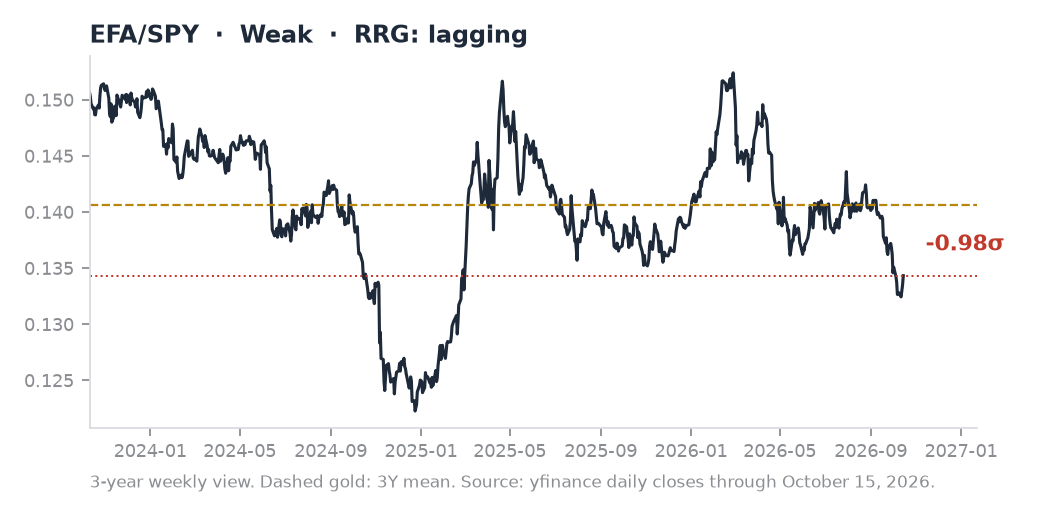
Plain-English: a mild tilt below trend, improving at the margin.
Returns: 1M -3.72% · 3M -3.10% · 6M -7.52% · 1Y -2.59%
Developed international against the S&P holds -0.98 sigma with -3.72% on the month and -7.52% over six. The ratio improved from -1.25 sigma, but a smaller loss is still a loss. Against EEM's slide into neutral, the regional statement is now simpler: neither international complex is leading, and US large cap, via the tech concentration, still sets the tone.
Lumber/Gold · Signal strength: -1.15σ Notable · RRG: weakening
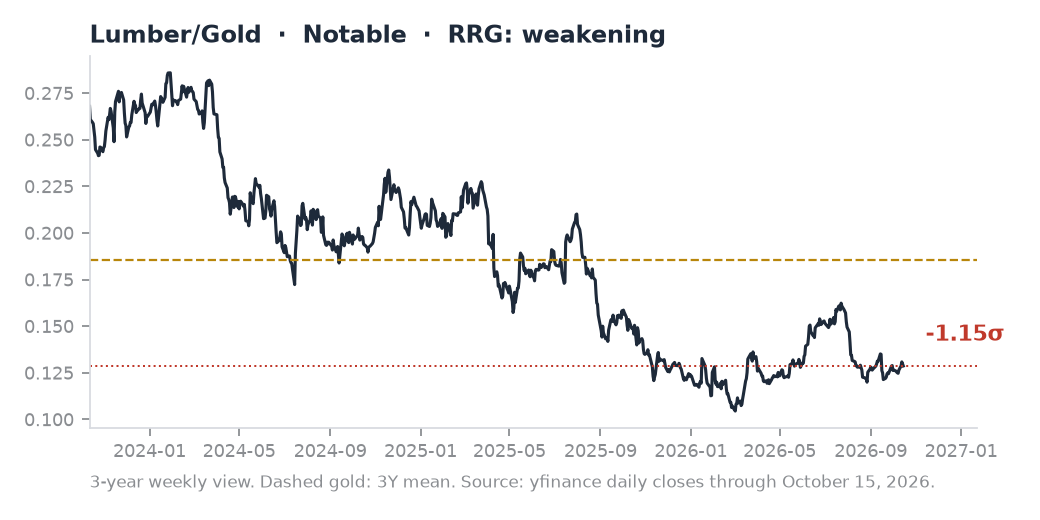
Plain-English: clearly below trend, no sign of a real-economy turn.
Returns: 1M -4.63% · 3M -19.05% · 6M +6.11% · 1Y -13.72%
Lumber against gold printed -1.15 sigma with -4.63% on the month and -19.05% over three. The real-economy signal stays weak, and the three-month decline is the largest in the column. A Beige Book that reports the Sixth District economy growing modestly with prices rising moderately, per the Atlanta Fed report, fits the picture: demand is not collapsing, but it is not building either, and housing-linked inputs are the first to show it.
XLP/SPY · Signal strength: -1.33σ Notable · RRG: improving
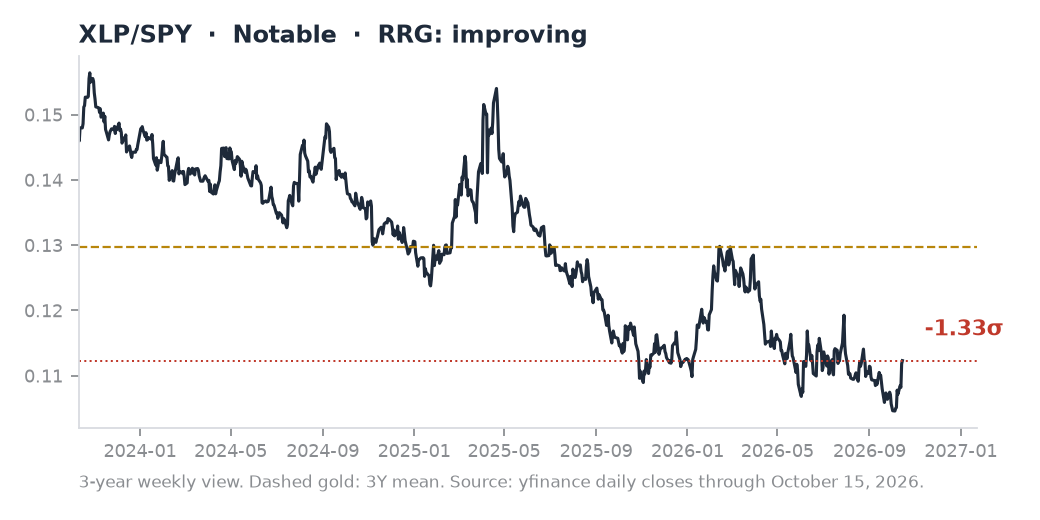
Plain-English: clearly below trend, but the month turned positive.
Returns: 1M +2.01% · 3M -1.34% · 6M -2.41% · 1Y -4.16%
Staples against the S&P printed -1.33 sigma with +2.01% on the month, improving from -1.90 sigma and turning the monthly return positive. The defensive complex is attracting the same rotation capital that lifted health care, which is a notable change from the ten-week liquidation of Run #32. It is early, and the six-month at -2.41% still shows the damage, but this is the second defensive group to put up a positive month.
XLB/SPY · Signal strength: -1.34σ Notable · RRG: lagging
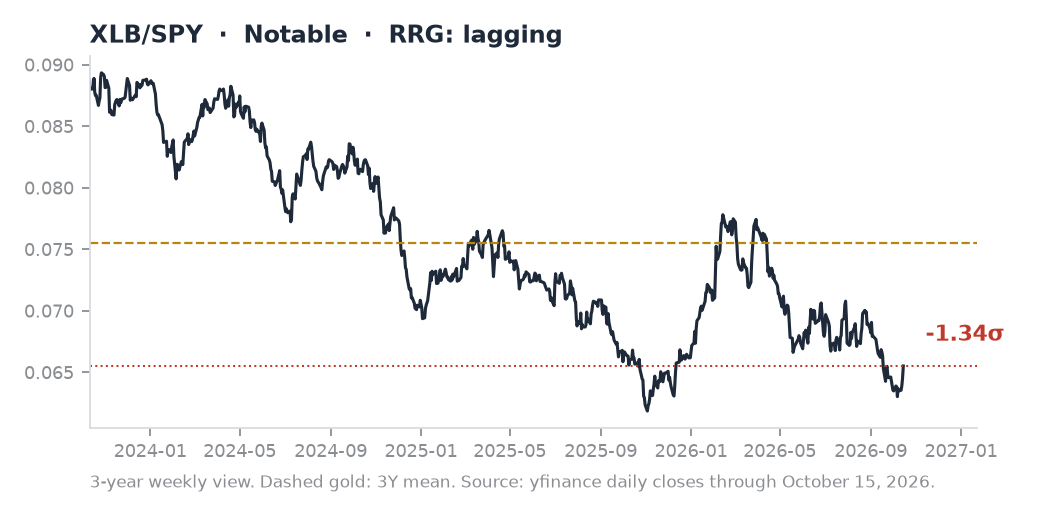
Plain-English: clearly below trend, with the monthly pace easing.
Returns: 1M -1.99% · 3M -3.16% · 6M -10.89% · 1Y -1.05%
Materials against the S&P printed -1.34 sigma with -1.99% on the month and -10.89% over six. The reading improved from -1.69 sigma and the monthly decline narrowed from -7.25%. With energy leading and lumber lagging, materials sits between the supply-shock winners and the demand-sensitive losers. It needs a stable ten-year to rebuild, and that has not arrived.
IWM/SPY · Signal strength: -1.34σ Notable · RRG: lagging
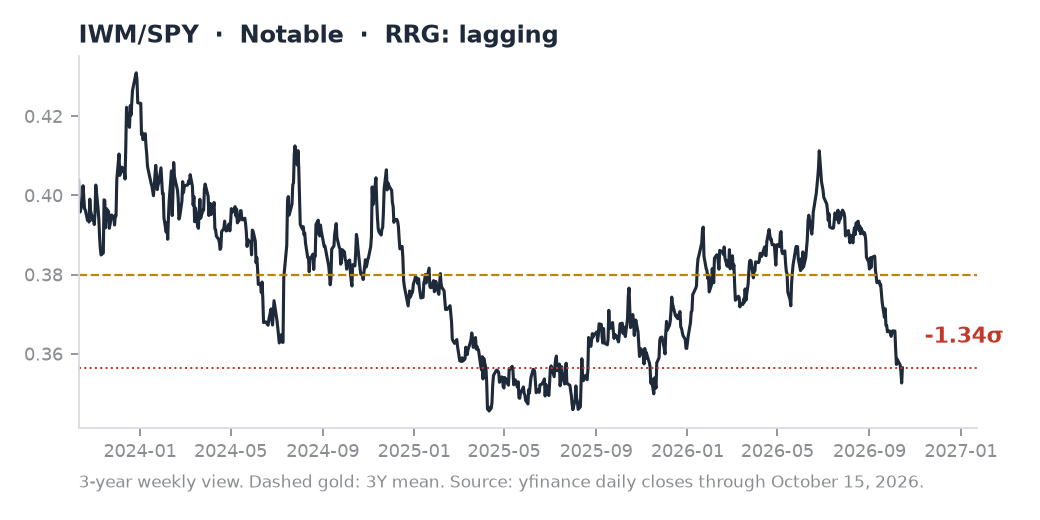
Plain-English: clearly below trend, and not yet part of the rotation.
Returns: 1M -5.56% · 3M -9.47% · 6M -7.37% · 1Y -5.35%
Small caps against the S&P sit at -1.34 sigma with -5.56% on the month and -9.47% over three. The ratio has not repaired: small caps carry floating-rate debt and need a Fed that stops hiking, and the market is pricing the opposite. The rotation out of tech on Thursday went to the Dow, a large-cap price-weighted index, not to small caps, which is information about where the rotation capital is willing to go.
SDY/SPY · Signal strength: -1.41σ Notable · RRG: lagging
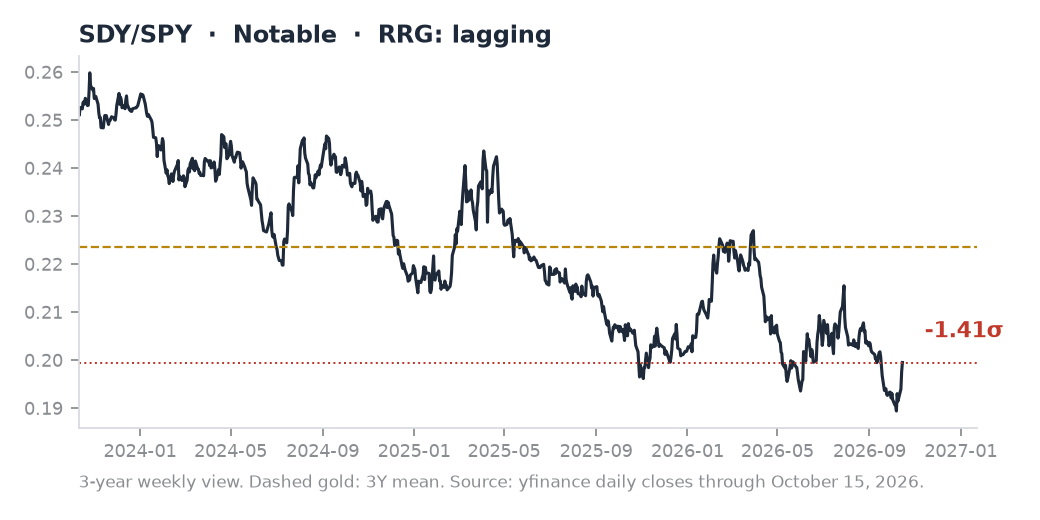
Plain-English: clearly below trend, with the sharpest improvement in the column.
Returns: 1M -1.11% · 3M -3.52% · 6M -4.60% · 1Y -3.47%
Dividend payers against the S&P printed -1.41 sigma with -1.11% on the month, improving from -2.02 sigma and from a -6.10% month. This is the largest monthly improvement among the laggards. The shift fits a rotation story: income equity stopped losing ground as tech stopped gaining it. A positive month is the next step, and it would complete the first genuine defensive base of the cycle.
XLF/SPY · Signal strength: -1.65σ Significant · RRG: lagging
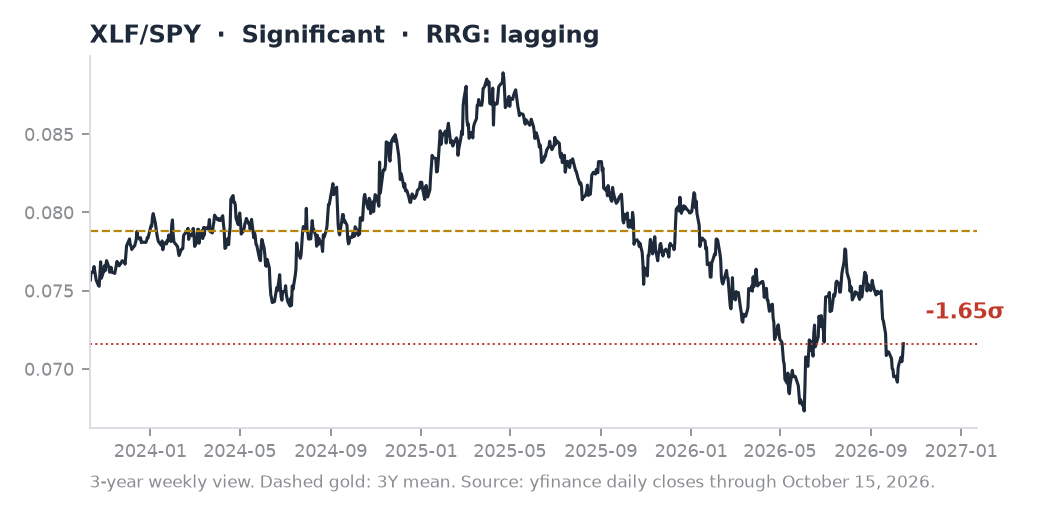
Plain-English: a meaningful departure from trend, improving but still negative.
Returns: 1M -4.49% · 3M -5.17% · 6M -3.23% · 1Y -10.09%
Financials against the S&P sit at -1.65 sigma with -4.49% on the month and -10.09% over the year, improving from -2.24 sigma and from an -8.23% month. Bank stocks usually benefit from higher short rates and suffer from higher defaults, and the market is still deciding which dominates. With high yield turning down, the default side is gaining weight. The ratio stays a laggard until credit stabilizes.
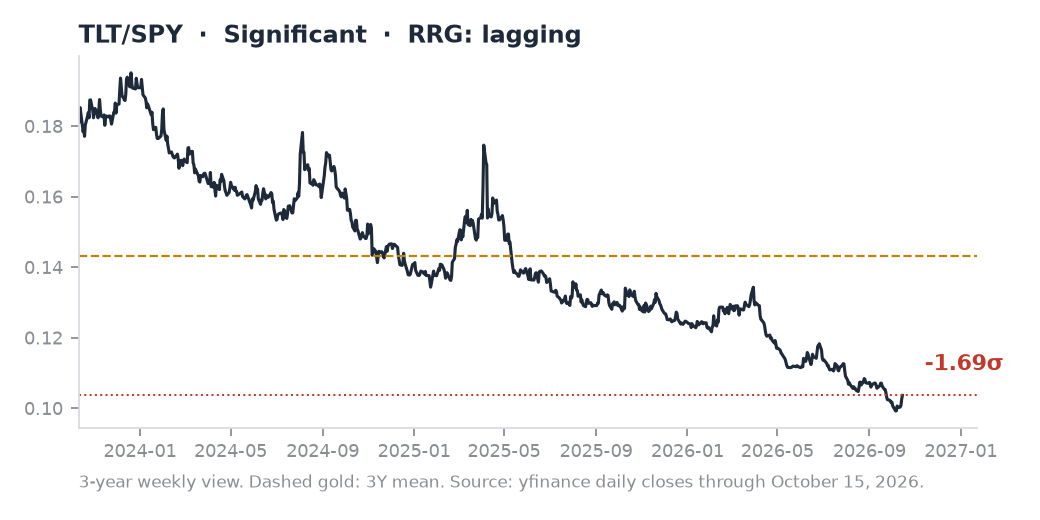
TLT/SPY · Signal strength: -1.69σ Significant · RRG: lagging
Plain-English: a meaningful departure from trend, still the market's rate barometer.
Returns: 1M -2.62% · 3M -6.76% · 6M -14.20% · 1Y -21.30%
The long bond against the S&P sits at -1.69 sigma with -2.62% on the month, -6.76% over three and -21.30% over the year. The ten-year reached 5.33% after the CPI print before easing to about 5.09% on Thursday, per Investopedia, and the long bond has been the market's inflation barometer all year. The monthly decline is smaller than the -6.86% of Run #32, but the year shows how long this has persisted. The Fed's 12-0 vote to hike in September, per federalreserve.gov, tells the market there is no rescue coming.
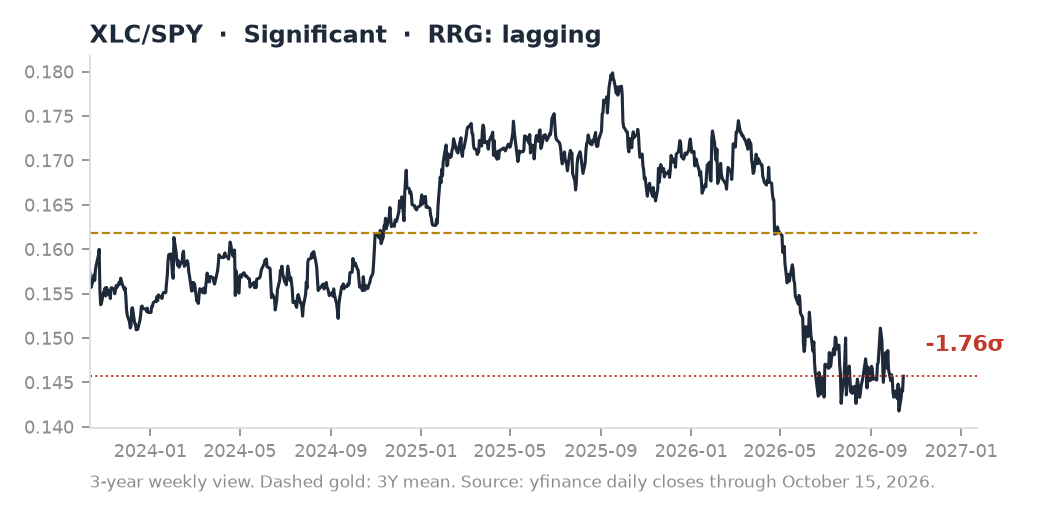
XLC/SPY · Signal strength: -1.76σ Significant · RRG: lagging
Plain-English: a meaningful departure from trend, helped by a weaker index rather than a stronger sector.
Returns: 1M -3.16% · 3M -2.83% · 6M -13.90% · 1Y -15.89%
Communication services against the S&P printed -1.76 sigma with -3.16% on the month and -13.90% over six. The group shares ownership with the tech names that sold off on AI debt-financing worries, so it is exposed to the same pressure without the same earnings cushion. The ratio improved from -2.08 sigma, but a falling Z-score magnitude with a negative month says the denominator weakened, not the group strengthened.
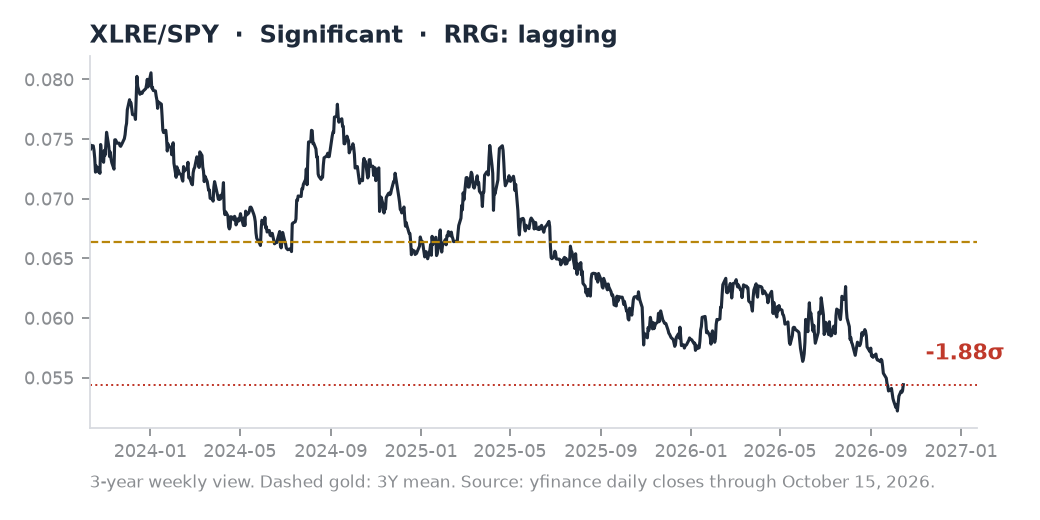
XLRE/SPY · Signal strength: -1.88σ Significant · RRG: lagging
Plain-English: a meaningful departure from trend, sensitive to every move in the ten-year.
Returns: 1M -3.76% · 3M -9.62% · 6M -11.81% · 1Y -11.54%
Real estate against the S&P printed -1.88 sigma with -3.76% on the month and -9.62% over three, improving from -2.27 sigma. Real estate is the equity expression of the ten-year, and the ten-year's pullback from 5.33% to about 5.09% on Thursday helped. A durable improvement needs yields to stay lower, and with hike odds at 88% by December per CME FedWatch, that is the unresolved part.
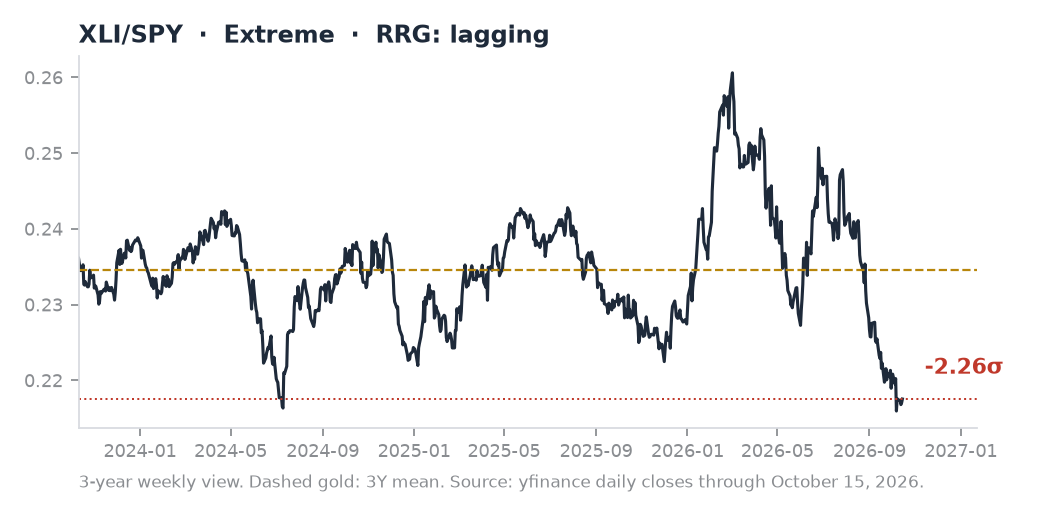
XLI/SPY · Signal strength: -2.26σ Extreme · RRG: lagging
Plain-English: an extreme reading, with the monthly decline easing.
Returns: 1M -2.40% · 3M -9.33% · 6M -10.38% · 1Y -5.12%
Industrials against the S&P sit at -2.26 sigma with -2.40% on the month and -9.33% over three. The monthly decline narrowed from -5.09%. The Boston Fed's Beige Book summary, mixed results by sector with the outlook dimming on cost concerns, is the cleanest macro explanation: industrial demand is steady, but margins are being squeezed by input costs that CPI and PPI both flagged. September retail sales rising 0.8%, per Investopedia, show demand is not the constraint.
XLY/SPY · Signal strength: -2.38σ Extreme · RRG: improving
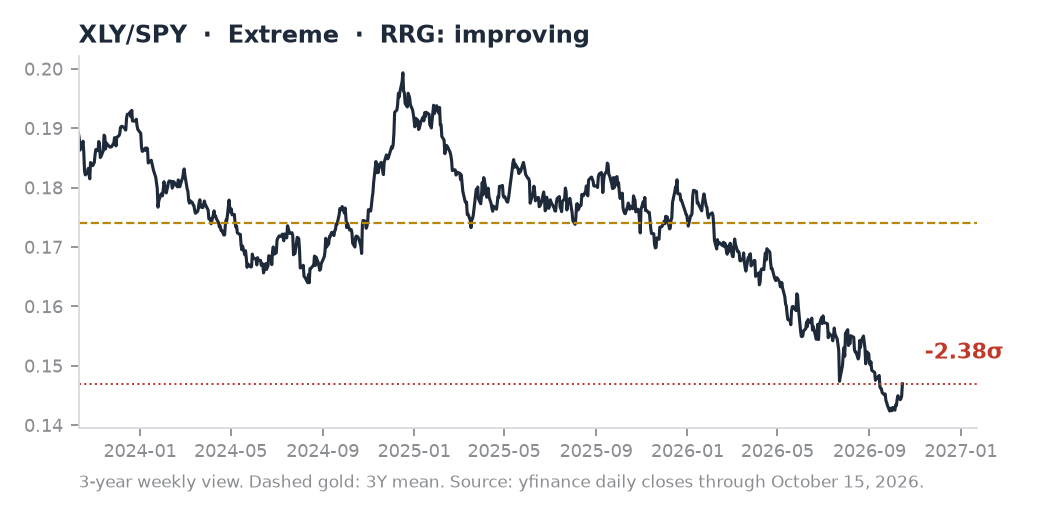
Plain-English: an extreme reading, with the first positive month in the group.
Returns: 1M +0.35% · 3M -6.01% · 6M -12.42% · 1Y -16.92%
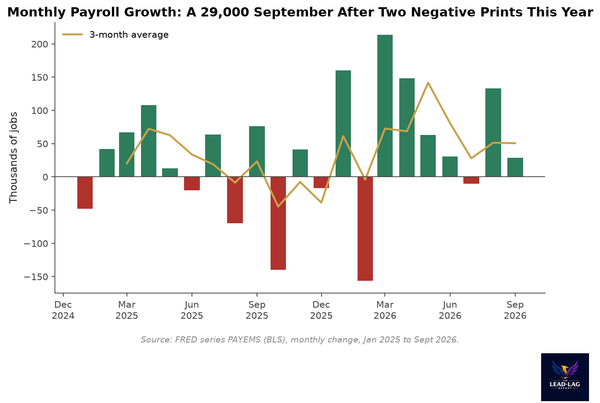
Consumer discretionary against the S&P sits at -2.38 sigma with +0.35% on the month, the first positive month in the extreme laggard group. The year is still -16.92%, and gasoline up 34.2% over twelve months, per CNBC, is a direct tax on this group. A positive month at an extreme Z-score looks like the first stirring of a base, but a consumer facing 3.7% inflation and 29,000 payroll gains is a base with a weak foundation.
XLU/SPY · Signal strength: -2.43σ Extreme · RRG: lagging
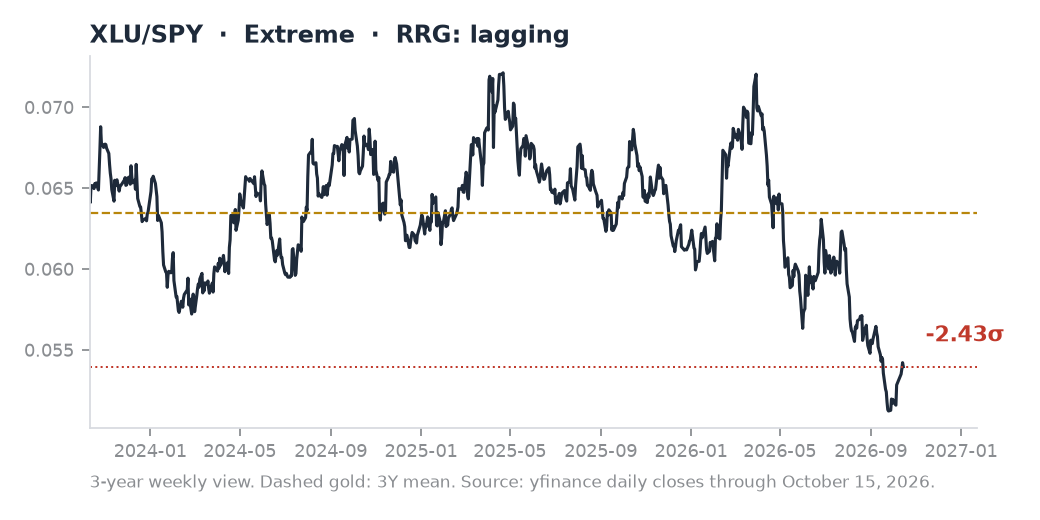
Plain-English: an extreme reading, but the first positive momentum in ten weeks.
Returns: 1M -0.60% · 3M -10.47% · 6M -17.60% · 1Y -21.37%
Utilities against the S&P are the headline laggard at -2.43 sigma, with -0.60% on the month, -10.47% over three and -17.60% over six. The new information is momentum: the weekly four-week ROC reads +0.75% through Thursday against -3.64% a week earlier, ending a ten-week negative streak, provisional until Friday's close. The monthly pace eased from -4.88% to -0.60%, the largest improvement of the cycle. The ratio is still extreme, so this is a base attempt, not a recovery, and the Run #32 flip condition requires two consecutive positive weeks.
What Would Change My View
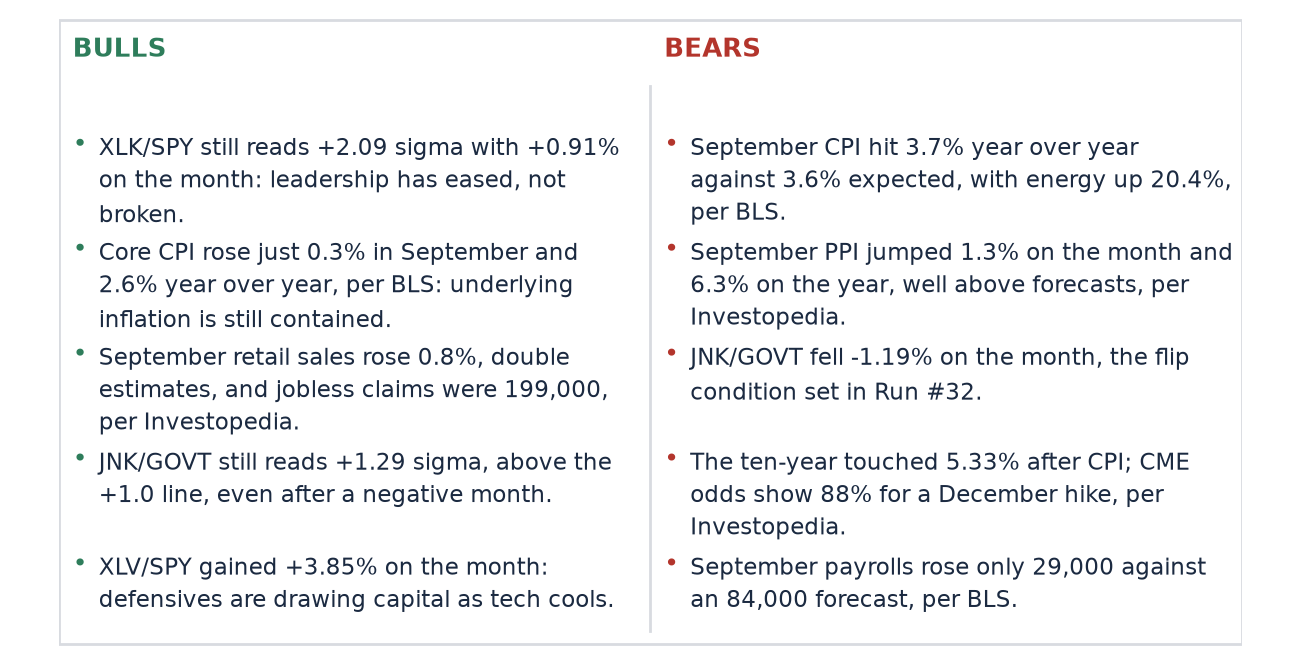
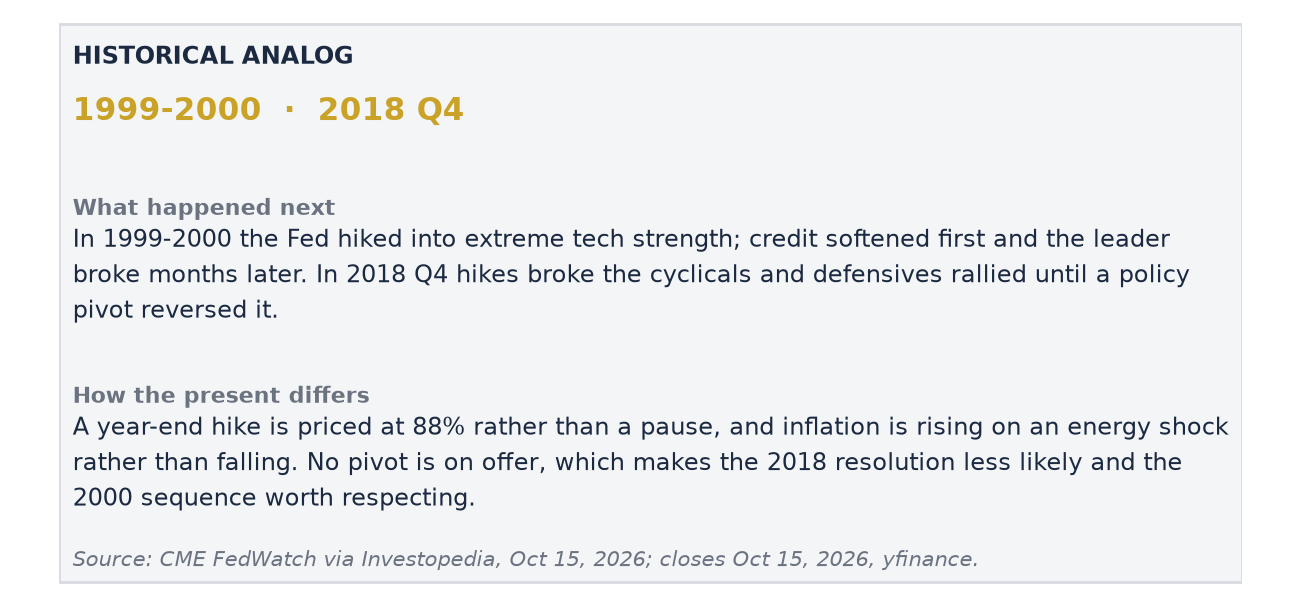
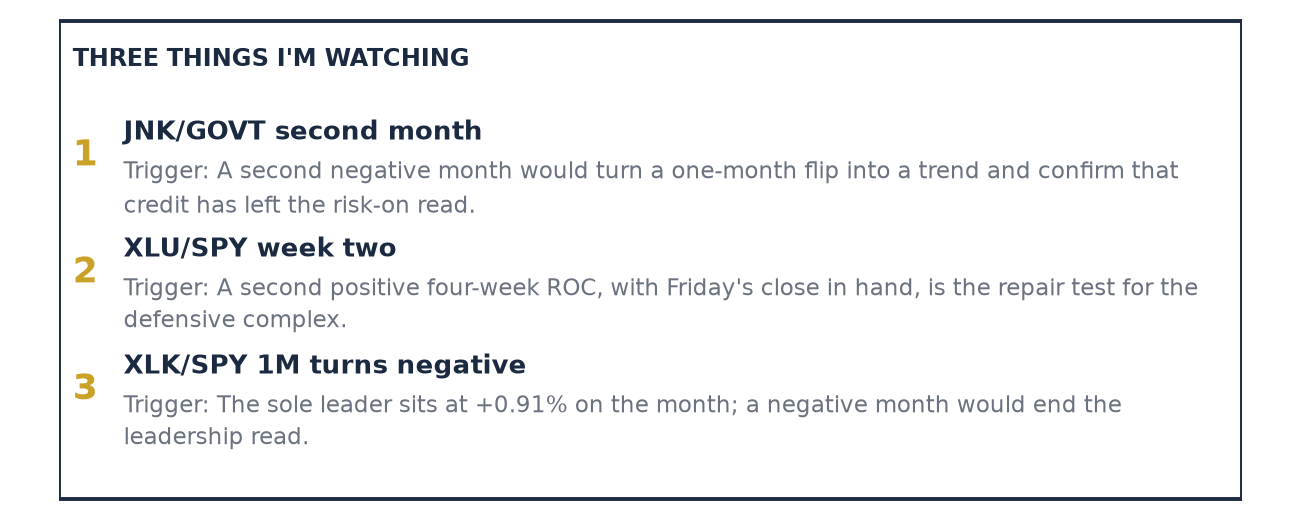
The dominant thesis, a transition from risk-on persistence toward rotation with credit no longer confirming, fails on three conditions. First, a positive month in JNK/GOVT would reset the credit signal; the first negative month was -1.19% and one rebound erases it. Second, a renewed negative four-week ROC in XLU/SPY at Friday's close or next week would show that Thursday's base attempt failed and the defensive complex is still being liquidated. Third, XLK/SPY reaccelerating above +3.0 sigma would say the tech slide was a pause inside persistent leadership. Any one of these returns the regime read to risk-on; none has happened.
The Week in Context
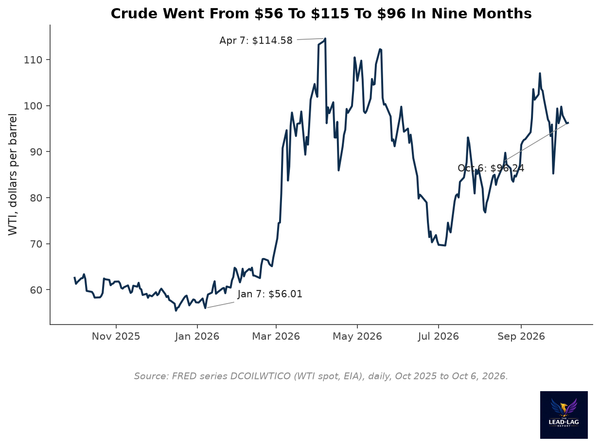
This edition lands in the middle of the Fed's hardest data stretch of the year. The September CPI released October 14 rose 0.6% on the month and 3.7% on the year, with gasoline up 9.1% and energy up 20.4% over twelve months, per BLS. Core rose 0.3% on the month and 2.6% on the year, above the 0.2% and 2.5% forecasts, per CNBC. The S&P 500 fell 1.1% to 7,718.94 and the Nasdaq fell 1.9% on Wednesday, their worst days since July, per Investopedia. On Thursday, PPI rose 1.3% on the month and 6.3% on the year against forecasts of 0.6% and 5.5%, retail sales rose 0.8%, and jobless claims came in at 199,000. The Dow gained 1.1%, the S&P 500 0.3% and the Nasdaq 0.1% as investors rotated out of tech on concerns about debt used to fund the AI buildout, per Investopedia. The Fed raised its target range to 3-3/4 to 4 percent on a 12-0 vote on September 16, per federalreserve.gov, and CME FedWatch showed a 29% chance of a hike at the October 27-28 meeting and 88% for at least a quarter point by December on Thursday, down from roughly 54% for October on Wednesday, per Investopedia and CNBC. The Beige Book, also released October 14, described modest growth, moderately rising prices and an outlook dimming on cost concerns, per the Atlanta and Boston Fed reports. September payrolls rose 29,000 against an 84,000 forecast, with unemployment at 4.2%, per BLS. Data in this edition runs through Thursday's close; Friday's close is pending and could change the XLU/SPY weekly reading.
Forward Calls: Testable Predictions for Run #34
Six calls, each objectively scoreable against the next edition's close:
- [XLK/SPY] The 1M return turns negative. Reasoning: the ratio lost a full sigma in eight days and the month is only +0.91%.
- [JNK/GOVT] The 1M return stays negative for a second month. Reasoning: hot PPI and a ten-year near 5.1% keep carry from compensating.
- [XLU/SPY] The 4W ROC stays positive on the weekly series. Reasoning: the monthly pace improved from -4.88% to -0.60%, and defensive rotation is under way.
- [TLT/SPY] The Z-score stays below -1.5 sigma. Reasoning: the Fed voted 12-0 to hike and markets price more.
- [XLE/SPY] The Z-score stays above +1.0 sigma. Reasoning: energy inflation of 20.4% is the Fed's problem and the market's catalyst.
- [XLY/SPY] The Z-score stays below -2.0 sigma. Reasoning: gasoline up 34.2% over twelve months taxes the consumer.
Sources
- BLS Consumer Price Index, September 2026: bls.gov/news.release/cpi.nr0.htm
- CNBC, September CPI report: cnbc.com
- Investopedia, Markets News, Oct. 15, 2026: investopedia.com
- Federal Reserve, September 16, 2026 FOMC statement: federalreserve.gov; meeting calendar: federalreserve.gov
- Beige Book, October 14, 2026: Atlanta, Boston
- BLS Employment Situation, September 2026: bls.gov
- Ratios, returns and Z-scores computed from yfinance daily closes through October 15, 2026.
Disclaimer
The Lead-Lag Report is provided by Lead-Lag Publishing, LLC. All opinions and views mentioned in this report constitute our judgments as of the date of writing and are subject to change at any time. Information within this material is not intended to be used as a primary basis for investment decisions and should also not be construed as advice meeting the particular investment needs of any individual investor. Trading signals produced by the Lead-Lag Report are independent of other services provided by Lead-Lag Publishing, LLC or its affiliates, and positioning of accounts under their management may differ. Please remember that investing involves risk, including loss of principal, and past performance may not be indicative of future results. Lead-Lag Publishing, LLC, its members, officers, directors and employees expressly disclaim all liability in respect to actions taken based on any or all of the information on this writing.