The Fed Is Hiking Into A Supply Shock
Gasoline is up 39% in a year and crude has round-tripped from $56 to $115 to $96, yet the Fed is raising rates against it. A central bank can tighten demand. It cannot produce a barrel.

Today’s Lead-Lag Report post is sponsored by Sparkline

Looking for a fresh take on value investing? ITAN helps investors modernize their U.S. value allocations, providing exposure to innovative, intangible-rich companies at attractive prices.
Learn more by visiting the ITAN Website or contacting the Sparkline Team.
DISCLAIMER – PLEASE READ: This is sponsored advertising content for which Lead-Lag Publishing, LLC has been paid a fee. The information provided in the link is solely the creation of Sparkline Capital. Lead-Lag Publishing, LLC does not guarantee the accuracy or completeness of the information provided in the link or make any representation as to its quality. All statements and expressions provided in the link are the sole opinion of Sparkline Capital and Lead-Lag Publishing, LLC expressly disclaims any responsibility for action taken in connection with the information provided in the link.
The Fed Is Hiking Into A Supply Shock
Gasoline is up 39% in a year, crude has round-tripped from $56 to $115 to $96, and the Federal Reserve is raising rates against it. A central bank can tighten demand. It cannot produce a barrel.
MICHAEL A. GAYED, CFA
Key Highlights
- WTI crude closed at $96.24 on October 6, up 54% from $62.49 a year earlier, after a 2026 range of $56.01 on January 7 to $114.58 on April 7.
- Retail regular gasoline averaged $4.354 a gallon in the week of October 5, up 39% year over year and 57% above the January low of $2.779.
- Crude exports through the Strait of Hormuz ran near 8.5 million barrels a day in the week ended October 7, roughly 40% below normal pre-war levels.
- The Fed raised its target range to 3.75% to 4.00% on September 16, while September payrolls rose just 29,000 against a forecast of 84,000.
The Federal Reserve raised interest rates on September 16 to fight an inflation problem whose loudest component is a barrel of oil that no rate increase can create.[1]
That is not an argument that the Fed is wrong. It is an argument that the Fed is doing the only thing it can do, and that the market has not decided what the thing is worth. Monetary policy works on demand: it makes borrowing more expensive, cools spending, and eventually lowers the pace at which prices rise. A supply shock is a different animal. When a shipping lane narrows and fuel gets scarce, prices rise because there is less of the good, not because households are spending too much. Raising rates against that shock can still lower inflation, but only by pushing the rest of the economy down far enough to offset the energy bill. The question for October is how far down that is.
The Shock In Numbers
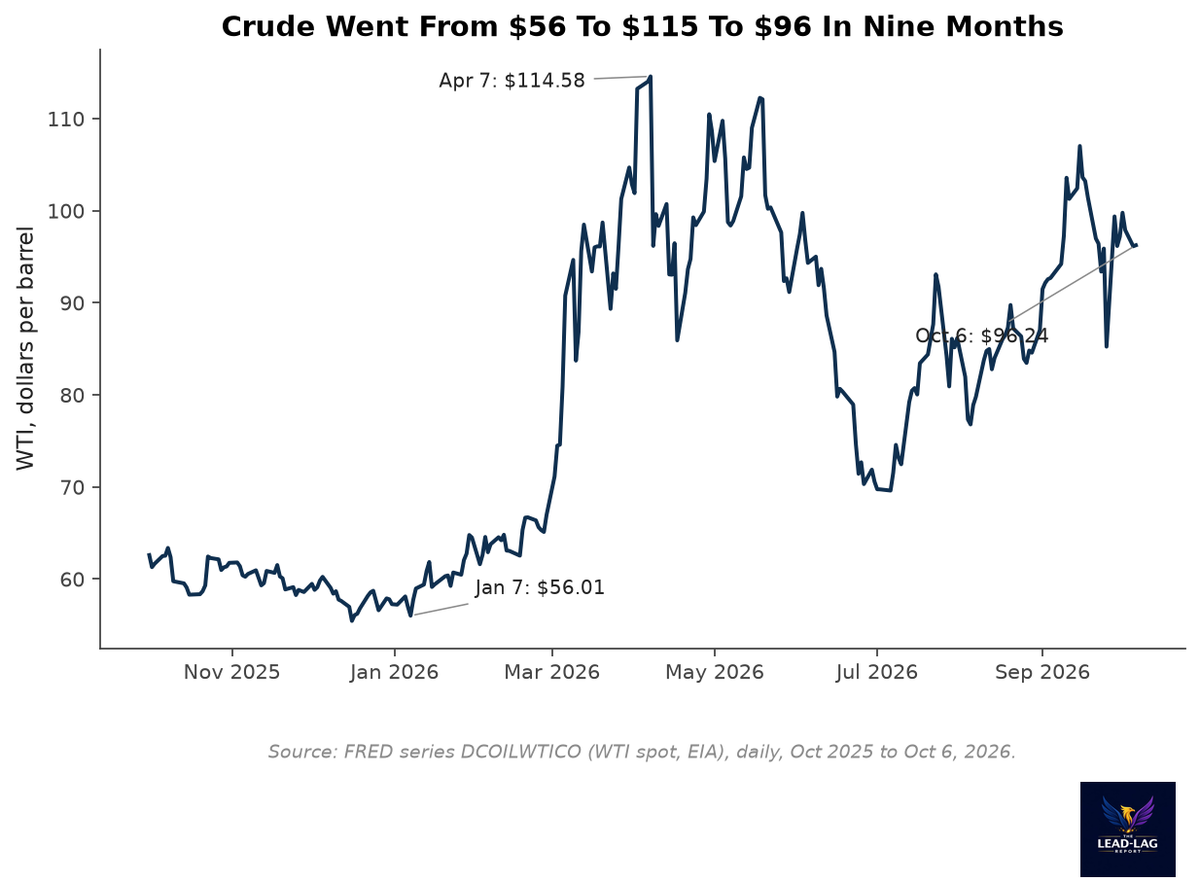
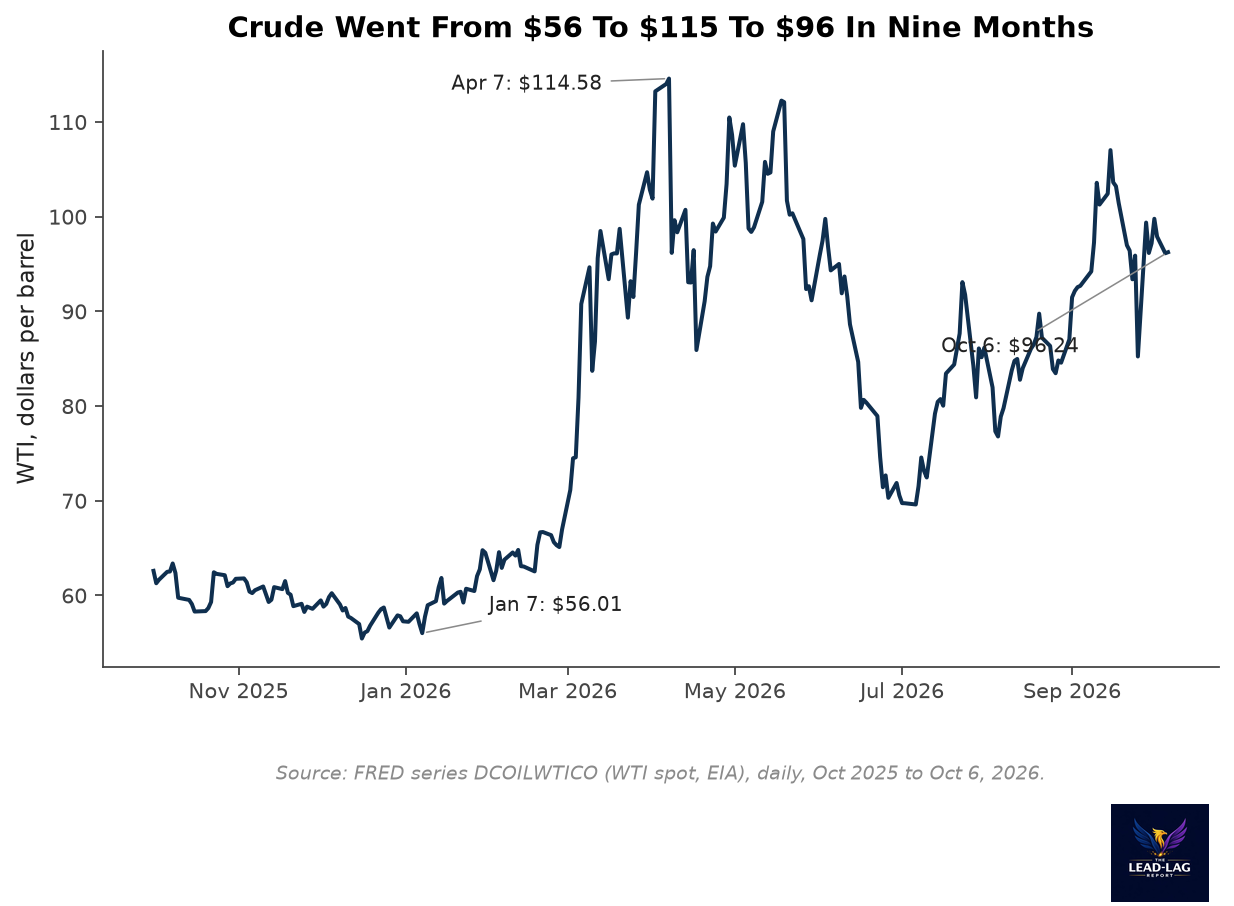
Start with crude, because everything else follows from it. WTI traded at $56.01 on January 7, its low for the year. By April 7 it had reached $114.58, a doubling in three months. It has since retreated, then climbed again, and closed at $96.24 on October 6.[2] The settlement on Friday, October 9 was $91.67 for WTI and $104.53 for Brent.[3] This is not a spike that came and went. It is a plateau, and the plateau sits roughly 54% above where crude stood a year ago.
The physical driver is shipping, not drilling. Kpler data cited by TradingKey put crude exports through the Strait of Hormuz at about 8.5 million barrels a day in the week ended October 7, roughly 40% below normal pre-war levels, while exports from the entire Middle East were about 15.3 million barrels a day, around 10% below pre-war levels.[3] On October 9, the Islamic Revolutionary Guard Corps claimed an attack on an LPG tanker in the strait, and there were separate, unconfirmed reports of mines in the Bab-el-Mandeb Strait.[3] The oil is still in the ground. The problem is getting it out through a narrow channel that is now contested. That is exactly the kind of constraint a higher federal funds rate does nothing to relieve.
The pump price is where the shock reaches households. Retail regular gasoline averaged $4.354 a gallon in the week of October 5, compared with $3.118 a year earlier, an increase of 39%.[4] From the January low of $2.779 the move is 57%. The 2026 peak was $4.50 in the week of May 11, so gasoline is within about 3% of its high for the year.[4] For a consumer who drives to work, this is a tax increase that arrives weekly and requires no act of Congress.
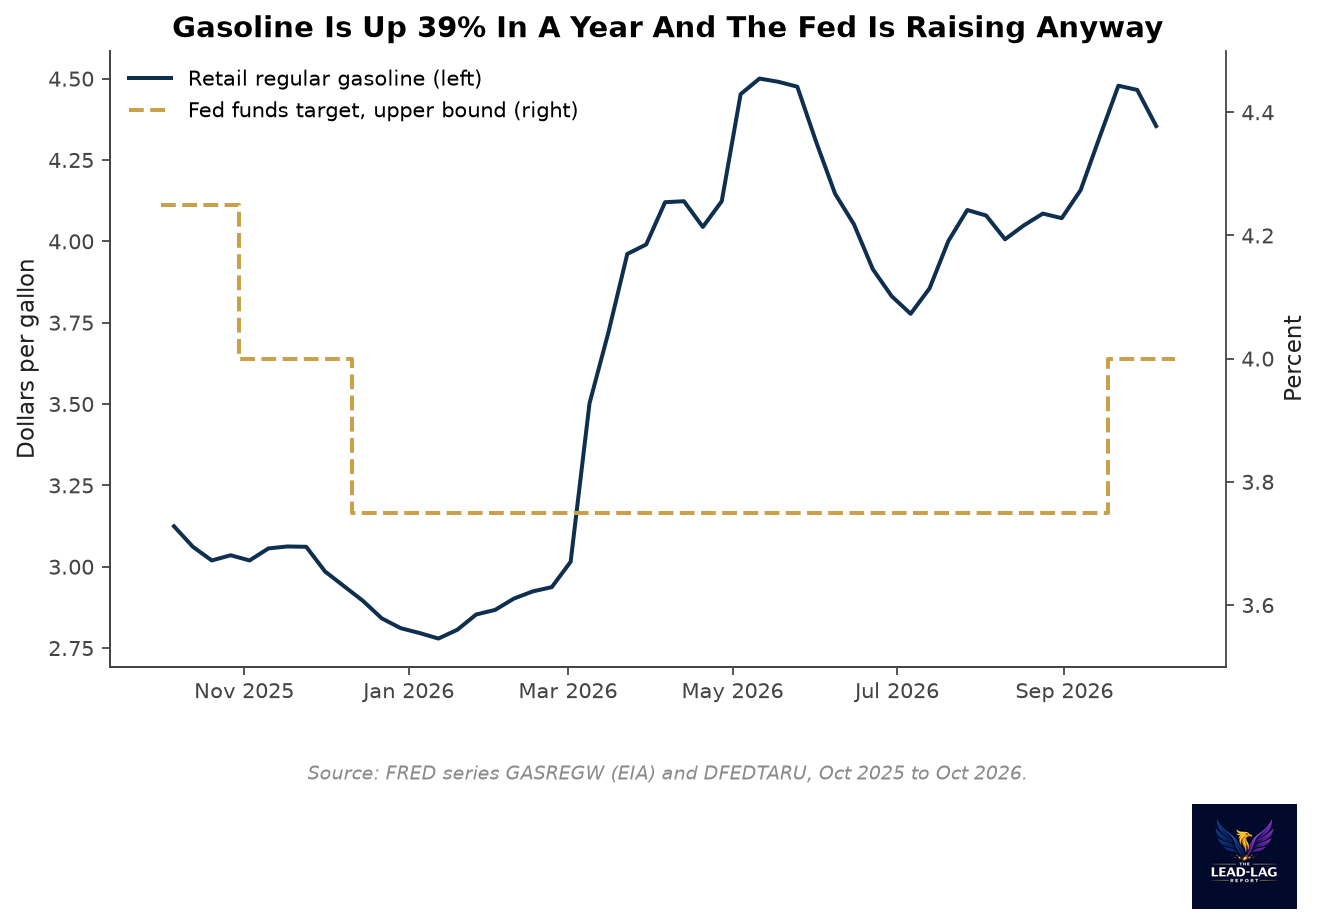
Notice the shape of the chart above. The Fed spent most of the year at an upper bound of 3.75% while gasoline rose from $2.78 to $4.50. It moved to 4.00% only on September 16, after the energy shock was well established.[5] That sequencing matters. The central bank did not hike into the first leg of the oil move. It waited, watched the inflation numbers absorb it, and then acted. Whether that is vigilance or a delayed reaction depends on what you believe about the next section.
What The Fed Is Actually Saying
The minutes of the September meeting are explicit. According to the summary in a StockTitan analysis of the coming CPI release, the minutes stated that “most participants assessed that another increase in the target range for the federal funds rate would likely be appropriate by year end,” and that the longer energy prices stayed elevated, the greater the risk that cost increases in some sectors could lead to broader price pressures.[6] That second clause is the heart of the Fed's logic. A supply shock is normally something a central bank looks through, because the effect on prices is temporary if wages and expectations stay anchored. The risk the committee is flagging is that the shock does not stay in energy. It leaks into freight, airfares, food, and eventually into what workers ask for.
This is a defensible position, and it has a precedent in the Fed's own recent behavior. The committee has raised rates once and signaled it is inclined to do so again. The market is split on the timing. Fed funds futures put the odds of an October hike at 20% to 25% on October 8, and the probability of a hold on October 27 and 28 rose to 82.8% after the jobs report.[7][8] The September CPI report, due Wednesday, October 14, has a headline forecast of 3.6% year over year, driven in part by gasoline.[6][9]
So the Fed is on record about its worry and the market is on record about its doubt. Both can be right. The Fed can be concerned that energy is leaking into broader prices, and the market can be skeptical that another hike is needed to deal with it. The data that breaks the tie is not the CPI. It is the labor market, and the labor market is softer than the Fed's worry would imply.
The Labor Market Says Slow Down
Nonfarm payrolls rose by 29,000 in September, well below the 84,000 consensus forecast, and July and August were revised down by a combined 60,000 jobs.[10][8] July is now a loss of 10,000. The unemployment rate rose to 4.2%, though the increase came largely from more people entering the labor force rather than layoffs. Average hourly earnings rose 3.0% over twelve months, the lowest since May 2021.[8][10]
Put those two facts together and the squeeze is visible. If September CPI comes in near the 3.6% forecast, workers earning 3.0% more are losing purchasing power at an annual rate of roughly half a percentage point. Real wage growth is turning negative at the exact moment the central bank is trying to prevent a wage-price spiral. A wage-price spiral requires wages to chase prices. The wage data show wages falling behind them.
That is the central tension for the Fed. The inflation it is worried about is real, but it is concentrated in a component that the labor market is not feeding. A rate increase that slows hiring further from a 29,000 pace is cutting into an economy that is already adding jobs at a rate well below what it was doing in the spring. The cure is aimed at a disease that is spreading mostly through a pipeline, not through payrolls.
What The Bond Market And Equities Heard
The 10-year Treasury yield closed at 5.22% on October 8, after reaching a 2026 closing high of 5.31% on October 5. A year ago it was 4.13%, and the 2026 low was 3.97% on February 27.[11] Yields have risen about 125 basis points since the late-winter low, which means the long end has not accepted the argument that the supply shock will fade without a response. It is demanding compensation for the possibility that it does not. In the same period the 10-year real yield rose from 1.72% to 2.87%, which says the move is not just inflation compensation. It is a higher price for money after inflation.[12]
Equities saw the same news and drew a different conclusion. The S&P 500 ETF is up 14.2% year to date through October 9, and the Nasdaq-100 ETF is up 22.3%. The energy sector ETF, XLE, is up 45.6%, more than three times the S&P 500 gain.[13] Investors have not treated higher oil as a threat to the earnings of the broad market. They have treated it as a transfer: from consumers to producers, from sectors that use energy to sectors that sell it. That is a coherent reading of a supply shock.
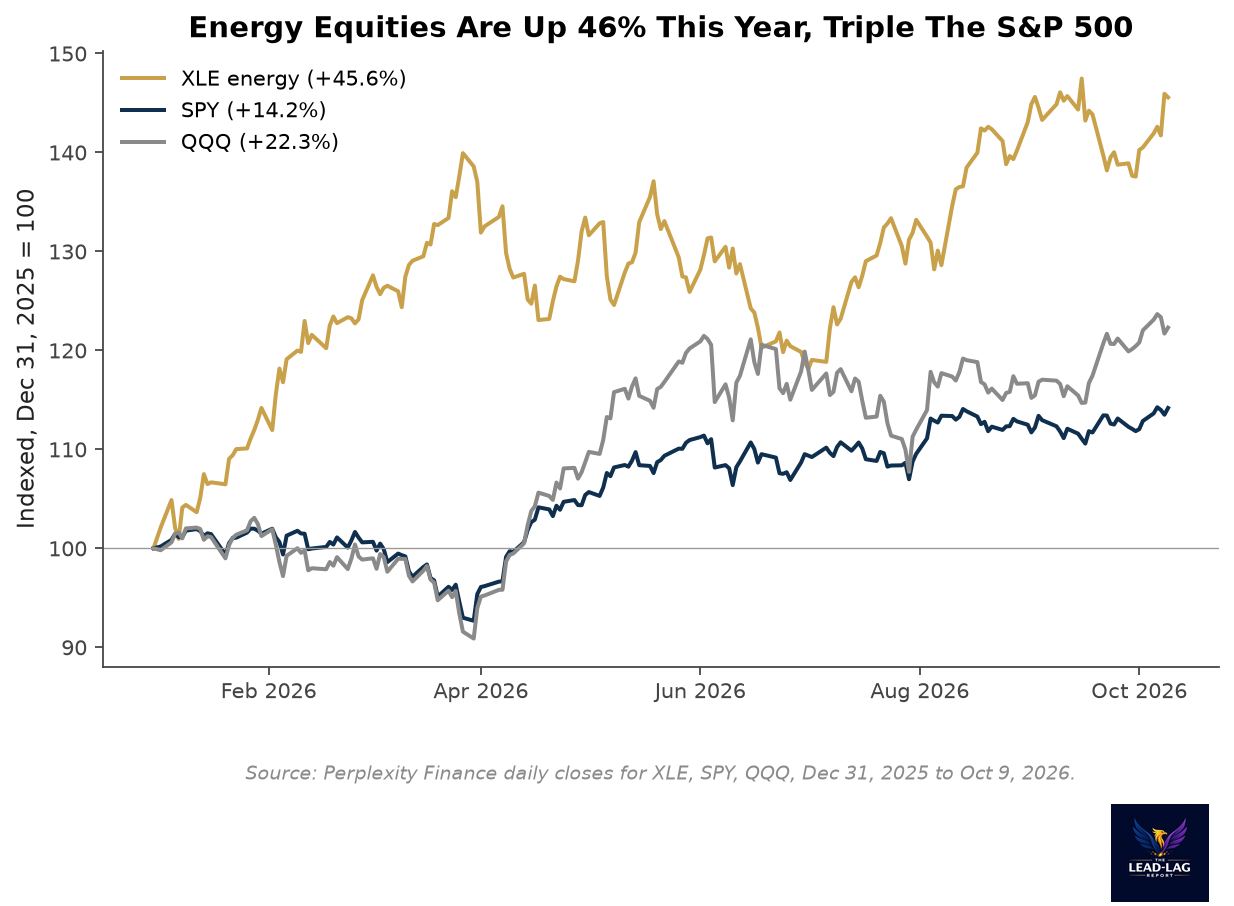
The equity reading has a limit, and the limit is the bond market. A transfer from consumers to energy producers is neutral for the index only as long as consumers keep spending. If a 39% increase in the price of gasoline is eating into discretionary budgets while wages grow at 3.0%, the transfer has a cost on the other side. That cost shows up first in the parts of the market that depend on household spending and on cheap financing, not in the index weighted by companies that do neither.
Three Ways This Resolves
The first resolution is that oil fades. The Strait reopens, tanker traffic normalizes, crude drifts back toward the $70s, and the Fed is left with a hike it did not strictly need. In that world the labor market recovers from its September stall, gasoline falls, and the bond market retraces some of its rise. This is the benign outcome, and it is the one that the October 9 headlines hinted at when WTI fell on reports that no strike on Iran was planned.[14] It is also an outcome that depends on geopolitics, not economics, and that is a thin foundation for a forecast.
The second resolution is that oil stays elevated and the energy shock leaks. The committee's worry is realized: freight, food, and services costs absorb the fuel bill, headline inflation holds above 3%, and the Fed hikes again in December, as markets currently expect. In that world, the 10-year yield has room to stay above 5%, and the economy pays for the energy shock twice, once at the pump and once through the cost of capital.
The third resolution is the one the labor data hints at: oil stays high, the Fed hikes, and demand breaks first. Payroll growth, already at 29,000, turns negative. Unemployment rises meaningfully. The central bank is then in the uncomfortable position of having tightened into a supply-driven slowdown. This is the stagflation outcome, and it is the one that makes an October or December hike look worst in hindsight. It is not the base case, but it has more support in the data than it did a month ago.
What separates the three outcomes is not a number the Fed controls. It is the duration of the disruption in the Strait of Hormuz. That is the variable the market is being asked to price, and it is the variable that the central bank has the least ability to influence.
What To Watch
The immediate marker is the CPI report on October 14. A headline reading near 3.6% with a calm core would support the view that the shock has not leaked. A hot core would support the committee's worry and push December hike odds higher. The labor report for October, the next FOMC meeting on October 27 and 28, and the physical flow of crude through the Strait will each add evidence.
For portfolios, the signal to watch is not the oil price itself but the relationship between energy and everything else. When the energy sector outperforms the market by more than 30 percentage points in a year, the market is saying that the shock is persistent. When that gap closes without a fall in the 10-year yield, the market is saying that growth is the problem, not inflation. The distinction decides which sectors lead from here.
The Fed is doing what a central bank does when prices rise: it is raising the cost of money. The more interesting question is whether higher rates can do anything about a price that is set at the mouth of a contested strait. If they cannot, the policy is a bet on demand destruction. The jobs report suggests that bet is already being placed.
Few understand this.
— — —
Notes
- Fed target range raised to 3.75% to 4.00% on September 16, 2026: Federal Reserve FOMC statement.
- WTI spot price: low $56.01 on January 7, high $114.58 on April 7, $96.24 on October 6, $62.49 one year earlier: FRED series DCOILWTICO (EIA).
- WTI settlement $91.67, Brent $104.53 on October 9; Strait of Hormuz exports about 8.5 million barrels a day, roughly 40% below normal, per Kpler; Middle East exports about 15.3 million barrels a day; IRGC claim of LPG tanker attack; unconfirmed mine reports: TradingKey, October 12, 2026.
- Retail regular gasoline $4.354 (week of October 5), $3.118 a year earlier, low $2.779 (January 12), high $4.50 (May 11): FRED series GASREGW (EIA).
- Fed funds target upper bound, daily: FRED series DFEDTARU.
- September minutes quotation and September CPI forecast of 0.6% monthly and 3.6% annual (Bloomberg and Reuters consensus): StockTitan, October 12, 2026.
- Fed funds futures odds of an October hike of 20% to 25% on October 8: Admiral Markets, October 12, 2026.
- September payrolls +29,000 vs 84,000 forecast, unemployment 4.2%, wage growth 3.0% (lowest since May 2021), CME FedWatch hold odds of 82.8% for October 27 to 28: CNBC, October 2, 2026.
- September CPI release scheduled for October 14, 2026, 8:30 a.m. ET: Bureau of Labor Statistics.
- Employment Situation, September 2026, revisions of negative 31,000 (July) and negative 29,000 (August), average hourly earnings $37.81: Bureau of Labor Statistics.
- 10-year Treasury constant maturity yield: 5.22% on October 8, 2026 high 5.31% on October 5, 3.97% on February 27, 4.13% a year earlier: FRED series DGS10.
- 10-year TIPS real yield, 2.87% on October 8, 1.72% on February 27: FRED series DFII10.
- XLE, SPY and QQQ daily closes, year-to-date through October 9, 2026 (XLE +45.6%, SPY +14.2%, QQQ +22.3%): Perplexity Finance.
- WTI falls on Trump ruling out an Iran strike, October 9: Rio Times.