BlackRock's Troubled BDC Pays 17%. The Loan Sale Is The Tell
A valuation probe, three dividend cuts, and now a $523 million portfolio sale at 95% of marks. The stress test is live.

Today’s Lead-Lag Report post is sponsored by TappAlpha

Income while staying fully invested in equities.
TappAlpha S&P 500 Growth & Daily Income ETF (TSPY)
TappAlpha Innovation 100 Growth & Daily Income ETF (TDAQ)
Investors have always had to choose: generate income or stay fully invested. TSPY and TDAQ do both—adding tax-efficient income potential to the S&P 500 and Nasdaq-100.
A tax-efficient alternative to traditional income strategies. Growth + Income — with the TappAlpha Growth & Daily Income ETFs.
Disclosures:
Investors should carefully consider the investment objectives, risks, charges and expenses of the ETFs identified on this site. This and other important information about the Fund are contained in the prospectus, which can be obtained by visiting tappalphafunds.com or by calling (844) 403-2888. The prospectus should be read carefully before investing.
ETFs are subject to additional risks that do not apply to conventional mutual funds, including the risks that the market price of an ETF’s shares may trade at a premium or discount to its net asset value, an active secondary trading market may not develop or be maintained, or trading may be halted by the exchange in which they trade, which may impact a Fund’s ability to sell its shares. Shares of any ETF are bought and sold at market price (not NAV) and are not individually redeemed from the Fund. Brokerage commissions will reduce returns.
The Fund invests in options contracts that are based on the value of the Index, including SPX and XSP options for TSPY and XND and NQX options for TDAQ. This subjects the Fund to certain of the same risks as if it owned shares of companies that comprised the Index, even though it does not own shares of companies in the Index. The Fund will have exposure to declines in the Index. The Fund is subject to potential losses if the Index loses value, which may not be offset by income received by the Fund. To the extent that the Fund invests in other ETFs or investment companies, the value of an investment in the Fund is based on the performance of the underlying funds in which the Fund invests and the allocation of its assets among those ETFs or investment companies. The Fund may incur high portfolio turnover to manage the Fund’s investment exposure. The Fund is classified as “non-diversified” under the 1940 Act.
As of the date of this prospectus, the Fund has no operating history and currently has fewer assets than larger funds. Like other new funds, large inflows and outflows may impact the Fund’s market exposure for limited periods of time. This impact may be positive or negative, depending on the direction of market movement during the period affected.
Due to the short time until their expiration, 0DTE options are more sensitive to sudden price movements and market volatility than options with more time until expiration. Because of this, the timing of trades utilizing 0DTE options becomes more critical. Even a slight delay in the execution of 0DTE trades can significantly impact the outcome of the trade. 0DTE options may also suffer from low liquidity, making it more difficult for the Fund to enter into its positions each morning at desired prices. The bid-ask spreads on 0DTE options can be wider than with traditional options, increasing the Fund’s transaction costs and negatively affecting its returns. These risks may negatively impact the performance of the fund.
Distributor: Foreside Fund Services, LLC
DISCLAIMER – PLEASE READ: This is sponsored advertising content for which Lead-Lag Publishing, LLC has been paid a fee. The information provided in the link is solely the creation of TappAlpha. Lead-Lag Publishing, LLC does not guarantee the accuracy or completeness of the information provided in the link or make any representation as to its quality. All statements and expressions provided in the link are the sole opinion of TappAlpha, and Lead-Lag Publishing, LLC expressly disclaims any responsibility for action taken in connection with the information provided in the link.
HIGH YIELD SPOTLIGHT
BlackRock's Troubled BDC Pays 17%. The Loan Sale Is The Tell
A valuation probe, three dividend cuts, and now a $523 million portfolio sale at 95% of marks. The stress test is live.
MICHAEL A. GAYED, CFA
Key Highlights
- Yield: 17.1% on price from the $0.17 quarterly distribution ($0.68 annualized), per StockAnalysis
- Discount: NAV $6.58 on June 30 versus a $3.98 share price, roughly a 40% discount, per the Q2 2026 results and Yahoo Finance
- Coverage: Q2 GAAP net investment income of $0.22 per share against the $0.17 dividend, a 129% coverage ratio, per the release
- Portfolio: $1.4 billion across 139 companies, 91.8% senior secured debt, non-accruals at 1.6% of fair value, down from 4.0% two quarters ago
- Catalyst: Definitive agreement to sell $523 million of investments, about 48% of the debt portfolio, into a continuation vehicle at 95% of year-end fair value
Every week, we'll profile a high yield investment fund that typically offers an annualized distribution of 6-10% or more. With the S&P 500 yielding less than 2%, many investors find it difficult to achieve the portfolio income necessary to meet their needs and goals. This report is designed to help address those concerns.
The BDC BlackRock Is Rebuilding In Public
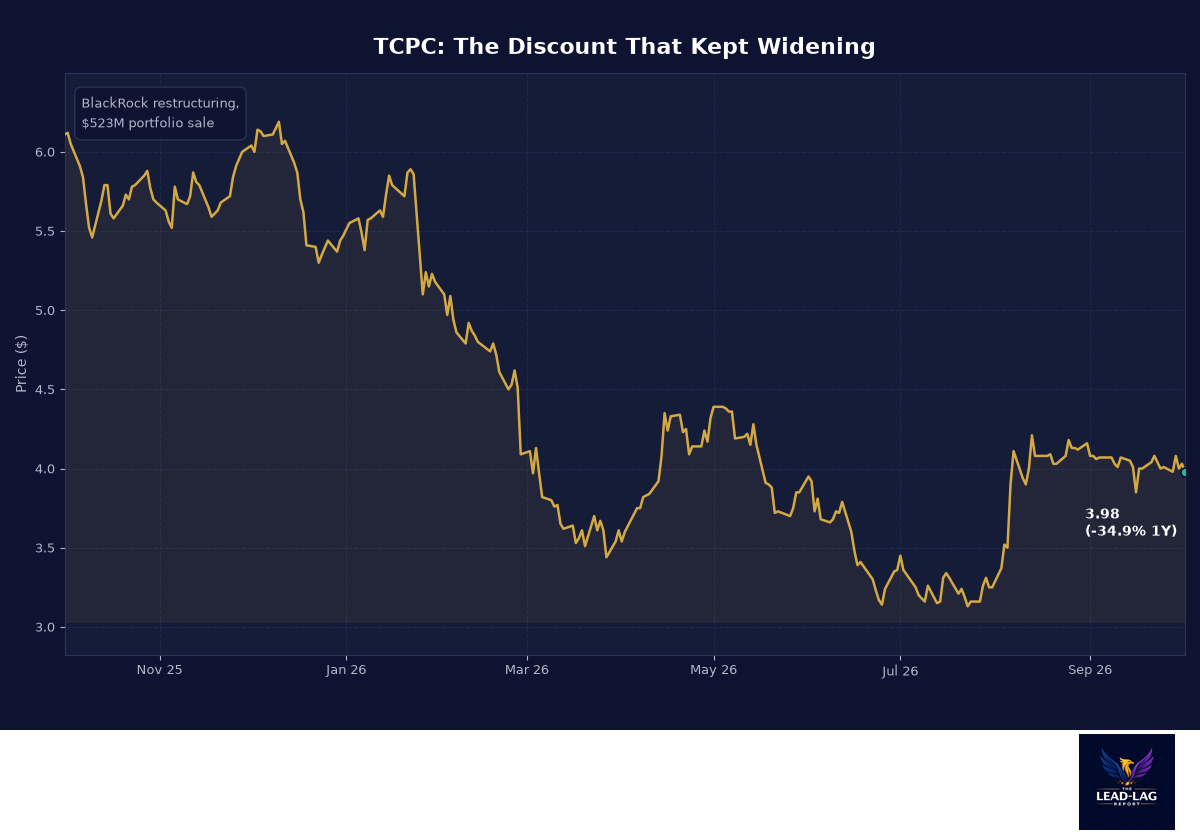
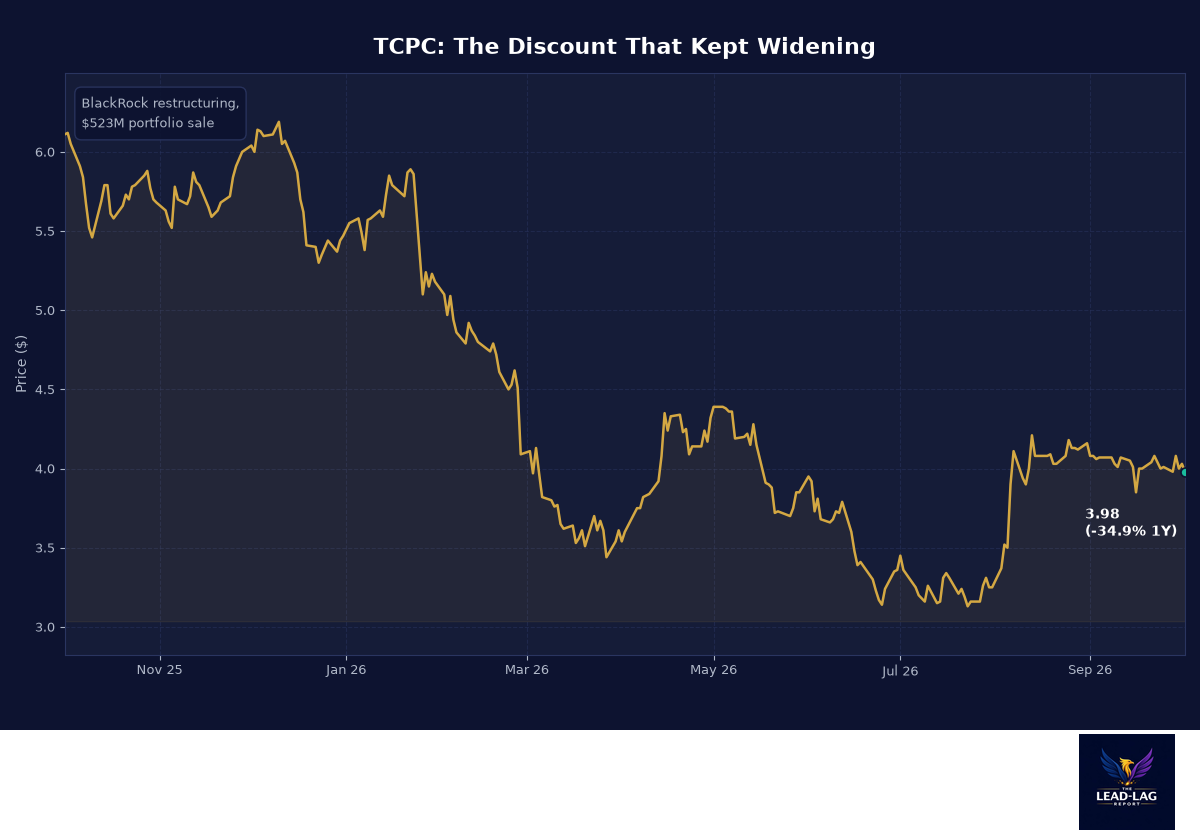
Sometimes a fund's story is written before you even open the filings. BlackRock TCP Capital Corp. (TCPC) spent the past year with headlines like a private credit fund in distress: a CEO departure during a valuation probe, a parent company shopping $671 million of its loans, and a NAV that fell from $8.71 last September to $6.58 by mid-year, a 24% decline, per the company's quarterly releases. The share price fell further, from $6.11 to $3.98 over the past year per Yahoo Finance, which is how you get a 17% yield on a portfolio that is 91.8% senior secured loans.
Here is the part that should make income investors look twice rather than look away. In the June quarter, TCPC earned $0.22 per share of GAAP net investment income against a $0.17 dividend, per the Q2 2026 release. Non-accruals dropped to 1.6% of the portfolio at fair value, from 4.0% at year-end. And BlackRock signed a definitive agreement to move roughly half the debt portfolio into a continuation vehicle at 95% of December 31 marks, which is as close to a market-clearing price test on BDC valuations as public shareholders ever get. The discount says crisis. The operating data says restructuring that is starting to work.
My view: this is a turnaround with real catalysts, not a melting ice cube, but the discount exists for reasons that will not fully resolve this year. It belongs in the aggressive sleeve of an income allocation, sized so that a further NAV reset would not sink the position.
Fund Background
TCPC is an externally managed BDC, run since 2025 under the BlackRock umbrella after BlackRock acquired TCP Capital's adviser. Per the Q2 2026 release, the portfolio held approximately $1.4 billion across 139 companies as of March 31, overwhelmingly in directly originated senior secured loans to upper-middle-market companies. Net regulatory leverage was 1.29x at the end of Q1, conservative for the sector, and available liquidity was roughly $358.6 million.
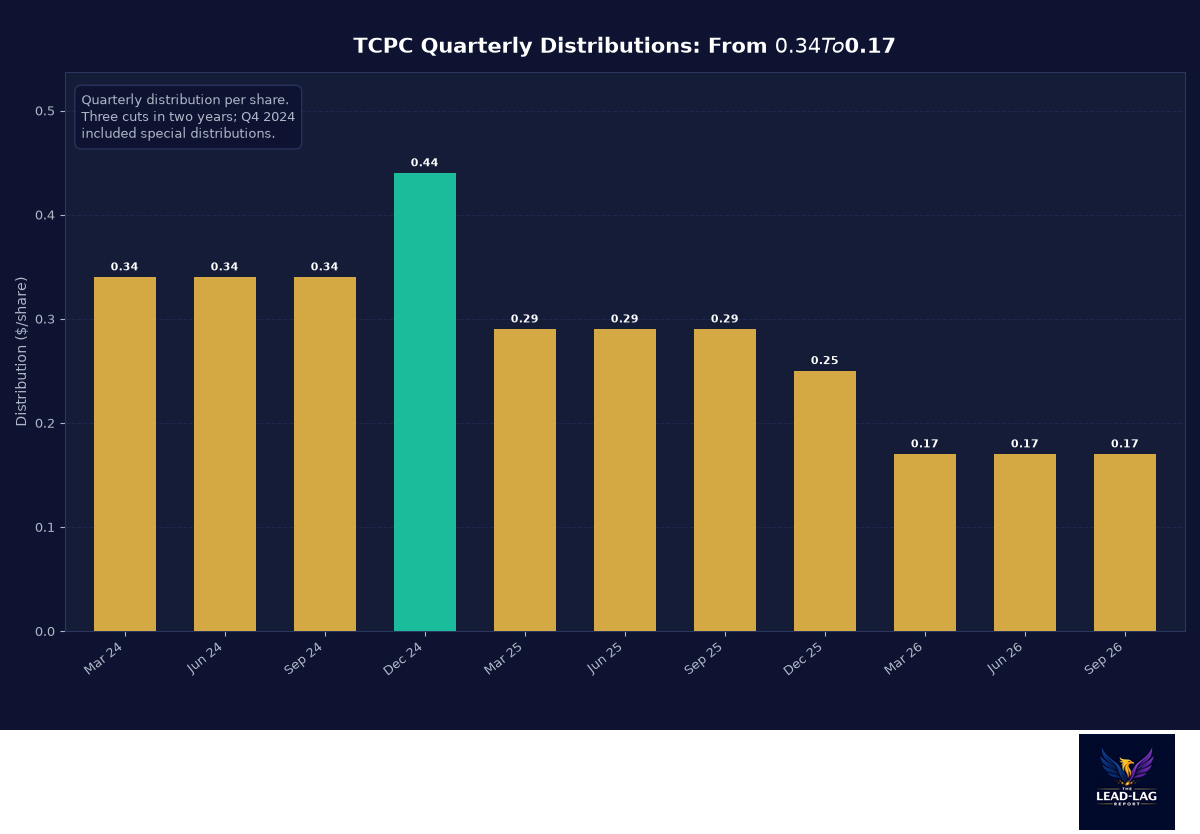
The quarterly dividend is $0.17 per share. Three years ago it was $0.34, and the path down, $0.34 to $0.29 to $0.25 to $0.17, per StockAnalysis, is the cleanest single chart of what happened to this fund: a legacy portfolio of underperforming middle-market loans repriced lower, and management cut the payout to match reality. The cuts are the reason the dividend is now covered with a 129% cushion rather than suspended.
What The Loan Sale Actually Tells You
The single most important disclosure of the year is the continuation vehicle sale. BlackRock agreed to sell 95% of the equity in a vehicle holding about $523 million of investments, roughly 48% of the debt portfolio, at a base purchase price of 95% of December 31, 2025 fair value per the release. Read that carefully. A third party is paying 95 cents on the marked dollar for half the book. BDC marks are the constant accusation in this sector, and this transaction is a live, contractual stress test of them. If it closes near par to the marks, a large chunk of the 40% discount loses its foundation.
The credit trends corroborate the direction. Non-accruals went from 4.0% of fair value in Q4 2025 to 2.8% in Q1 to 1.6% in Q2 per the quarterly releases, and a portfolio company paydown was referenced in the Q2 report. The remaining book stays true to the senior secured mandate, which means recovery values in a downside scenario, not equity crumbs.
Performance And The Restructuring Timeline
The quarterly NAV sequence is the cleanest way to see the arc: $8.71 last September, $7.07 at year-end, $6.72 in March, $6.58 in June per the quarterly releases. The collapse was front-loaded into the Q4 2025 reset, when the valuation probe and the loan marks hit together, and the declines have shrunk each quarter since, from negative 19% to negative 2.7% to negative 2.1%. The share price, down 34.9% over the year per Yahoo Finance, is still pricing the Q4 shock rather than the two quarters of deceleration that followed it.
The forward calendar matters more than the trailing numbers. The continuation vehicle sale is the near-term event: closing it converts roughly half the book to cash at a price that validates the marks, and the redeployment of those proceeds sets the earnings base for the next two years. Watch two disclosures above all: the final sale price versus the 95% of marks baseline, and net investment income per share once the smaller portfolio settles. If the fund earns anywhere near $0.20 quarterly on the slimmed-down book, the 17% yield is earned income. If it prints $0.10, the cut cycle is not over. This is a fund where the next two earnings releases are worth more than any chart of the last two years.
The Distribution: Small, Covered, And Perhaps A Floor
The $0.17 quarterly payout annualizes to $0.68, a 17.1% yield at $3.98 per StockAnalysis. GAAP net investment income has exceeded the dividend two quarters running, $0.22 in each of Q1 and Q2 per the releases, with adjusted NII of $0.21 in Q2. Full-year 2025 adjusted NII was $1.22 per share on a portfolio that has since shrunk, so model the earnings power conservatively, but on current run-rate the payout is money earned, not money returned.
The risk to the payout is not coverage, it is the NAV trajectory. Book value fell from $7.07 at year-end to $6.58 by June 30. If the loan sale proceeds get redeployed poorly or the remaining book takes another markdown quarter, the cushion thins fast. This is a fund where you clip a covered 17% while explicitly accepting that the principal can erode.
Advantages
The loan sale is a genuine valuation catalyst, not a hope. A binding agreement at 95% of marks on half the portfolio gives shareholders something almost no other deeply discounted BDC has: third-party evidence about the accuracy of the NAV they are buying at a 40% discount to. When the transaction is the reason the stock is cheap, the transaction closing is the reason it stops being cheap.
The dividend is covered with improving credit behind it. Falling non-accruals three quarters in a row, a 1.29x leverage ratio with room to add risk, and $358.6 million of liquidity per the Q1 release make the 17% yield one of the few in the space backed by current earnings rather than return of capital.
BlackRock's alignment is now visible. The parent absorbed the adviser, replaced leadership, and is actively restructuring the book. Whatever you think of the firm, it does not leave $1.4 billion of senior secured assets to rot when its brand is attached to the cleanup.
Disadvantages
The NAV has fallen 24% in nine months, and one good quarter does not reverse a trend. The Q2 rebound in coverage came alongside a smaller portfolio. If the continuation vehicle closes and the proceeds sit in low-yielding cash while the pipeline rebuilds, net investment income drops and today's 129% coverage becomes tomorrow's 100%.
The governance record is genuinely ugly. A CEO departure during a valuation probe, mounting losses, and loan sales reported in the press before they were reported to shareholders are not the marks of a smoothly run credit shop. BlackRock's involvement mitigates this, but mitigation is not erasure, and external management fees still scale with assets rather than outcomes.
Deep-discount BDCs can stay cheap indefinitely. The market waited years to reprice Ares and Main Street correctly. A 40% discount is not an arbitrage, it is a judgment that the marks are optimistic, and the only closing mechanism here is the loan sale plus several more clean quarters.
How It Fits In An Income Portfolio
TCPC is a position, not an allocation. The covered 17% yield and the hard catalyst make it one of the more interesting asymmetries in the BDC space right now, but the governance history and the NAV trajectory mean it belongs in the aggressive sleeve, sized so that a further markdown quarter is an annoyance rather than a problem. For advisors running client money, the honest framing is that this is a turnaround with a scoreboard: the loan sale closing price and the next two quarterly NAV prints will tell you whether the trade is working, and the position should be reviewed at each of those checkpoints rather than held on faith.
Set against the sector's benchmarks, the role clarifies. Ares Capital, covered in this column recently, is the core BDC holding, premium-priced for scale and consistency. Blackstone Secured Lending, also covered, is the quality discount trade. TCPC is the distressed turnaround, the fund where you are paid a covered high yield to wait for a re-rating that depends on execution rather than on market beta. The three together form a coherent ladder of risk within private credit; TCPC alone is a bet, TCPC within the ladder is a diversification of return drivers.
The calendar matters more than the chart. The continuation vehicle sale is the near-term event, and its closing near the 95%-of-marks baseline is the single most important data point between now and year-end. After that, the redeployment of proceeds sets the earnings base, and the quarterly sequence, $8.71 to $7.07 to $6.72 to $6.58 per the releases, needs to keep decelerating. Non-accruals at 1.6% and falling are the early evidence. The distribution is already covered by current earnings; the NAV trajectory is the scoreboard that matters, and it is the number to watch from here.
Managing the position through the catalyst deserves its own paragraph. If the continuation vehicle closes at or above the 95%-of-marks baseline, the market's markdown thesis loses its sharpest argument, and the sensible move is to hold through the redeployment phase and let the earnings base rebuild. If it closes materially below that number, the marks were indeed generous, the NAV takes another step down, and the position deserves an honest reassessment rather than a rationalization. The dividend itself gives the timeline: a covered $0.17 quarterly buys roughly two years of patience at current earnings, which is the window in which the story has to prove itself. After that, the cut history says management will reset the payout again rather than fund it with capital, and the second cut is the signal to be gone before it arrives.
Conclusion
TCPC is the most asymmetric income story I have profiled this month: a covered 17% yield, improving credit, a hard catalyst that prices the assets, and a discount that assumes the worst. It is also a fund that just cut its way to honesty and is being rebuilt in public view, which means volatility is the admission price. Short-term, the covered payout and the loan sale closing argue for the bulls. Long-term, this becomes a core holding only if BlackRock restores the origination engine and the NAV stabilizes for several consecutive quarters. For investors who can size it as a position, not a portfolio, I think the market is overpaying for skepticism here.
The Lead-Lag Report is provided by Lead-Lag Publishing, LLC. All opinions and views mentioned in this report constitute our judgments as of the date of writing and are subject to change at any time. Information within this material is not intended to be used as a primary basis for investment decisions and should also not be construed as advice meeting the particular investment needs of any individual investor. Trading signals produced by the Lead-Lag Report are independent of other services provided by Lead-Lag Publishing, LLC or its affiliates, and positioning of accounts under their management may differ. Please remember that investing involves risk, including loss of principal, and past performance may not be indicative of future results. Lead-Lag Publishing, LLC, its members, officers, directors and employees expressly disclaim all liability in respect to actions taken based on any or all of the information on this writing.