A 17.6% NAV Return, A 13.7% Distribution Raise, A 10% Discount: The EM Fund Nobody Watched
Frontier sovereigns quietly posted one of the best income years anywhere while the share price went nowhere.

Today’s Lead-Lag Report post is sponsored by TappAlpha

Income while staying fully invested in equities.
TappAlpha S&P 500 Growth & Daily Income ETF (TSPY)
TappAlpha Innovation 100 Growth & Daily Income ETF (TDAQ)
Investors have always had to choose: generate income or stay fully invested. TSPY and TDAQ do both—adding tax-efficient income potential to the S&P 500 and Nasdaq-100.
A tax-efficient alternative to traditional income strategies. Growth + Income — with the TappAlpha Growth & Daily Income ETFs.
Disclosures:
Investors should carefully consider the investment objectives, risks, charges and expenses of the ETFs identified on this site. This and other important information about the Fund are contained in the prospectus, which can be obtained by visiting tappalphafunds.com or by calling (844) 403-2888. The prospectus should be read carefully before investing.
ETFs are subject to additional risks that do not apply to conventional mutual funds, including the risks that the market price of an ETF’s shares may trade at a premium or discount to its net asset value, an active secondary trading market may not develop or be maintained, or trading may be halted by the exchange in which they trade, which may impact a Fund’s ability to sell its shares. Shares of any ETF are bought and sold at market price (not NAV) and are not individually redeemed from the Fund. Brokerage commissions will reduce returns.
The Fund invests in options contracts that are based on the value of the Index, including SPX and XSP options for TSPY and XND and NQX options for TDAQ. This subjects the Fund to certain of the same risks as if it owned shares of companies that comprised the Index, even though it does not own shares of companies in the Index. The Fund will have exposure to declines in the Index. The Fund is subject to potential losses if the Index loses value, which may not be offset by income received by the Fund. To the extent that the Fund invests in other ETFs or investment companies, the value of an investment in the Fund is based on the performance of the underlying funds in which the Fund invests and the allocation of its assets among those ETFs or investment companies. The Fund may incur high portfolio turnover to manage the Fund’s investment exposure. The Fund is classified as “non-diversified” under the 1940 Act.
As of the date of this prospectus, the Fund has no operating history and currently has fewer assets than larger funds. Like other new funds, large inflows and outflows may impact the Fund’s market exposure for limited periods of time. This impact may be positive or negative, depending on the direction of market movement during the period affected.
Due to the short time until their expiration, 0DTE options are more sensitive to sudden price movements and market volatility than options with more time until expiration. Because of this, the timing of trades utilizing 0DTE options becomes more critical. Even a slight delay in the execution of 0DTE trades can significantly impact the outcome of the trade. 0DTE options may also suffer from low liquidity, making it more difficult for the Fund to enter into its positions each morning at desired prices. The bid-ask spreads on 0DTE options can be wider than with traditional options, increasing the Fund’s transaction costs and negatively affecting its returns. These risks may negatively impact the performance of the fund.
Distributor: Foreside Fund Services, LLC
DISCLAIMER – PLEASE READ: This is sponsored advertising content for which Lead-Lag Publishing, LLC has been paid a fee. The information provided in the link is solely the creation of TappAlpha. Lead-Lag Publishing, LLC does not guarantee the accuracy or completeness of the information provided in the link or make any representation as to its quality. All statements and expressions provided in the link are the sole opinion of TappAlpha, and Lead-Lag Publishing, LLC expressly disclaims any responsibility for action taken in connection with the information provided in the link.
HIGH YIELD SPOTLIGHT
A 17.6% NAV Return, A 13.7% Distribution Raise, A 10% Discount: The EM Fund Nobody Watched
Frontier sovereigns quietly posted one of the best income years anywhere while the share price went nowhere.
MICHAEL A. GAYED, CFA
Key Highlights
- Yield: 10.66% on price, 9.56% annualized on NAV, from the $0.054 monthly distribution, per CEFConnect
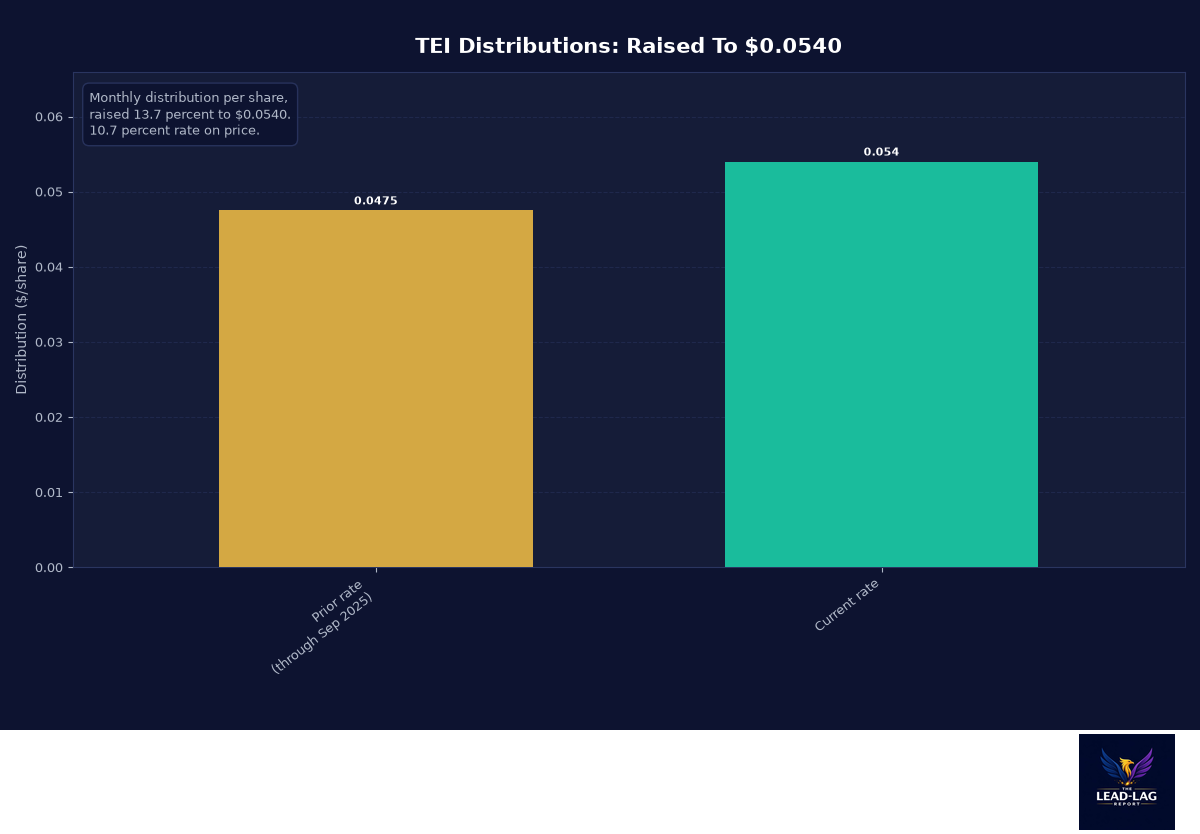
- Payout growth: Monthly distribution raised 13.7%, from $0.0475 to $0.0540, per StockAnalysis and CEFConnect
- Performance: 17.62% total return on NAV over the trailing twelve months, per CEFConnect, while the share price fell 2.4%
- Portfolio: 153 holdings, sovereign-heavy, Ecuador 6.31%, South Africa 5.53%, Rwanda 5.13%, Kenya 3.86%, Argentina 3.82% at the top, average coupon 8.10%
- Structure: 16.87% effective leverage, the lowest of the CEFs in this batch, total expense ratio 2.37% per CEFConnect
Every week, we'll profile a high yield investment fund that typically offers an annualized distribution of 6-10% or more. With the S&P 500 yielding less than 2%, many investors find it difficult to achieve the portfolio income necessary to meet their needs and goals. This report is designed to help address those concerns.
The Return Hiding In The Scariest Drawer
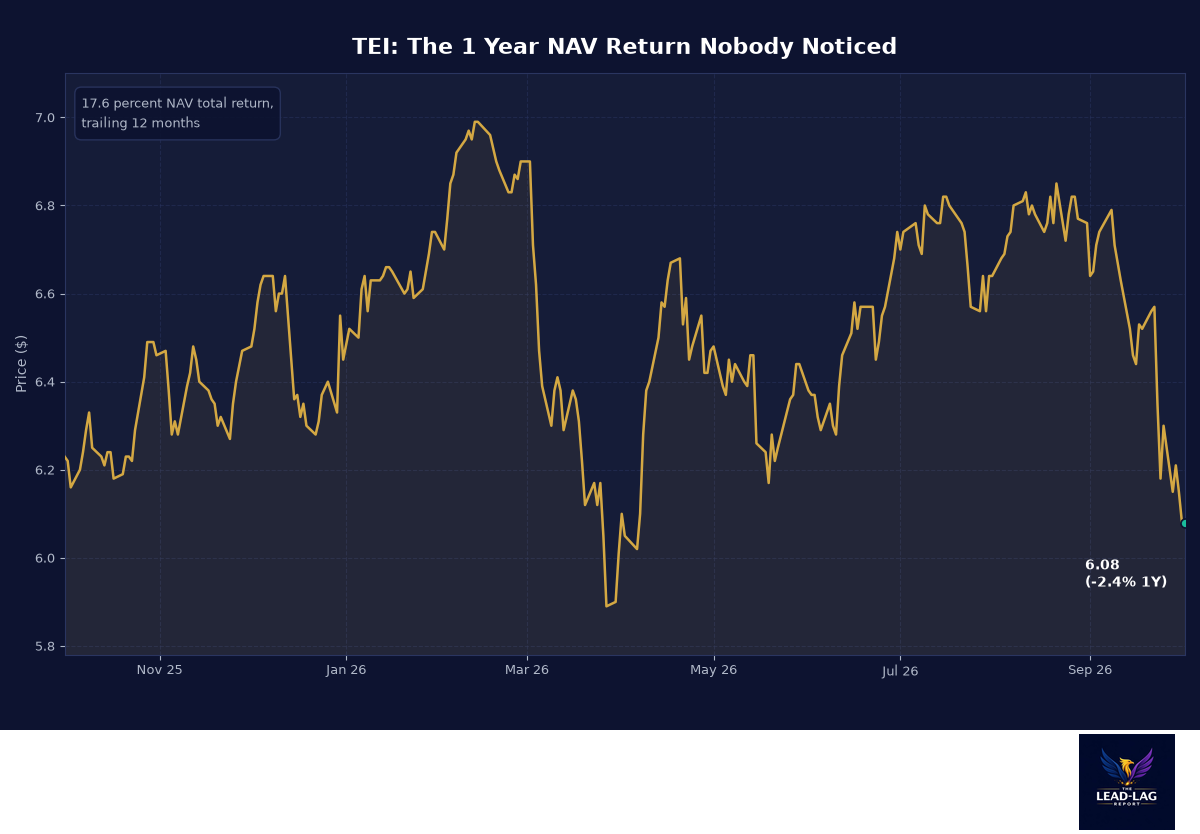
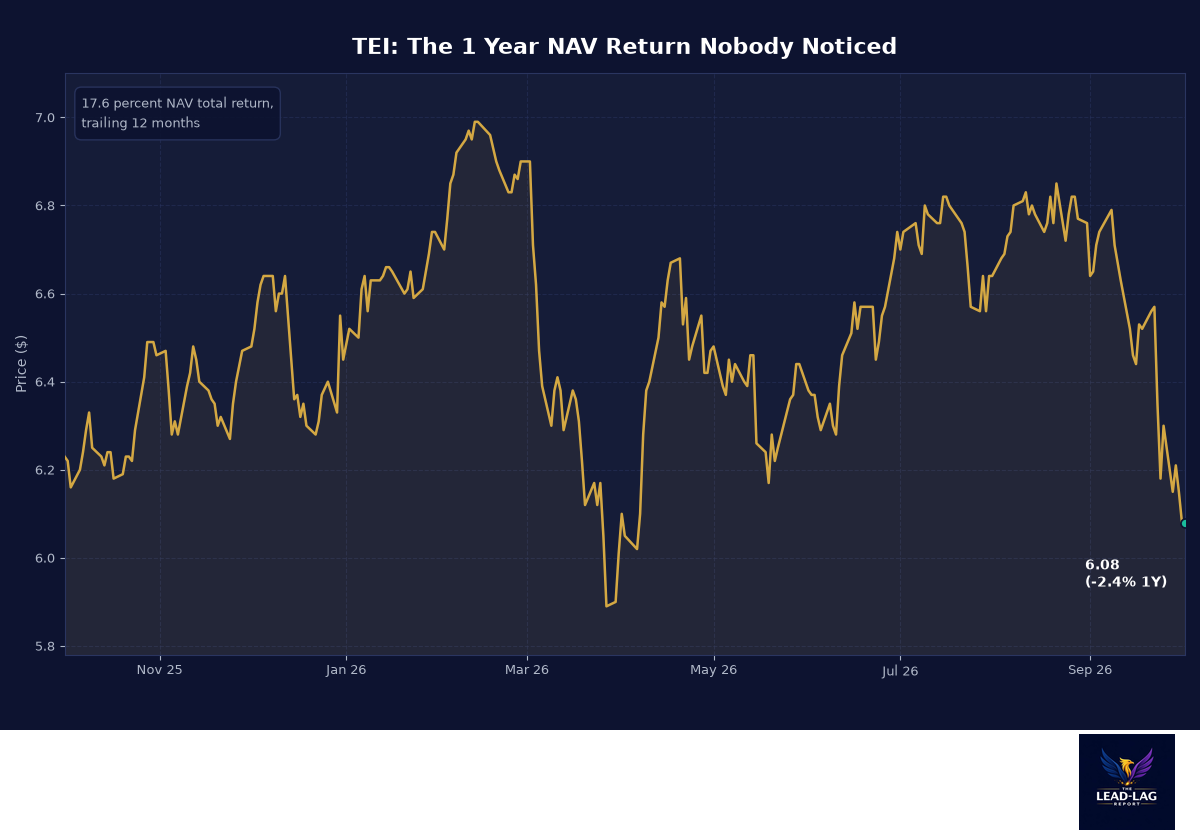
Emerging market debt was the asset class investors loved to abandon, and the abandonment is precisely the opportunity. Templeton Emerging Markets Income Fund (TEI) returned 17.62% on NAV over the trailing twelve months per CEFConnect, one of the best numbers in the entire closed-end universe this year, while its share price went nowhere, down 2.4%. That divergence between what the fund earned and what the market paid for it is the whole story: an asset class in recovery, a share price that refuses to notice, and a 10.66% distribution rate on top.
The fund itself is a piece of history. Launched September 23, 1993 per CEFConnect, it is among the oldest EM income vehicles anywhere, running a deliberately conservative version of the strategy: sovereign and sovereign-related bonds, an 8.10% average coupon, only 16.87% leverage, and a monthly distribution that was just raised 13.7% to $0.054. The top of the book reads like a risk committee's nightmare list, Ecuador, South Africa, Rwanda, Kenya, Argentina, and that is exactly why the yields are what they are. Frontier sovereigns are paying double digits because the last decade burned their investors. The question is whether the burn is over.
My view: TEI is the most interesting risk-reward in this month's batch. The NAV performance is real and verified, the discount is real, and the distribution raise is the kind of signal income investors should weight heavily. The risks are equally real and I will not soften them. This is a fund for the part of the portfolio that is allowed to be uncomfortable.
Fund Background
TEI is managed by Franklin Templeton's fixed income group, the same franchise that pioneered emerging market debt investing for retail investors under Michael Hasenstab's era and now runs a more team-based book. The objective is high current income with a secondary goal of capital appreciation, investing at least 80% of net assets in income-producing securities of sovereign or sovereign-related entities and private companies in emerging markets per CEFConnect. Total common assets are roughly $320 million, and total investment exposure $385 million on 16.87% effective leverage, the lightest debt load of any CEF I have profiled this month.
The distribution is $0.054 monthly, income-only in classification, per CEFConnect. Average earnings per share were $0.3717 as of June 30 per CEFConnect, a level that on its face supports a payout of this size, and EM carry has been compounding while the fund's currency and rate hedges, the book runs a sizable swap overlay per the holdings table, absorbed the dollar's moves.
Sovereigns, Swaps, And The Coupon Machine
The portfolio holds 153 positions per CEFConnect as of August 31, and the sector table shows the strategy plainly: government and government-related instruments at over 109% of the (levered) portfolio, corporates at 4.18%, and a derivative overlay of interest rate swaps in Mexican pesos and Colombian pesos used to manage currency and rate exposure. The top holdings include Ecuador 6.9% at 6.31% of the fund, South Africa 8.75% at 5.53%, Rwanda 5.5% at 5.13%, Kenya 9.75% at 3.86%, and Argentina 4.125% at 3.82%, alongside US Treasury bills for liquidity.
An 8.10% average coupon is the number that makes the machine work. These are mostly dollar and local-currency sovereign bonds bought at yields well above their coupons during the drawdown years, which means the book carries both high current income and embedded price recovery if spreads normalize. The 17.62% NAV year is what that combination looks like when it starts working. The concentration at the frontier end, Ecuador, Rwanda, Kenya, Argentina, is the same list that would suffer first in a global risk-off episode, so treat the trailing return as evidence of upside, not as a forecast of repetition.
The Divergence That Defines The Trade
Run the trailing year through both lenses. On NAV, the fund returned 17.62% per CEFConnect, a number that would rank at the top of nearly any income category. On price, the shares fell 2.4%, from $6.23 to $6.08, per daily closes. Add in the distributions collected along the way and the shareholder experience was a roughly 7 to 8% total return, respectable but nowhere near what the assets did. The 19 to 20 point gap between NAV performance and price performance is the market discounting an EM vehicle because it is an EM vehicle, not because of anything in the fund's own numbers. That is the specific inefficiency this fund exists to exploit for patient holders.
The forward risk is concentrated in one variable: EM spreads. The book's 8.10% average coupon and its distressed-basis purchase prices protect the income stream against modest spread widening, and the 16.87% leverage is small enough that even a severe drawdown does not trigger the death spiral dynamics that hit more aggressively levered EM funds in past crises. What the structure cannot protect against is a coordinated frontier credit event, several top names restructure at once, which is the scenario to size for: treat a quarter of the book as genuinely at risk of impairment in a bad cycle, and the remaining three quarters as the coupon engine that makes the position worth holding.
A Raise, In This Market
The raise is the tell. The monthly distribution went from $0.0475, where it sat through late 2025 per StockAnalysis, to $0.0540 per CEFConnect, a 13.7% increase, arriving at a moment when most income funds in this column were cutting. Fund boards raise income-only distributions when the earnings base genuinely expands, and the average earnings figure of $0.3717 per share reported by CEFConnect supports a payout at this level without heroic assumptions.
The coverage math still deserves honesty: the $0.648 annualized distribution is large relative to the fund's earnings base, and sovereign books rely on realized gains as well as current income to sustain payouts of this size. If EM spreads widen materially, both the earnings and the capital gains leg weaken together. The 2.37% total expense ratio, including 1.17% of interest expense per CEFConnect, is mid-range for the category and takes a real bite out of that 10.66% headline.
Advantages
The performance evidence is unusually strong. A 17.62% NAV total return with a falling share price is the cleanest setup in this column's playbook: the assets are doing the work, the market has not repriced the vehicle, and the 10.32% discount per CEFConnect is the gap between the two. When discounts close on performance, they close fast.
The structure is conservative for the asset class. Frontier EM exposure with only 16.87% leverage is rare; most EM CEFs run 25% to 35%. The lighter leverage means a spread blowout dents NAV rather than breaking it, and the swap overlay shows active management of the currency risk that sinks naive EM funds.
The distribution raise signals management confidence with money behind it. Boards do not raise income-only payouts into a deteriorating book. Combined with the coupon structure, high single-digit sovereign yields bought at distressed levels, the income stream has both level and direction going for it.
Disadvantages
The sovereign risk is maximal and names are the point. Ecuador, Rwanda, Kenya, and Argentina have all defaulted or restructured within living memory, some within this decade. A single restructuring in a 5% position is a permanent loss of principal that no diversification among other frontier names truly offsets, because frontier credit events cluster.
The trailing 17.62% is a rear-view number. It came from spread compression and price recovery off depressed levels. Anyone buying today buys the recovery's continuation, not its occurrence, and EM spreads have already tightened materially from the wides. The honest forward assumption is the coupon and the discount, not a repeat of the NAV year.
The fund is small and its expenses are real. Roughly $320 million of common assets means liquidity is thinner than the daily volume suggests in stressed markets, and 2.37% of expenses against an asset class that can go nowhere for years is a headwind that compounds quietly against you.
How It Fits In An Income Portfolio
Emerging market debt earns its place in an income portfolio for one reason: the coupons are set by a different set of stresses than US credit. When US high yield is priced for perfection, frontier sovereigns are priced for memory, and the two rarely cheapen together. TEI's 8.10% average coupon was built during the drawdown years, which is precisely why the book could compound a 17.62% NAV year while dollar-denominated US credit did nothing dramatic. The diversification argument is not that EM is safe, it is that EM's bad days tend to have different causes than the bad days in everything else an income investor owns.
The sensitivity to understand before sizing is the dollar. Frontier sovereigns, especially the local-currency issuers in this book, weaken when the dollar strengthens and reprice favorably when it softens. The fund's swap overlay in Mexican and Colombian pesos, visible in the top holdings per CEFConnect, manages part of that exposure but cannot eliminate it. An income portfolio that is already dollar-heavy in its equity and credit sleeves is adding a correlated risk here, not a diversifying one, unless the position is sized to ride through a dollar rally.
Paired against the rest of this month's column, TEI is the payoff for accepting genuine, nameable credit risk: the 10.66% yield is not leverage alchemy or duration reach, it is what Ecuador, South Africa, Rwanda, Kenya, and Argentina actually pay to borrow. For the aggressive sleeve of an income allocation, with the 16.87% leverage and the 10.32% discount both on your side, this is the most honest risk-reward in the batch. It is also the one position where a single sovereign restructuring is a permanent loss. Own it in the size that makes that sentence tolerable.
What actually closes a discount like this one is worth naming, because it is not hope. EM income funds re-rate on inflows, and inflows follow performance with a lag: the 17.62% NAV year is exactly the kind of print that starts showing up in category flows two or three quarters later. The second trigger is spread compression itself, since a book bought at distressed yields gains NAV as frontier spreads normalize, and the fund's swaps and hedged positions convert much of that directly into distributable earnings. The third is structural, the sort of consolidation and fund actions that forced tighter discounts across the CEF complex in past cycles. None of these is scheduled, but all three are live, and the 10.32% discount is the market saying it will believe them when it sees them. Meanwhile the coupon pays you to wait.
Conclusion
TEI is the rare fund where the numbers do the arguing: a verified 17.6% NAV year, a fresh 13.7% distribution raise, low leverage, and a double-digit discount, all in the one asset class investors cannot bring themselves to touch. The risk is exactly what it appears to be, frontier sovereigns with real default histories, and it should be sized as such. Short-term, the divergence between NAV performance and share price is the kind of gap that closes. Long-term, this is a cyclical income trade on EM normalization, not a permanent endowment. For investors with the risk budget for it, this is my favorite asymmetry in the batch.
The Lead-Lag Report is provided by Lead-Lag Publishing, LLC. All opinions and views mentioned in this report constitute our judgments as of the date of writing and are subject to change at any time. Information within this material is not intended to be used as a primary basis for investment decisions and should also not be construed as advice meeting the particular investment needs of any individual investor. Trading signals produced by the Lead-Lag Report are independent of other services provided by Lead-Lag Publishing, LLC or its affiliates, and positioning of accounts under their management may differ. Please remember that investing involves risk, including loss of principal, and past performance may not be indicative of future results. Lead-Lag Publishing, LLC, its members, officers, directors and employees expressly disclaim all liability in respect to actions taken based on any or all of the information on this writing.