The quiet currency that decides global markets
Japan's history, the yen carry trade, and the difference between an attractive asset and a resilient investment position.

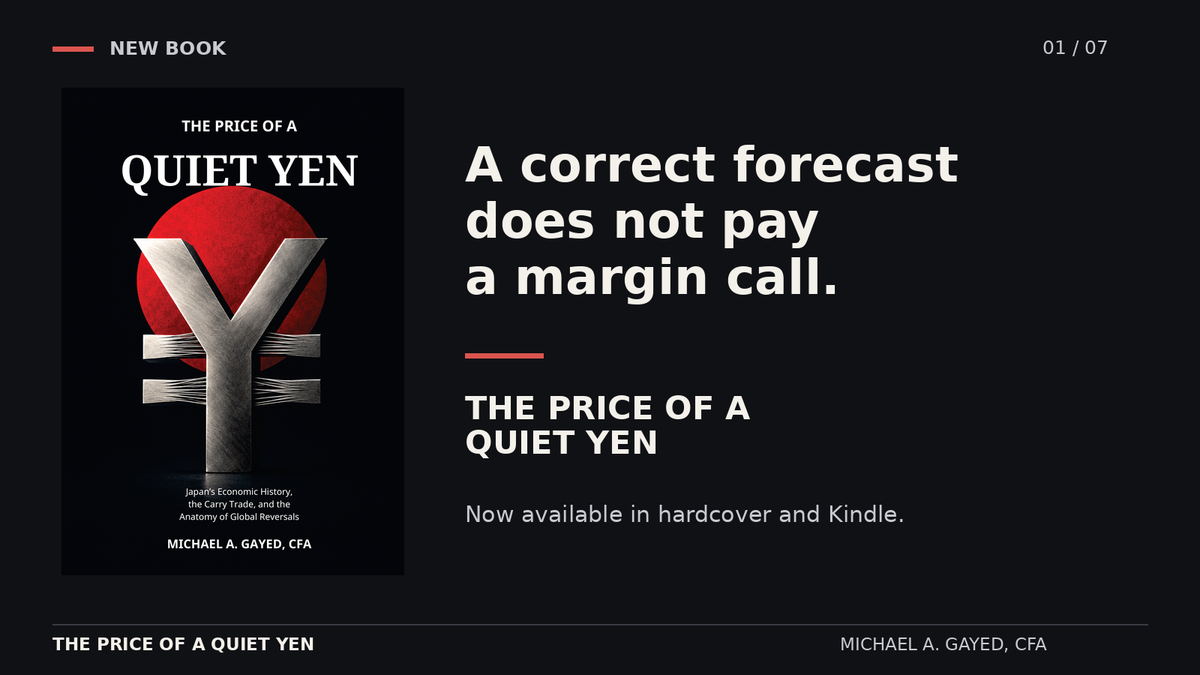
You can be right about an investment and still be forced to sell it at the wrong time. A correct forecast does not pay a margin call.
The Price of a Quiet Yen: Japan's Economic History, the Carry Trade, and the Anatomy of Global Reversals is now available in hardcover and Kindle. Below is a preview of what the book is actually about.
The country before the funding currency
It is tempting to begin the yen story with a low interest rate. A low rate tells you the price of borrowing. It says nothing about why the economy was willing to supply funds abroad, or why its institutions were able to intermediate them. Japan did not become the world's funding currency by accident. It did so after decades in which its institutions had learned a different discipline.
The Japan that entered the 1970s had just finished a transformation most economies never achieve. From the mid-1950s through the early 1970s, growth ran near 10 percent per year, driven by labor moving into manufacturing, rising educational attainment, and expanding participation in world trade. It was an economy built for a specific problem: how to connect numerous small household savers with industries requiring sustained, long-horizon funding. Banks, long-term credit banks, regional banks, and cooperative institutions occupied distinct roles under administrative guidance, and restrictions on competing forms of finance reinforced that structure.
The system succeeded at its task. It also contained a future complication that would matter enormously. Institutions that become skilled at allocating scarce finance do not automatically become skilled at managing abundant financial wealth.
The exchange rate stops being a constant
The postwar parity of 360 yen to the dollar ended when Japan provisionally floated the yen in August 1971. The Smithsonian agreement briefly set a central rate of 308, before Japan returned to floating in February 1973. These were changes in the framework within which companies made decisions, not simply movements on a market chart.
An exporter receiving a fixed number of dollars received fewer yen after each conversion. An importer needed fewer yen to pay the same invoice. Appreciation redistributes purchasing power; it is neither a universal national loss nor a universal national gain.
Japanese officials worried that a stronger yen would injure export industries, and policy sought to expand domestic demand partly to resist further upward pressure. Support for the external adjustment could intensify domestic excess. A central bank can make financing easier, but it cannot guarantee that additional borrowing produces imports rather than speculation, or productive investment rather than higher bids for existing assets.
Floating the exchange rate also did not mean freeing capital movements. Those remained subject to an extensive legal and administrative framework well after the exchange-rate regime changed. Freedom of the exchange rate and freedom of capital movement are separate dimensions, and they did not arrive together.
The inflation that preceded the oil
The first oil shock cannot explain an inflation that had already begun. Japan's consumer-price inflation exceeded 10 percent by May 1973, five months before the October oil crisis. Oil aggravated an existing imbalance. It did not arrive into an otherwise balanced economy.
Excessive easing in 1972 and delayed tightening in 1973 are now widely identified as central policy errors, and opposition to yen appreciation helped explain the delay. The oil shock entered an economy in which demand, money, and expectations were already exerting pressure.
The response was not one policy decision but a package: the official discount rate rose from 4.25 percent to 5 percent in April 1973, then to 9 percent by December, alongside quantitative influence over bank lending and regulated rates tied to official decisions. Reading the episode through a single interest-rate line would leave out part of the mechanism.
When oil prices rose again at the end of the decade, the authorities responded earlier and more decisively. The Bank of Japan restricted bank-loan expansion from the first quarter of 1979 and reached a 9 percent official discount rate by March 1980. Inflation stayed below 10 percent through the second shock. The different outcomes do not constitute a controlled experiment, but they make an exclusively oil-based explanation of the first inflation considerably less persuasive.
The point matters for everything that follows. Quiescent prices and inexpensive nominal borrowing were not permanent Japanese characteristics. The later monetary regime requires explanation precisely because this experience was so different.
The collateral nation
The late-1980s boom is usually described as a bubble. The book treats it as a financing structure, because that is what actually made it dangerous.
Real estate was widely accepted as collateral, and credit became concentrated in property and related activities while the interaction between collateral values and borrower profitability went insufficiently recognized. The risk was not merely that assets were expensive. It was that their prices had become part of the machinery that made further borrowing possible.
Commercial land prices in central Tokyo began rising around 1983, well before the fullest phase of the boom. The initial story was plausible: a financial center needs offices, communications infrastructure, and proximity. Rising demand for well-located commercial space can justify higher rents and land values. That argument has a limit — the income the location can produce. Replacing that limit with expected resale gains allows a reasonable demand story to support prices the original story cannot explain.
Consider a deliberately simplified transaction. A borrower buys a property for 100 million yen using 30 million of its own funds and a 70 million yen loan. The initial loan-to-value ratio is 70 percent. If comparable properties trade at higher prices and the property is now valued at 150 million yen, the same 70 percent lending rule now supports a 105 million yen loan. The ratio says nothing has become more aggressive. The balance sheet says otherwise.
Property risk also wore other industries' names. Banks expanded lending to smaller businesses against real-estate collateral, and property-related credit also passed through nonbank financial institutions. A retailer, a construction company, and a finance company occupy different industry classifications. Their obligations can nevertheless depend on the same property market, which means the classifications overstate diversification.
Follow the funds past their first recipient. A bank's loan is an asset on its balance sheet and a liability for the finance company borrowing from it. That company acquires an asset by lending onward. If the ultimate borrower fails, the loss can reach the bank through the intermediary's inability to repay. The chain may delay recognition without changing where the risk originated.
When asset prices fell but debts did not
An asset price can collapse in a day. The debt contract survives.
The Nikkei 225 turned sharply downward after its end-1989 peak, while land-price measures turned at different times. The Japan Real Estate Institute's six-major-city commercial land-price index, for example, peaked in September 1990. The Bank of Japan continued raising its official discount rate until August of that year. A quoted share price could change immediately. A property's valuation, a borrower's financial statements, a bank's classification of a loan, and a supervisor's recognition of a loss all moved on different calendars.
Start with the stock-market break and the banking emergency seems inexplicably late. Start with the banking emergency and the preceding years look comparatively healthy. Both readings miss the interval when losses could be economically real but only partly recognized.
The building is worth less. Its owner still owes the principal. A borrower counting on rental income, rising collateral, and easy refinancing must service the same nominal claim from a weaker position. Richard Koo made this asymmetry the center of his balance-sheet-recession interpretation: after the bubble, Japanese companies shifted from seeking additional funds toward repairing damaged balance sheets and repaying debt.
That shift did not appear in aggregate debt ratios immediately. Corporate debt relative to GDP continued rising into the middle of the 1990s. A ratio can rise because its numerator grows, because its denominator disappoints, or both. Some firms repaid while others borrowed to survive. The beginning of behavioral repair and the visible decline of a sector's debt ratio need not coincide.
Nor was the problem confined to debt. Ahearne and colleagues at the Federal Reserve identified a capital overhang: investment had been undertaken on expectations of continued high growth, and subsequent disappointment left the economy with a high capital stock relative to output and declining returns. A firm with an underused plant does not need another plant merely because borrowing becomes cheaper.
The carry trade is a financing decision, not a yield differential
By 2007, Federal Reserve economists could describe Japan as having had the world's lowest interest rates for more than a decade, making the yen a natural candidate for financing positions in other currencies. The attraction was not simply that one interest rate stood below another. It was that the anticipated income advantage appeared large relative to the exchange-rate movement that might erase it. A cheap liability was useful only if it remained manageable.
Consider an investor who borrows 150 million yen for one year at 0.5 percent. At 150 yen per dollar, that funds a one-million-dollar position. Suppose the dollar asset earns exactly 5 percent, and the exchange rate stays put. The position returns about 4.5 percent on the borrowed principal.
Now suppose the yen strengthens from 150 to 135, a 10 percent decline in the yen-per-dollar quote. The dollar asset still earns its 5 percent. But converting the proceeds back into yen no longer covers the debt. The position loses roughly 6 percent of the borrowed principal. The asset did nothing wrong. The financing failed.
That 10 percent move in the yen-per-dollar quote is not the same thing as a 10 percent appreciation in the yen. Measured in dollars, the yen rose about 11.1 percent. One number measures the fall in the dollar's yen price; the other measures the rise in the yen's dollar price. They are not interchangeable, and conflating them can misstate a break-even point by a full percentage point or more.
Leverage turns a small currency move into a large equity loss
Take a hypothetical balance sheet in yen-equivalent units. Assets of 100, debt of 90, equity of 10. The asset earns 5 percent, the debt costs 0.5 percent, and the exchange rate is unchanged. Assets grow to 105, debt to 90.45, and equity to 14.55 — a 45.5 percent gain on the initial 10.
Now apply the same 10 percent yen-per-dollar decline. Assets fall to 94.5. Debt stays at 90.45. Equity falls to 4.05. The equity return is negative 59.5 percent.
Nothing about the asset changed between those two cases. The equity cushion absorbed the entire joint shock. This is the distinction the book keeps returning to: an attractive asset and a resilient investment position are not the same thing.
October 1998, the episode most often summarized incorrectly
The yen's violent move in October 1998 is usually presented as a single dramatic trading day. It was the late expression of a financing problem that had been building for weeks.
The Asian crisis had spread from Thailand through other economies during 1997. Russia's effective default in August 1998 changed the willingness of investors and intermediaries to bear risk. Collateral and confidence were already deteriorating before the largest currency move arrived.
Japan's own currency initially moved differently from the currencies at the center of those crises. The CGFS review recorded continued dollar strength against the yen through the earlier Asian turmoil, with the rate reaching roughly 147 yen per dollar in August 1998. The yen's later violent strengthening should not be projected backward as if every stage of Asian distress had already produced the same response.
August 2024 under the microscope
August 5, 2024 is a common starting point for describing that unwind. It is an inadequate one. The BIS reconstruction placed the first signs of fragility weeks earlier, including a reversal of the yen's depreciation in the first half of July and a technology-led equity sell-off on July 24.
There was direct official intervention before the Bank of Japan's July rate decision. Japan's Ministry of Finance subsequently disclosed dollar sales and yen purchases of about 3.17 trillion yen on July 11 and about 2.37 trillion yen on July 12.
The Nikkei 225 closed at 31,458.42 on August 5, down 12.40 percent, and closed at 34,675.46 on August 6, a gain of 10.23 percent. The recovery was real and it was fast. That does not restore the wealth of anyone who was liquidated near the low.
The BIS identified the amplification mechanisms: low volatility beforehand, leveraged positioning, thin markets, and forced sales or protective purchases triggered by rising margin requirements. The size of each channel is still not separately measured, which is why the book does not pretend otherwise.
Why the yen is not Japan
Japanese households and institutions did not need to be leveraged currency traders for the yen to matter to global markets. Japan's private nonbank sector had substantial net foreign-currency claims, but it also held an even larger net long position in yen assets. The sector therefore did not qualify as a canonical yen carry trader in aggregate, even though some of its members could.
The same foreign bond can be a liability-matching asset, a long-term pension investment, or a leveraged trade. One owner needs income for insurance claims. Another needs returns over decades. A third needs its lenders to keep financing the position. The bond is identical. The pressure to sell is not.
Nor is the yen always a haven. A conditional haven is not a contradiction. The BIS has documented the institutional practice of using short-dated currency swaps to hedge longer-dated foreign securities, which means a Japanese insurer owning a long-duration foreign bond has bought a long-lived asset without necessarily locking in the cost of making every future cash flow usable in yen.
What you get
The hardcover is 402 pages with 32 chapters and 30 figures. It traces Japan's economic transformation from the 1970s through September 2026 and connects that history to the mechanics of the yen carry trade. The book includes worked examples, sources, a glossary, and an analytical index.
Get the hardcover on Amazon: $44.95
Read the Kindle edition: $9.99
Thank you for reading The Lead-Lag Report. I hope the book helps you look past the asset and examine the financing behind it.
Michael A. Gayed, CFA
Published by Felix Culpa Publishing, LLC. U.S. Amazon prices shown; check the listing for current pricing and availability.
The Lead-Lag Report is provided by Lead-Lag Publishing, LLC. All opinions and views mentioned in this report constitute our judgments as of the date of writing and are subject to change at any time. Information within this material is not intended to be used as a primary basis for investment decisions and should also not be construed as advice meeting the particular investment needs of any individual investor. Trading signals produced by the Lead-Lag Report are independent of other services provided by Lead-Lag Publishing, LLC or its affiliates, and positioning of accounts under their management may differ. Please remember that investing involves risk, including loss of principal, and past performance may not be indicative of future results. Lead-Lag Publishing, LLC, its members, officers, directors and employees expressly disclaim all liability in respect to actions taken based on any or all of the information on this writing.