An 18.6 Year Duration Book Yielding 10.8%: The Purest Rates Trade In The Drawer
36% leverage on long duration credit. The distribution is 31% return of capital. Know what you are underwriting.


Today’s Lead-Lag Report post is sponsored by TappAlpha

Income while staying fully invested in equities.
TappAlpha S&P 500 Growth & Daily Income ETF (TSPY)
TappAlpha Innovation 100 Growth & Daily Income ETF (TDAQ)
Investors have always had to choose: generate income or stay fully invested. TSPY and TDAQ do both—adding tax-efficient income potential to the S&P 500 and Nasdaq-100.
A tax-efficient alternative to traditional income strategies. Growth + Income — with the TappAlpha Growth & Daily Income ETFs.
Disclosures:
Investors should carefully consider the investment objectives, risks, charges and expenses of the ETFs identified on this site. This and other important information about the Fund are contained in the prospectus, which can be obtained by visiting tappalphafunds.com or by calling (844) 403-2888. The prospectus should be read carefully before investing.
ETFs are subject to additional risks that do not apply to conventional mutual funds, including the risks that the market price of an ETF’s shares may trade at a premium or discount to its net asset value, an active secondary trading market may not develop or be maintained, or trading may be halted by the exchange in which they trade, which may impact a Fund’s ability to sell its shares. Shares of any ETF are bought and sold at market price (not NAV) and are not individually redeemed from the Fund. Brokerage commissions will reduce returns.
The Fund invests in options contracts that are based on the value of the Index, including SPX and XSP options for TSPY and XND and NQX options for TDAQ. This subjects the Fund to certain of the same risks as if it owned shares of companies that comprised the Index, even though it does not own shares of companies in the Index. The Fund will have exposure to declines in the Index. The Fund is subject to potential losses if the Index loses value, which may not be offset by income received by the Fund. To the extent that the Fund invests in other ETFs or investment companies, the value of an investment in the Fund is based on the performance of the underlying funds in which the Fund invests and the allocation of its assets among those ETFs or investment companies. The Fund may incur high portfolio turnover to manage the Fund’s investment exposure. The Fund is classified as “non-diversified” under the 1940 Act.
As of the date of this prospectus, the Fund has no operating history and currently has fewer assets than larger funds. Like other new funds, large inflows and outflows may impact the Fund’s market exposure for limited periods of time. This impact may be positive or negative, depending on the direction of market movement during the period affected.
Due to the short time until their expiration, 0DTE options are more sensitive to sudden price movements and market volatility than options with more time until expiration. Because of this, the timing of trades utilizing 0DTE options becomes more critical. Even a slight delay in the execution of 0DTE trades can significantly impact the outcome of the trade. 0DTE options may also suffer from low liquidity, making it more difficult for the Fund to enter into its positions each morning at desired prices. The bid-ask spreads on 0DTE options can be wider than with traditional options, increasing the Fund’s transaction costs and negatively affecting its returns. These risks may negatively impact the performance of the fund.
Distributor: Foreside Fund Services, LLC
DISCLAIMER – PLEASE READ: This is sponsored advertising content for which Lead-Lag Publishing, LLC has been paid a fee. The information provided in the link is solely the creation of TappAlpha. Lead-Lag Publishing, LLC does not guarantee the accuracy or completeness of the information provided in the link or make any representation as to its quality. All statements and expressions provided in the link are the sole opinion of TappAlpha, and Lead-Lag Publishing, LLC expressly disclaims any responsibility for action taken in connection with the information provided in the link.
HIGH YIELD SPOTLIGHT
An 18.6 Year Duration Book Yielding 10.8%: The Purest Rates Trade In The Drawer
36% leverage on long duration credit. The distribution is 31% return of capital. Know what you are underwriting.
MICHAEL A. GAYED, CFA
Key Highlights
- Yield: 10.78% on price, 9.71% annualized on NAV, from the $0.0839 monthly distribution, per CEFConnect
- Duration: Average maturity of 18.6 years and 1,715 holdings, the longest-duration book in this column's recent run, per CEFConnect
- Discount: NAV $10.37 versus a $9.34 price, a 9.93% discount, per CEFConnect as of 10/1/2026
- Structure: 36.00% effective leverage on a multi-sector credit book, corporate bonds 117.61% of the leveraged portfolio, agency MBS 15.71%, asset-backed 10.81%, bank loans 7.58%
- Flag: The distribution is classified as managed, not income-only, per CEFConnect, so a portion of the payout can be return of capital in weak quarters
Every week, we'll profile a high yield investment fund that typically offers an annualized distribution of 6-10% or more. With the S&P 500 yielding less than 2%, many investors find it difficult to achieve the portfolio income necessary to meet their needs and goals. This report is designed to help address those concerns.
The Longest Duration Yield In The Drawer
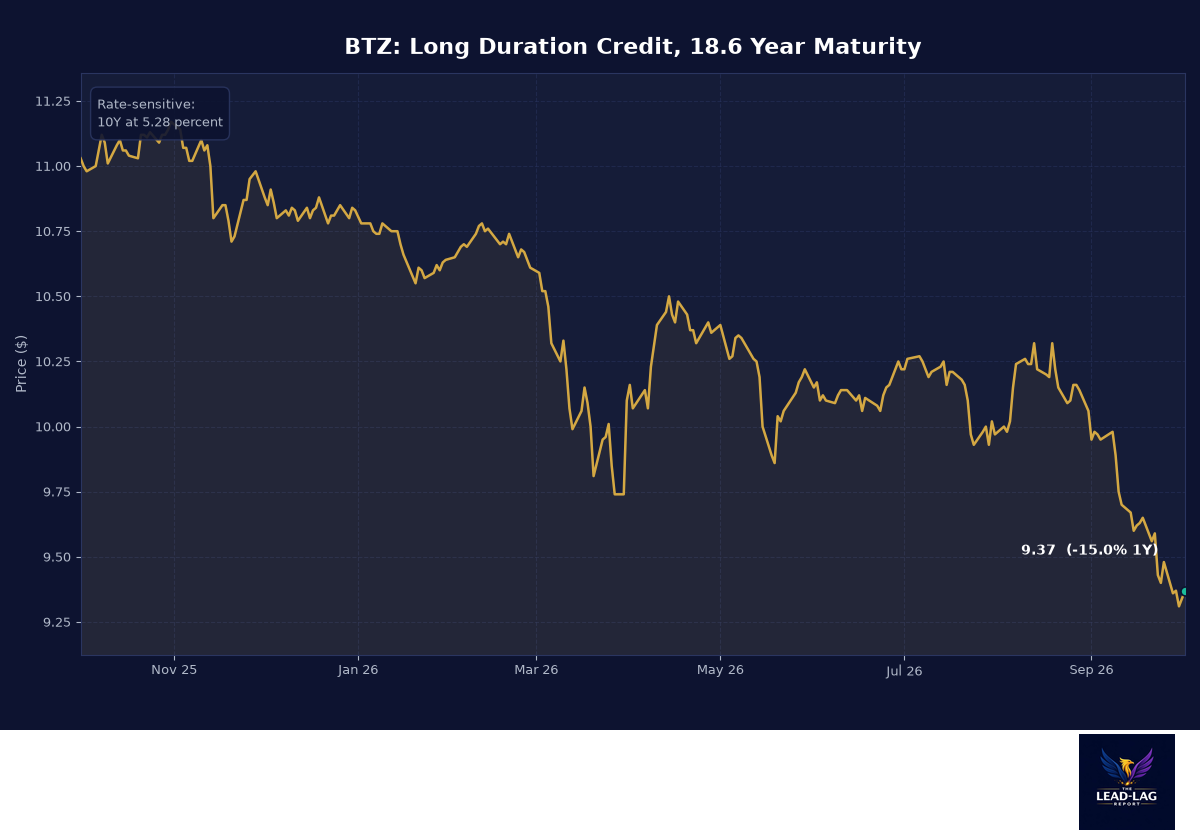
Every income investor is currently running the same calculation: the 10-year Treasury yields 5.28% after adding 104 basis points this year, and anything with duration has been set on fire. That is precisely why BlackRock Credit Allocation Income Trust (BTZ) now offers a 10.78% yield at a 9.93% discount per CEFConnect. This is a 36% leveraged, multi-sector credit fund whose bonds mature in 18.6 years on average, and the past year's 15% price decline, from $11.03 to $9.37, is nothing more than the market repricing an 18-year income stream against a 5.28% risk-free world.
The bull case is a single sentence: if the long end ever stops rising, an 18.6-year duration book with a 5.97% average coupon, levered 36%, produces equity-like total returns from bonds. The bear case is also a single sentence: the Fed hiked on September 16 to 3.75% to 4.00% and the term premium keeps building, and every 25 basis points of further long-end rise takes another bite out of the NAV. What makes BTZ worth a full workup rather than a dismissal is that the market has now moved the price to where both cases are honestly priced. This is not a free lunch. It is a duration bet with a 10.8% yield as the compensation.
My stance: this fund is only for investors with an explicit view that long rates are at or near their cycle peak. If you do not hold that view, own something shorter. If you do, this is one of the more efficient wrappers for it.
Fund Background
BTZ launched December 27, 2006 per CEFConnect, and its objective is the classic multi-sector credit brief: at least 80% of assets in credit-related securities, investment grade and below, across corporates, securitized products, and preferreds, with the freedom to move between sectors. BlackRock runs the book with 36.00% effective leverage, taking $967.8 million of common assets to roughly $1.51 billion of total investment exposure per CEFConnect as of 10/1/2026.
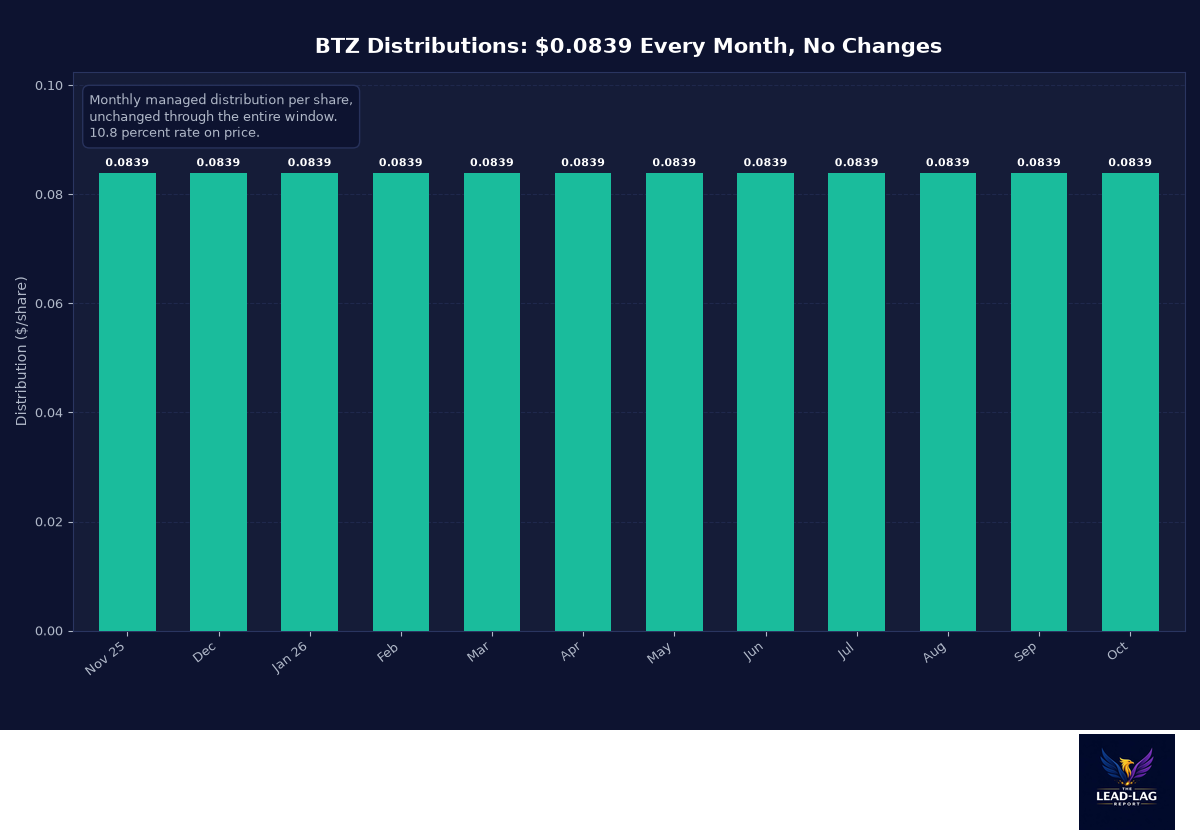
The fund has paid the same $0.0839 monthly distribution across the entire trailing window, per StockAnalysis, holding steady through the rate repricing of the past two years. That stability is the signature of a managed distribution policy, which CEFConnect confirms: the payout is a policy number, not a pass-through of quarterly income. BlackRock's own pay-date report for August 31, 2026 breaks down the composition: $0.0583 of net income and $0.0260 of return of capital per share, 69% income and 31% capital, and the fiscal year to date has run at a nearly identical 68% to 32% split. That composition is the number to watch, and I will come back to it, because it is where return of capital hides.
What Leverage Does To A Credit Book
The sector table reads oddly until you remember it is post-leverage: corporate bonds at 117.61% of the portfolio, agency MBS 15.71%, asset-backed 10.81%, bank loans 7.58%, government 4.26%, preferreds 3.07% per CEFConnect as of June 30. In plain terms, the unlevered book is roughly 80% corporate credit of mostly investment grade character, with a securitized sleeve, and the leverage concentrates the exposure into corporates. The average coupon is 5.97%, the average bond price $99.13, and the book spans 1,715 positions, which is genuine diversification, not a headline number.
The 18.6-year average maturity is the defining fact. Very little in the high yield CEF universe carries this much duration. When the long end collapses, funds like this produce spectacular NAV gains. In 2026, with the 10-year at 5.28% and rising, the mechanism ran in reverse: the share price fell 15.1% over the trailing year per daily closes while the fund's underlying credit did nothing dramatic. Nothing defaulted. Nothing broke. The bonds simply got marked against the new discount rate. That is the cleanest possible illustration of what you are buying here: not a credit story, an interest rate story.
Quantifying The Rate Lever
The trailing numbers frame the trade precisely. The share price fell 15.1% over the year, from $11.03 to $9.37, per daily closes, while the fund's NAV held up better, ending at $10.37 per CEFConnect. The loss decomposition mirrors the whole fund's design: most of it is the market discounting the duration, some of it is the NAV drifting with the long end, and almost none of it is credit. For an instrument this rate-sensitive, the position question is not whether to own credit, it is where you believe the 10-year's cycle peak sits, because at 18.6 years of maturity, the fund's NAV is effectively a leveraged price on that single variable.
The scenario math is stark. Using the 10-year's 104 basis point rise this year as the calibration, the book lost roughly 8 to 9% of NAV to rate moves, and the discount consumed the rest of the price decline. Symmetrically, a reversal of this year's rate rise at this duration is a low-to-mid teens NAV gain before any discount narrowing, of which the 9.93% discount provides the second, independent lever. Both levers point the same direction when rates fall, which is exactly why the payoff is convex, and why the fund is dangerous when they rise: the levers compress too, and the 31% return-of-capital share of the distribution does the slow damage while it happens.
The Managed Distribution Math
The $0.0839 monthly payout has been immutable across the entire trailing window per StockAnalysis, and the fund's classification of it as a managed distribution per CEFConnect means the policy is to hold the payout and let the composition of the payment float. BlackRock's August 31, 2026 pay-date report quantifies exactly that: of the latest monthly payment, 69% was net income and 31% was return of capital, and the cumulative fiscal year has run at 68% income to 32% capital. A meaningful slice of what you receive is not current portfolio income.
That needs to be said plainly because the yield headline invites misreading. A 10.78% distribution rate on price is not a 10.78% earnings yield. The fund is paying you a level distribution, roughly 69 cents of each dollar earned and 31 cents of your own capital returned per BlackRock's composition report, and the total return case depends on NAV recovery closing the gap. In rising-rate years, that is a slow leak. In a falling-rate year, an 18.6-year book can deliver a double-digit NAV gain that makes the managed payout look conservative. You are underwriting the rate cycle, not the coupon.
Advantages
The duration payoff is enormous if the cycle turns. With an 18.6-year book and 36% leverage, a one-point decline in long rates is plausibly a mid-teens NAV gain. Very few income vehicles give you that convexity alongside a 10.8% distribution while you wait, and the 9.93% discount adds a further margin on entry.
The credit book itself is institutional. 1,715 positions, an average price near par, BlackRock's credit platform, and a mostly investment-grade corporate core mean the default risk in any single name is negligible. This fund's risk is concentrated entirely in the rate axis, which at least has the virtue of being a risk you can identify and size.
The payout's stability has behavioral value. Whatever its composition, the check has not changed through the entire rate cycle, and for investors drawing income, that consistency is worth something real, provided they understand what it is made of.
Disadvantages
The coverage gap is the defining weakness. Roughly a third of the distribution has been return of capital this fiscal year, 32% cumulatively through August per BlackRock's pay-date report, and in a flat or rising rate world that composition slowly erodes NAV. The trailing year's 15.1% price decline is consistent with exactly that process.
The rate exposure is as bad as it gets in a rising cycle. The Fed resumed hiking in September, the term premium keeps widening, and every move in the long end hits this fund with maximum force. There is no credit cushion large enough to offset duration at this scale; if the 10-year goes to 6%, the distribution will not compensate for the NAV loss.
The managed distribution structure obscures the signal. With income-only funds, a cut is information about the portfolio. With a managed payout, the number stays constant while the composition quietly shifts toward return of capital, and investors who do not read the earnings line can mistake a melting fund for a stable one.
How It Fits In An Income Portfolio
Frame the rate scenarios before sizing anything. If the 10-year stabilizes near 5.28%, the NAV stops bleeding, the 10.78% distribution rate keeps arriving with roughly 69 cents of each dollar earned and 31 cents returned per BlackRock's composition report, and the position grinds out a high-single-digit total return. If the long end reverses a meaningful part of this year's 104 basis point rise, an 18.6-year book with 36% leverage produces a NAV gain likely in the mid-teens, before any discount compression from the current 9.93%. And if the 10-year goes to 6% or beyond, the duration math runs in reverse, the distribution does not compensate for the NAV loss, and the position must be small enough to hold through that rather than be forced out of it. All three scenarios are plausible, which is exactly why this is a position for investors with a rates view, not a default holding.
Who should own it: income investors who have deliberately decided the term premium is near its cycle peak and want the most efficient wrapper for that view, accepting that efficiency here means leverage and duration concentrated into a single factor. Who should not: anyone who reached for BTZ because 10.78% is the biggest number on a screen, or who needs the distribution to be pure earned income, since a meaningful third of it is not.
In the ladder of this month's six funds, BTZ is the macro bet. The others are credit bets, valuation bets, sector bets. This one is a single-factor wager on the long end of the Treasury curve, wrapped in 1,715 positions of diversified credit that will not save you if the factor moves the wrong way. Size it like the factor bet it is, and pair it deliberately: a fund this rate-sensitive is the natural companion to the short-duration and floating-rate holdings this column has covered all year, not to the other long-duration income positions. The combination that works is BTZ against a bill ladder or a senior loan sleeve, where the two legs offset each other's dominant factor and the distribution difference is your net carry. The combination that hurts is stacking BTZ on top of preferreds, REITs, and long bonds, three exposures to the same 10-year yield disguised as diversification.
Conclusion
BTZ is the purest duration trade I have profiled in this column, wrapped in a diversified credit book and marketed as an income fund. Judge it as what it is: a leveraged bet that the 40-year bull market in falling long rates, interrupted, is not coming back in reverse. Short-term, the 9.93% discount and the 10.8% payout rate provide real compensation if the long end stabilizes anywhere near current levels. Long-term, the composition says the income component of this distribution cannot grow from income alone indefinitely. Own it if you have a rates view, size it for a further NAV decline, and do not let the unchanged monthly check tell you a story the composition report contradicts.
The Lead-Lag Report is provided by Lead-Lag Publishing, LLC. All opinions and views mentioned in this report constitute our judgments as of the date of writing and are subject to change at any time. Information within this material is not intended to be used as a primary basis for investment decisions and should also not be construed as advice meeting the particular investment needs of any individual investor. Trading signals produced by the Lead-Lag Report are independent of other services provided by Lead-Lag Publishing, LLC or its affiliates, and positioning of accounts under their management may differ. Please remember that investing involves risk, including loss of principal, and past performance may not be indicative of future results. Lead-Lag Publishing, LLC, its members, officers, directors and employees expressly disclaim all liability in respect to actions taken based on any or all of the information on this writing.