The Yen Is The Other Side Of The 10-Year
The Bank of Japan has raised rates twice this year and the yen still trades near 158 per dollar. With the 10-year Treasury above 5%, the funding currency has nowhere to go.

Today’s Lead-Lag Report post is sponsored by Sparkline

Looking for a fresh take on value investing? ITAN helps investors modernize their U.S. value allocations, providing exposure to innovative, intangible-rich companies at attractive prices.
Learn more by visiting the ITAN Website or contacting the Sparkline Team.
DISCLAIMER – PLEASE READ: This is sponsored advertising content for which Lead-Lag Publishing, LLC has been paid a fee. The information provided in the link is solely the creation of Sparkline Capital. Lead-Lag Publishing, LLC does not guarantee the accuracy or completeness of the information provided in the link or make any representation as to its quality. All statements and expressions provided in the link are the sole opinion of Sparkline Capital and Lead-Lag Publishing, LLC expressly disclaims any responsibility for action taken in connection with the information provided in the link.
The Yen Is The Other Side Of The 10-Year
The Bank of Japan has raised rates twice this year and the yen still trades near 158 per dollar. The reason sits in Washington: with the 10-year Treasury above 5%, the world's most famous funding currency has nowhere to go.
MICHAEL A. GAYED, CFA
Key Highlights
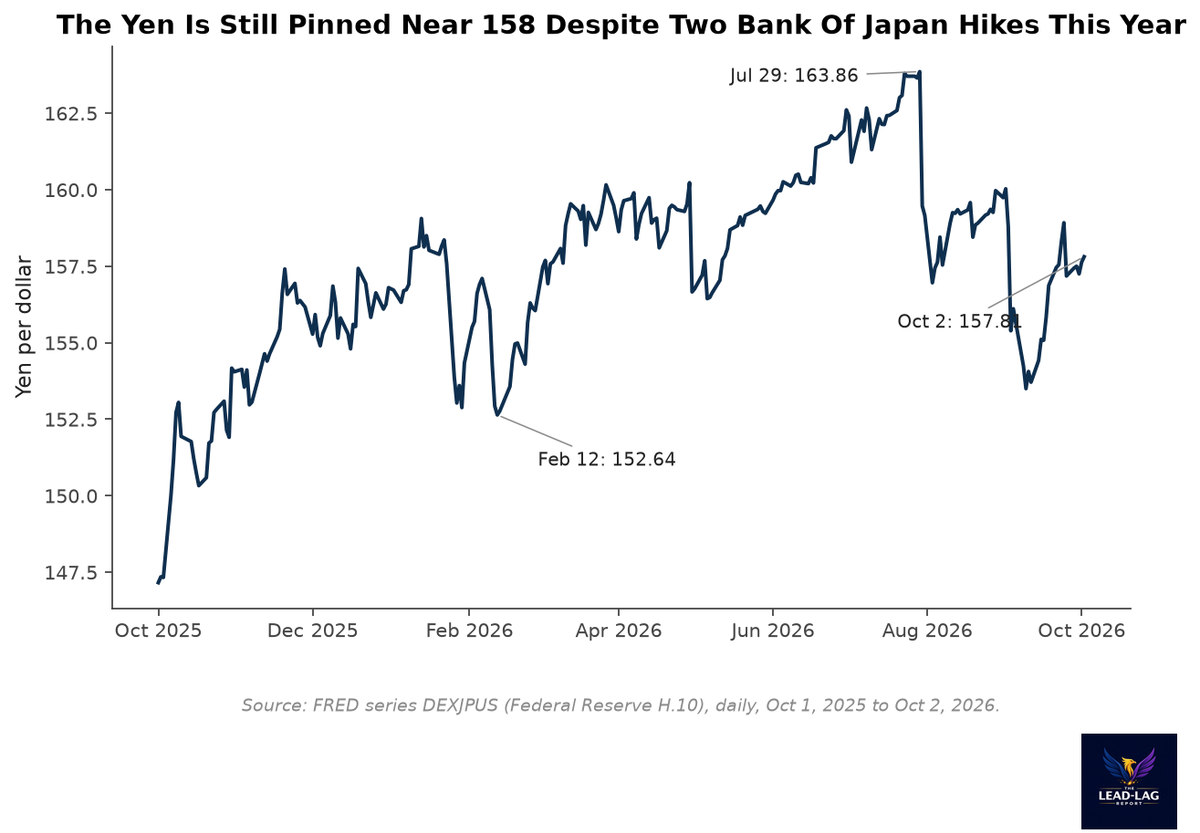
- The dollar closed at 157.81 yen on October 2, versus 147.35 a year earlier, after a 2026 high of 163.86 on July 29.
- The Bank of Japan lifted its policy rate to 1.25% on September 18 on a 7 to 2 vote, its second hike of 2026, while the Fed target sits at 4.00%, a gap of 2.75 points versus 3.75 a year ago.
- The 10-year Japanese government bond yield was about 3.09% on October 8, near a 30-year high, against 5.22% on the 10-year Treasury, a spread of roughly 2.1 points.
- Japan’s core inflation rate was 1.7% in August, which leaves the policy rate 0.45 points below core inflation even after two hikes.
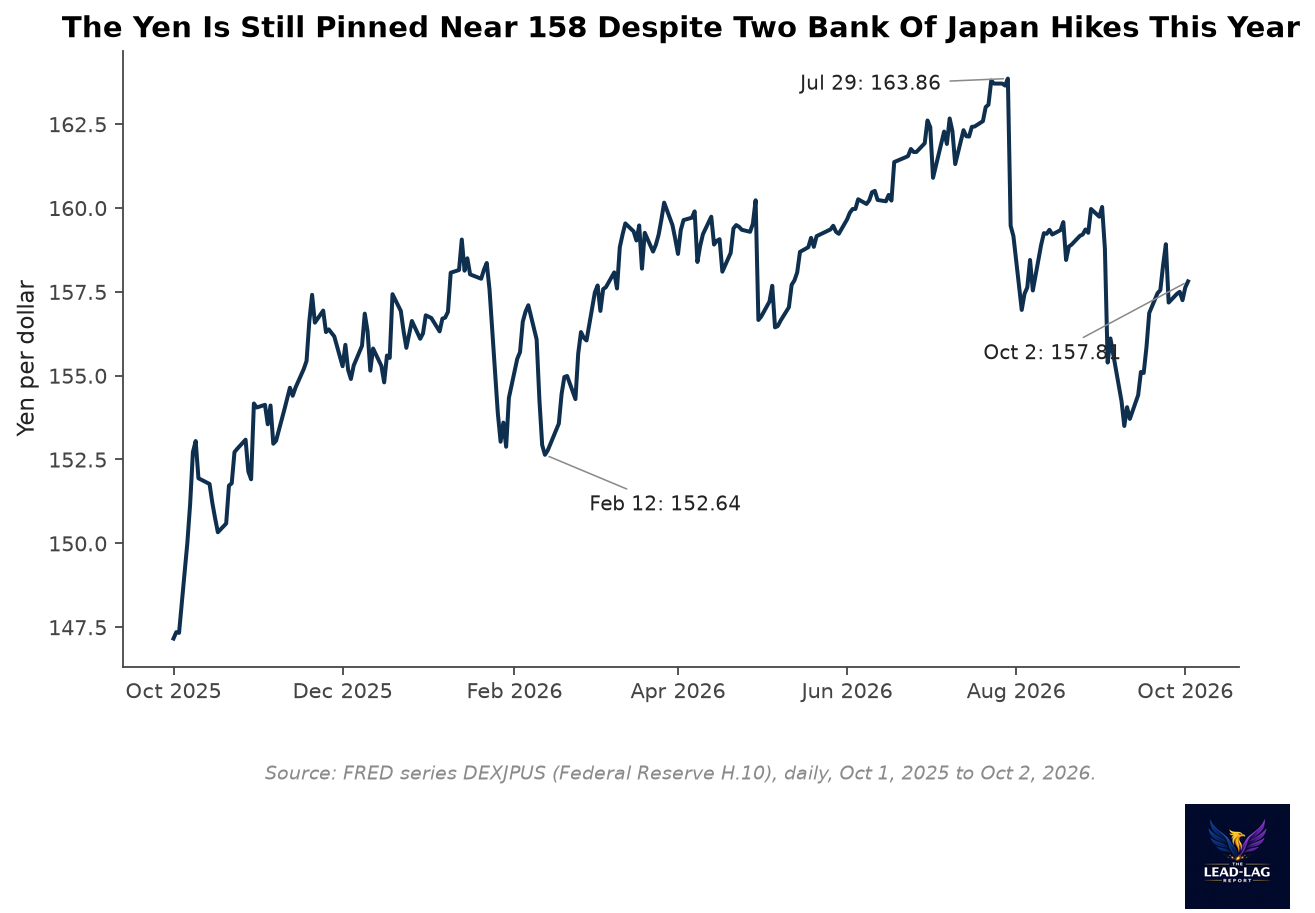
The dollar is worth about 158 yen, essentially where it was at the end of 2025, even though the Bank of Japan has raised its policy rate by 50 basis points since then.[1]
Conventional wisdom says that when a central bank raises rates, its currency should strengthen. In Japan, it has not. The yen finished 2025 near 156.80 per dollar, spent the year in a range between 152.64 and 163.86, and is back at 157.81 as of the latest Federal Reserve H.10 reading.[1] The currency has not trended. It has been held in place by two forces of nearly equal strength, and one of them is the 10-year Treasury yield. Understanding that tug of war is the most useful thing a global investor can do about the yen right now.
A Gap That Will Not Close
The Bank of Japan policy rate went from 0.50% in September 2025 to 0.75% in December, to 1.00% in June 2026, and then to 1.25% on September 18, when the board voted 7 to 2 in favor of the increase.[2][3] That is a cumulative 75 basis points in a year, a meaningful pace for a central bank that spent a generation at or below zero. Over the same period the Federal Reserve cut the upper bound of its target from 4.25% a year ago to 3.75%, then raised it back to 4.00% on September 16.[4][5]
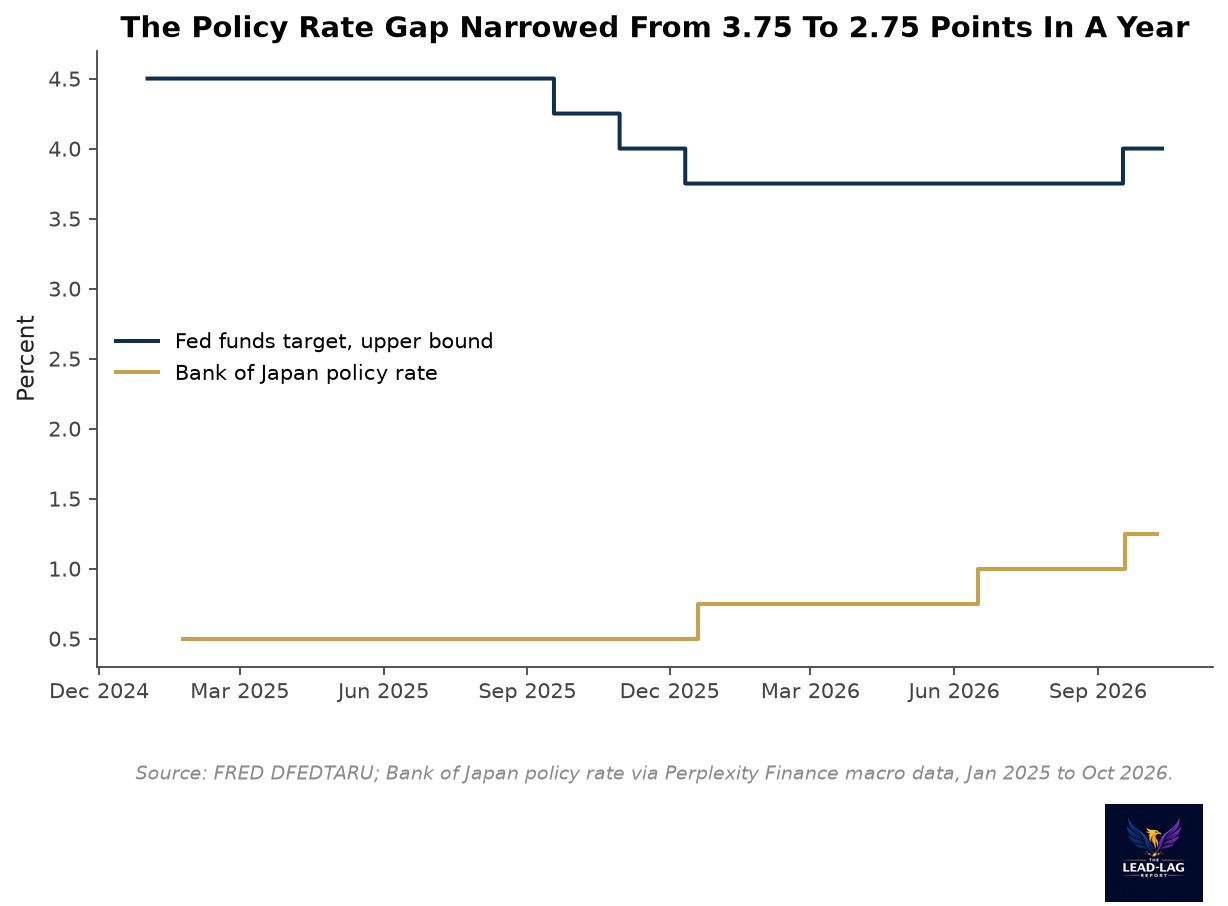
The gap narrowed from 3.75 percentage points to 2.75, which is real progress on paper. But 2.75 points is still a very wide differential. A trader who borrows yen at 1.25% and holds dollars at 4.00% earns a spread of 2.75% a year before any currency move, with a margin of safety that grows if the dollar stays strong. That is what a carry trade is. The incentive to hold the position does not vanish until the gap falls much further or until the currency moves enough to erase the spread, and the yen has not moved enough.
The longer end tells the same story. The 10-year Japanese government bond yield was about 3.09% on October 8, close to a 30-year high.[6] That is a dramatic rise for a market that once offered almost nothing. But the 10-year Treasury closed at 5.22% the same day, after hitting a 2026 closing high of 5.31% on October 5.[7] The spread is about 2.1 points. A currency does not need the rate differential to be wide. It needs the rate differential to be moving in its favor. Right now it is moving sideways.
The Hike That Is Not Enough
Part of the reason is that Japan is not tightening against inflation in the way the United States is. Japan’s headline consumer price inflation was 1.9% in August and core inflation was 1.7%.[8] With the policy rate at 1.25%, the real policy rate is negative by roughly 0.45 percentage points on the core measure and 0.65 points on the headline measure. Even after two hikes, the Bank of Japan is still providing stimulus in real terms. Currency markets look at real rates, not nominal ones, and a negative real rate is a reason to hold a currency less, not more.
The data coming out of Japan complicate the picture for the central bank. Real cash earnings rose 1.5% year on year in August, the eighth consecutive monthly gain and the longest run in close to a decade, which is the sort of wage progress that gives the BoJ confidence to continue.[9] But household spending fell 3.1% year on year in August, the ninth straight annual decline, compared with a median forecast of a 3.6% drop.[9] Wages are rising, yet consumers are not spending. That mix gives the central bank reason to be patient rather than aggressive.
The market has taken the hint. A Bloomberg survey of 52 economists published September 11 found none expecting a back-to-back move in October; about a third pointed to December and the rest to January.[9] Pricing for an October hike was roughly halved in the days before October 1, and the dollar climbed back above 158 yen.[10] A central bank that signals a gradual pace, and a market that believes it, leave the yen with some support but no catalyst.
The Ceiling And The Floor
The chart above shows a currency trading in a channel. The upper edge is policy: the dollar reached 163.86 on July 29 on a closing basis, and Tokyo and Washington acted together in late July after the pair touched 163.94 intraday.[1][9] The pair has not returned to that level. Officials have set no fixed trigger since, and verbal warnings are the more likely first response, but the late-July action established a level at which the authorities are willing to act.[9]
The lower edge is the rate differential. So far, each time the dollar has fallen toward the low 150s it has found buyers, because the carry is positive and the Fed is not cutting. The 152.64 low of February 12 has not been tested since, and the September trough stayed above it.[1] A band between roughly 152 and 164 has held for the whole year, and the pair is now in the middle of it, close to the center of gravity of the entire range.
For the band to break to the downside, something has to change in the other side of the equation. The most likely candidate is the 10-year Treasury. A fall in U.S. yields would narrow the differential from the dollar side, which is the only way the gap closes quickly while the BoJ moves slowly. The September jobs report is a first hint. Payrolls rose just 29,000 against a forecast of 84,000, and the odds of a Fed hold at the October 27 and 28 meeting rose to 82.8%.[11] But the 10-year yield has stayed above 5% anyway, because the move in long yields has been as much about oil and inflation as about growth.[7]
What The Weak Yen Has Done For Japan
A weak currency is a burden on importers and households but a tailwind for exporters and for the translated value of overseas earnings. It has been a tailwind for Japanese equities. The iShares MSCI Japan ETF, EWJ, is up 22.0% in dollar terms since October 1, 2025, and up 21.2% this year, while the S&P 500 ETF is up 16.5% over the same twelve months. The yen ETF, FXY, is down 7.4% over twelve months.[12]
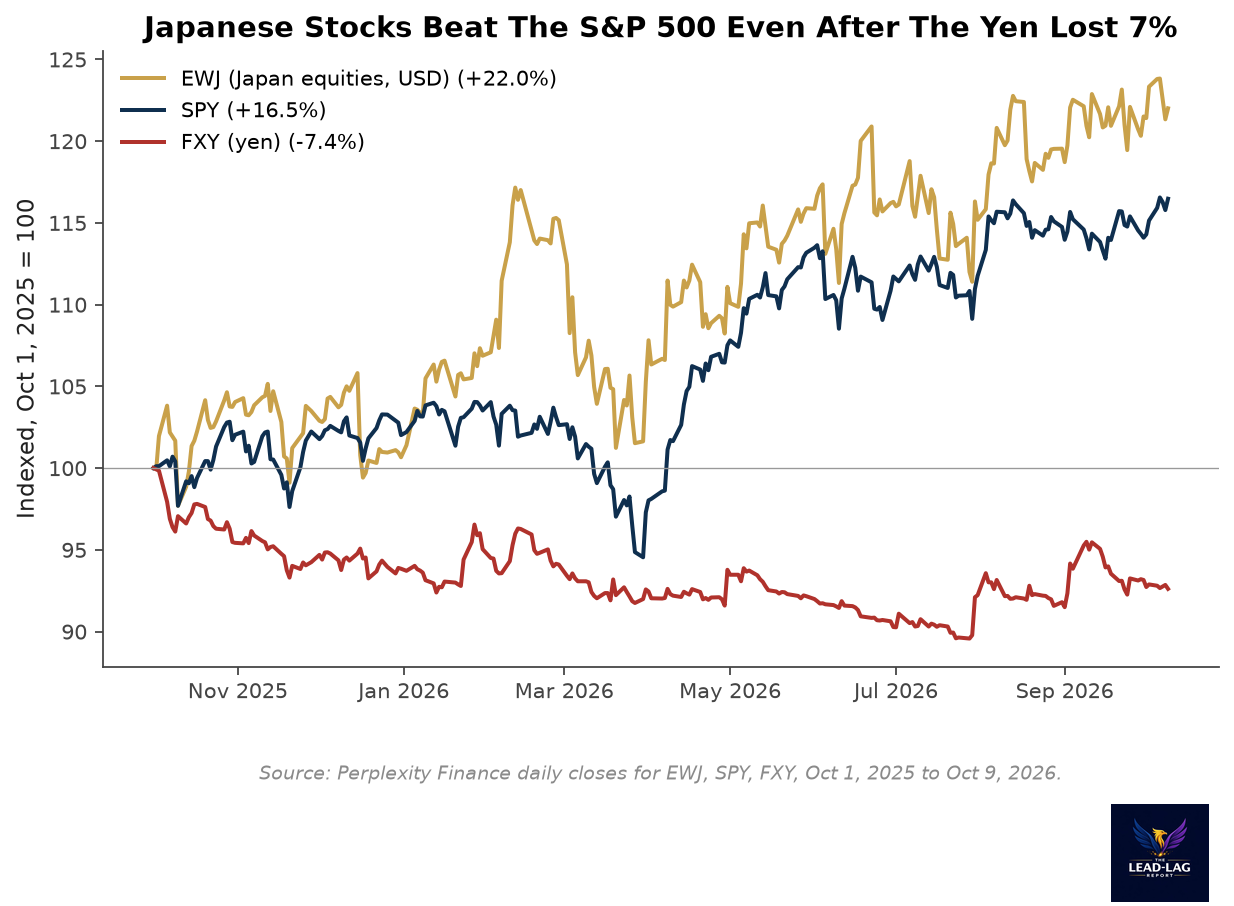
The point of the chart is not that Japan is a currency trade. It is that Japanese equities in dollar terms outperformed the U.S. market even after absorbing a 7% loss on the currency. For a global allocator who held Japanese stocks unhedged, the yen was a headwind that the equity gain more than offset.
The risk for that position is also the reason the 10-year matters. If the yen strengthened sharply, the translation tailwind would reverse, and a rapid unwinding of carry positions can transmit a currency move into every market where borrowed yen is invested. This is the mechanism people mean when they refer to the yen carry trade as a source of systemic fragility. It requires a catalyst, and the catalysts are the ones already named: a drop in U.S. yields, a faster Bank of Japan, or intervention.
The Arithmetic Of Carry
It helps to put numbers on how fragile or durable the carry position is. Using the policy-rate gap of 2.75 percentage points, a yen gain of about 2.7% over a year would erase the interest earned by borrowing in yen and holding dollars. From 157.81 that is roughly 153.6 per dollar. On the ten-year gap of about 2.1 points, the break-even is a yen gain of about 2.1%, or close to 154.5. Both of those levels are inside the range the currency has already traded this year, which means a normal swing in the exchange rate is enough to turn a profitable carry position into a losing one.[1][6][7]
That is why the structure is more brittle than the quiet price suggests. The profit from carry is small and steady, while the loss from a currency move is lumpy. A holder earning 2% to 3% a year is exposed to a 3% move in the currency over a few days. This asymmetry explains why carry positions tend to be abandoned all at once rather than gradually, and why the 154 to 153 area, where the break-even levels sit, is worth watching as a place where behavior can change. The value of the level is not that anything is guaranteed to happen there. It is that the economics of holding the position change there.
Three Ways The Range Resolves
The first possibility is that the range holds. The Fed stays on hold or hikes once more, the Bank of Japan moves in December, and the dollar stays between 154 and 160 yen for the rest of the year. This is consistent with the survey evidence and with the pricing of a hold in October.[9][11] Under that outcome, carry continues to pay, Japanese equities continue to benefit from a weak translation rate, and the yen remains a quiet currency.
The second possibility is that the 10-year yield falls. A weak run of labor data, a soft inflation report, or a resolution of the oil shock could bring the Treasury yield back toward 4.5%, which narrows the differential from the U.S. side. The yen would strengthen, and the strength could be fast if positioning is crowded. This is the outcome with the largest consequences for global portfolios, because it is the one most likely to force an unwinding.
The third possibility is that the yen weakens again toward the late-July extreme. That would require the Fed to hike more than the market expects or the Bank of Japan to stall. In that case intervention is the probable response, and the precedent of the joint action in late July suggests that authorities in both capitals are watching the same level.[9] The cost of being wrong in that direction is a sharp reversal, because intervention can arrive when positioning is already stretched.
What To Watch
The next Bank of Japan decision is the first marker; the survey evidence suggests a pause in October, with December as the more likely next move. The second is the Treasury 10-year. Any sustained move below 5% would narrow the differential from the U.S. side and would be the clearest signal that the yen’s range might shift lower in dollar terms. The third is the 163 to 164 yen level, where the late-July joint action set a precedent. And the fourth is Japanese real wages, because the central bank’s path depends on whether the eighth straight gain in August becomes a ninth.[9]
For now the yen is quiet. It sits at 158, in the middle of a year-long range, with a policy rate that is rising but still negative in real terms against a 10-year Treasury that is rising faster. The currency is not weak because Japan is doing nothing. It is weak because the other side of the trade is paying more than ever to hold dollars, and that side is set in Washington, not Tokyo.
Few understand this.
— — —
Notes
- USD/JPY (yen per dollar): 157.81 on October 2, 2026, 147.35 a year earlier, 163.86 high on July 29, 152.64 low on February 12, 156.80 at year-end 2025: FRED series DEXJPUS (Federal Reserve H.10).
- Bank of Japan policy rate history (0.50% through November 2025, 0.75% from December 2025, 1.00% from June 2026, 1.25% on September 18, 2026): Bank of Japan, via Perplexity Finance macro data (series BOJDTR).
- Bank of Japan 25 basis point hike on September 18 by a 7 to 2 vote: EBC Financial Group, October 2026.
- Fed funds target upper bound, 4.25% a year ago, 3.75% in early 2026, 4.00% since September 17: FRED series DFEDTARU.
- Fed target range raised to 3.75% to 4.00% on September 16, 2026: Federal Reserve FOMC statement.
- 10-year JGB yield about 3.09% on October 8, near a 30-year high: EBC Financial Group.
- 10-year Treasury constant maturity yield, 5.22% on October 8 and 5.31% on October 5: FRED series DGS10.
- Japan inflation rate 1.9% and core inflation rate 1.7% for August 2026: Statistics Bureau of Japan, via Perplexity Finance macro data.
- Japan real cash earnings +1.5% in August (eighth straight gain), household spending negative 3.1% (ninth straight decline), Bloomberg economist survey of September 11, July joint action by Tokyo and Washington after USD/JPY reached 163.94: EBC Financial Group.
- October BoJ hike pricing roughly halved and USD/JPY above 158.00 on October 1: TMGM, October 1, 2026.
- September payrolls +29,000 vs 84,000 forecast and CME FedWatch hold odds of 82.8%: CNBC, October 2, 2026.
- EWJ, SPY and FXY daily closes, October 1, 2025 to October 9, 2026: Perplexity Finance.