A Market Divided: Two Signals Shout Risk, Two Whisper Caution
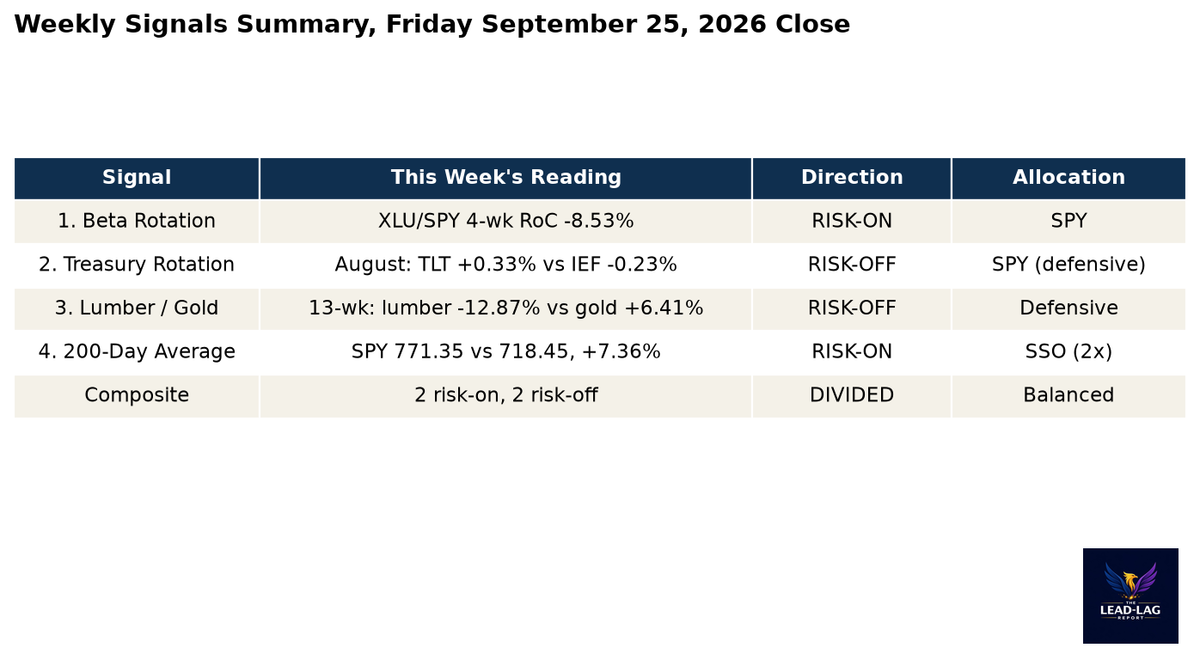
The S&P 500 sits 7.36% above its 200-day average and utilities just made new lows, but gold outran lumber by nineteen points over thirteen weeks and long bonds led August. Two risk-on, two risk-off: the split itself is the signal.

Sponsored by Rayliant

Innovation Has No Borders
The race to develop transformative technologies is global. While U.S. companies command much of the attention, innovation is also reshaping industries across China’s domestic economy.
CNQQ — the Rayliant-ChinaAMC Transformative China Tech ETF — offers investors:
- Exposure to Chinese companies driving innovation across a range of sectors
- Access to themes extending beyond traditional definitions of “tech” or AI
- A focused way to diversify exposure to transformative technologies beyond the U.S.
See China’s innovation story through a different lens.
Join Dr. Jason Hsu, CIO of Rayliant, for a live webinar exploring the forces transforming China’s economy — and where investors may be overlooking innovation.
Mag 7 Meets China: Investing in a G2 World with CNQQ
Wednesday, September 30, 2026 | 10:00–11:00 AM ET
CFP CE Credit Pending Approval | 1 Credit Hour | Investment Planning | Sponsored by Rayliant
“Magnificent Seven,” or “Mag 7,” is an informal term referring to Alphabet, Amazon, Apple, Meta Platforms, Microsoft, NVIDIA, and Tesla.
This is paid advertising content for which Lead-Lag Publishing, LLC has been paid a fee.
Before investing in any ETF, it is critical for investors to carefully consider the fund’s investment objectives, risks, charges and expenses. To obtain a full or summary Prospectus for the Fund, which contains this and other information, please visit https://funds.rayliant.com/CNQQ. Please read the Prospectus carefully before investing.
Investing involves risk, including possible loss of principal. The Fund is non-diversified and is concentrated in China and technology-related industries, so adverse events in those areas may disproportionately affect performance. Investments in Chinese issuers are subject to government intervention, policy shifts, capital restrictions and limited legal recourse; many Chinese companies use variable interest entity (VIE) structures that do not provide direct equity ownership. Emerging markets, foreign securities and currency risks may increase volatility. The Fund is newly launched and lacks an operating history. Shares are bought and sold at market price (not NAV) and are not individually redeemed from the Fund. Brokerage commissions will reduce returns.
The Rayliant-ChinaAMC Transformative China Tech ETF is distributed by Northern Lights Distributors, LLC, Member FINRA/SIPC. The Rayliant-ChinaAMC Transformative China Tech ETF is not affiliated with Northern Lights Distributors, LLC.
A Market Divided: Two Signals Shout Risk, Two Whisper Caution
The S&P 500 sits 7.36% above its 200-day average and utilities just made new lows, but gold outran lumber by nineteen points over thirteen weeks and long bonds led August. The scoreboard is split down the middle, and the split itself is the signal.
MICHAEL A. GAYED, CFA
Key Takeaways
- Beta Rotation: RISK-ON. The XLU/SPY ratio's 4-week rate of change is -8.53%: utilities fell 8.5% in four weeks while SPY went nowhere, the most one-sided defensive abandonment of the year.
- Treasury Rotation: RISK-OFF. August's completed month went to the long bond: TLT +0.33% versus IEF -0.23%. September then punished both, TLT -3.88% month-to-date as the 10-year broke to 5.18%.
- Lumber/Gold: RISK-OFF. Over the trailing 13 weeks lumber fell 12.87% while gold rose 6.41%, a 19-point spread between the economy's raw material and its fear asset.
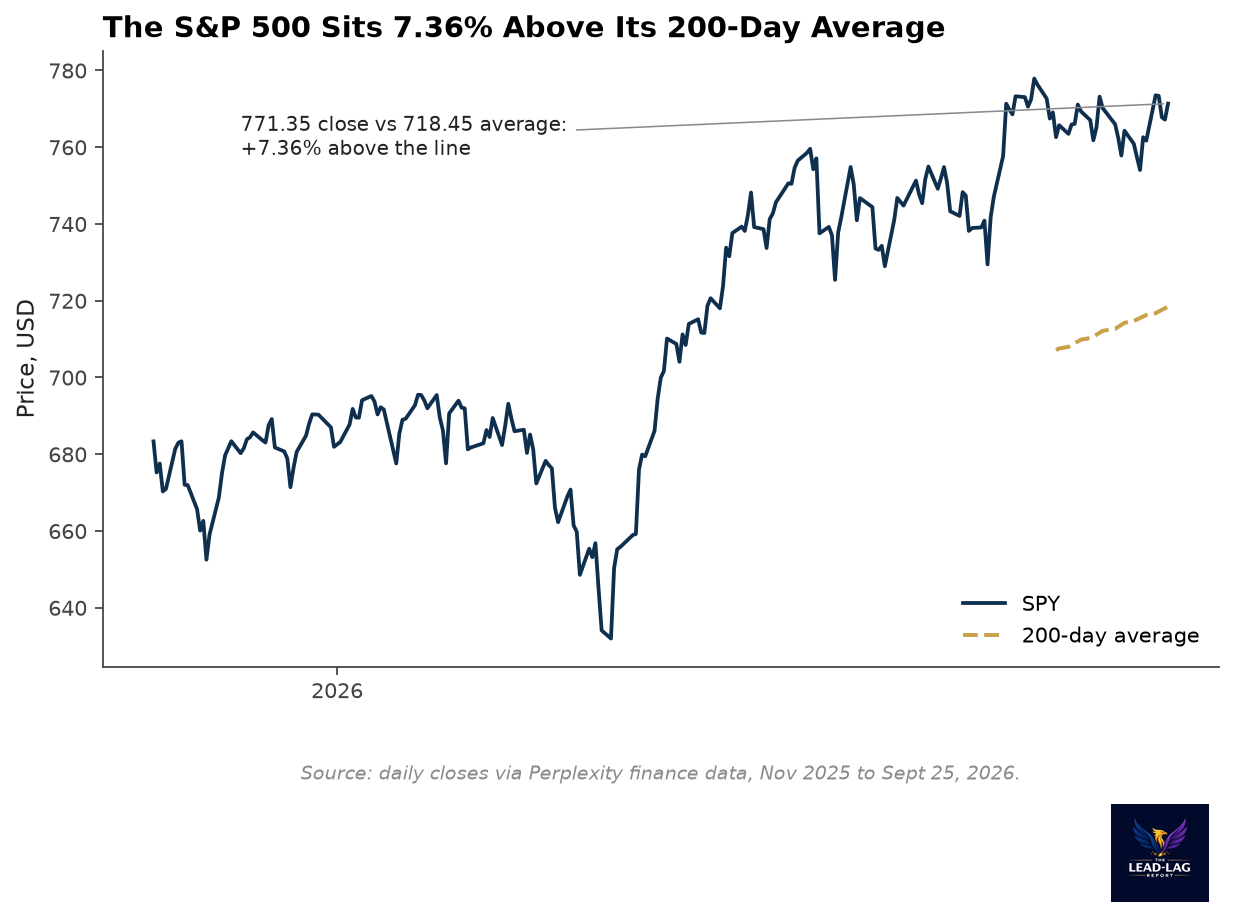
- 200-Day Average: RISK-ON. SPY closed Friday at 771.35 versus a 200-day average of 718.45, 7.36% above the line, which keeps the trend signal in its leveraged stance.
Every Monday the Lead-Lag Report runs the same four questions through the same four instruments, and most weeks the answers cluster. Not this one. The two signals that read market positioning, beta rotation and the 200-day trend, are as risk-on as they have been all year. The two signals that read the real economy and the bond market's expectations, the Treasury rotation and the lumber-gold pair, are waving caution. Two and two. When the scoreboard splits like this, the composite reading matters less than the reason for the split, and the reason is that equity investors and bond investors are currently pricing two different worlds.
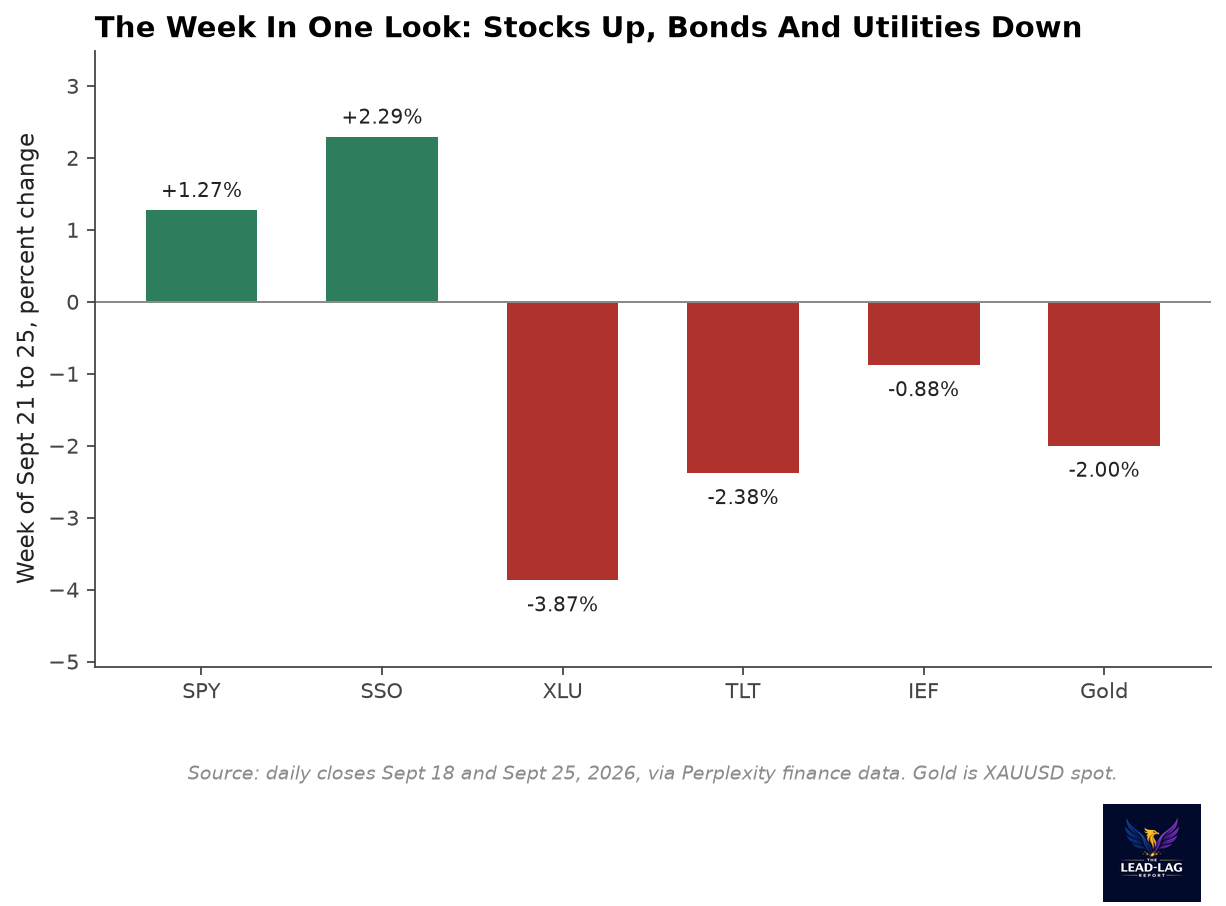
The week itself tilted toward the risk camp. SPY gained 1.27% to close at 771.35, and the doubled version of the same trade, SSO, gained 2.29%. Everything defensive paid for it: XLU fell 3.87%, TLT fell 2.38%, IEF fell 0.88%, and even gold gave back 2.0% to close at 4,284.97. So the tape rewarded the risk-on half of the scoreboard all week, which is worth remembering when you read the two caution signals below. The market is not confused about what it prefers right now. The question is whether what it prefers is durable.
Signal 1: Beta Rotation (XLU/SPY 4-Week Rate of Change)
The beta rotation signal asks one question: over the past month, did money move toward defensiveness or away from it? The instrument is the XLU/SPY ratio, and its 4-week rate of change just printed -8.53%, the ratio's steepest one-month decline since the signal series began running in this format. Utilities fell 8.5% over four weeks while the S&P 500 moved 0.03%, which is not a rotation so much as an evacuation. A negative rate of change on this ratio is the historical risk-on configuration, and the allocation rule stays mechanical: the signal allocates SPY.
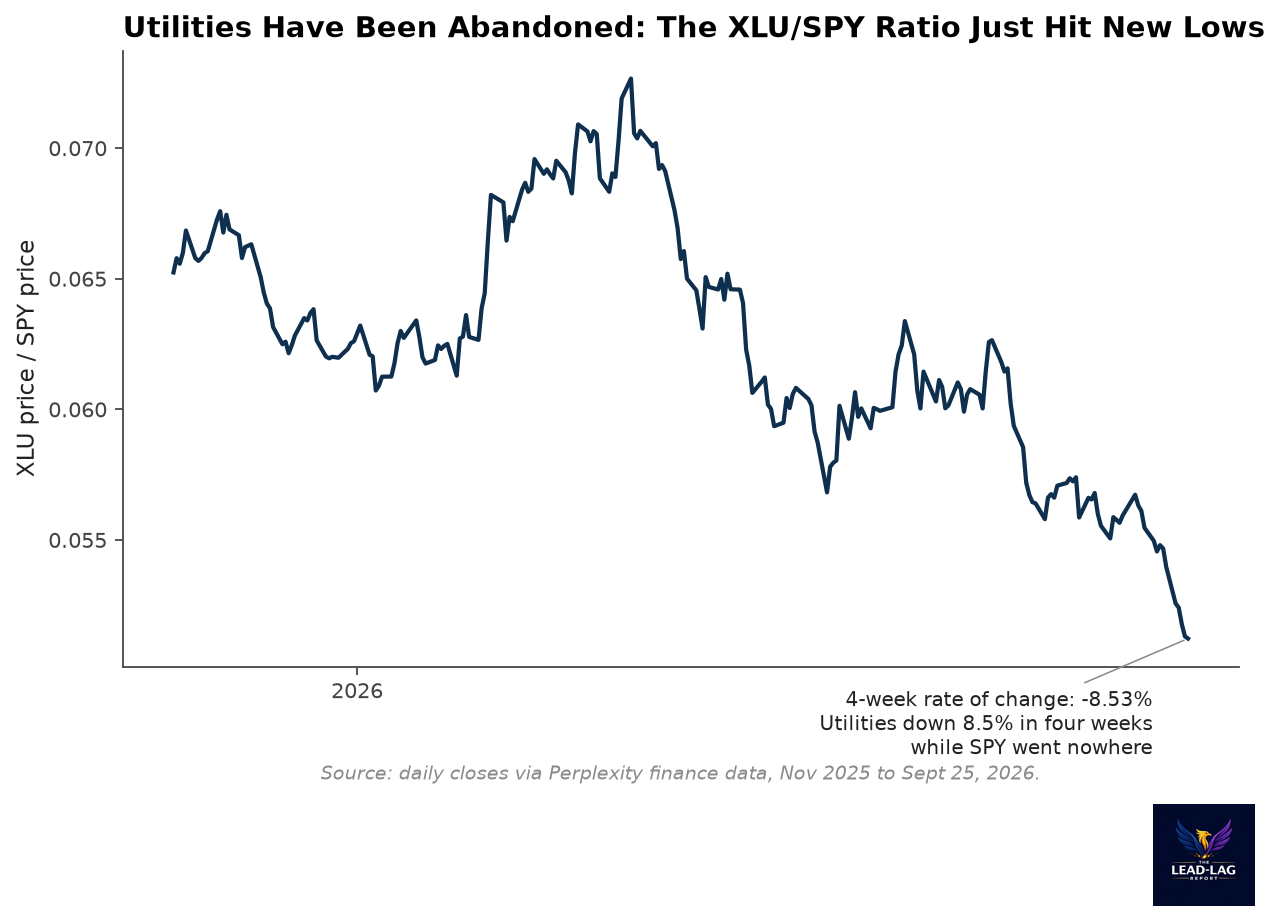
The context makes the reading stronger, not weaker. Utilities are down 9.19% over the past month and 11.37% since early November while the S&P 500 gained 12.88% over the same span. Rate-sensitive sectors are being repriced by a 10-year yield at 5.18%, its highest since 2007, and every basis point of that selloff pushes the marginal dollar further from the defensive trade. What would flip this signal next week: a sharp equity drawdown that sends money back into utilities faster than the broad market falls, which is the pattern the ratio is built to catch. Short of that, the risk-on stance holds.
Signal 2: Treasury Rotation (TLT vs IEF, Prior Month)
The Treasury rotation signal reads the prior completed month and asks which part of the curve won. August's answer was the long end: TLT returned +0.33% while IEF lost 0.23%, a 0.56-point win for the 20-plus-year bond over the 7-to-10-year. Per the rule, when the long bond outperforms, the signal reads defensive, and the allocation stays in SPY but in its defensive posture. This is the second consecutive cautious reading from the bond market, and September is making the point more forcefully: TLT is down 3.88% month-to-date and IEF down 2.95% as the long selloff accelerates.
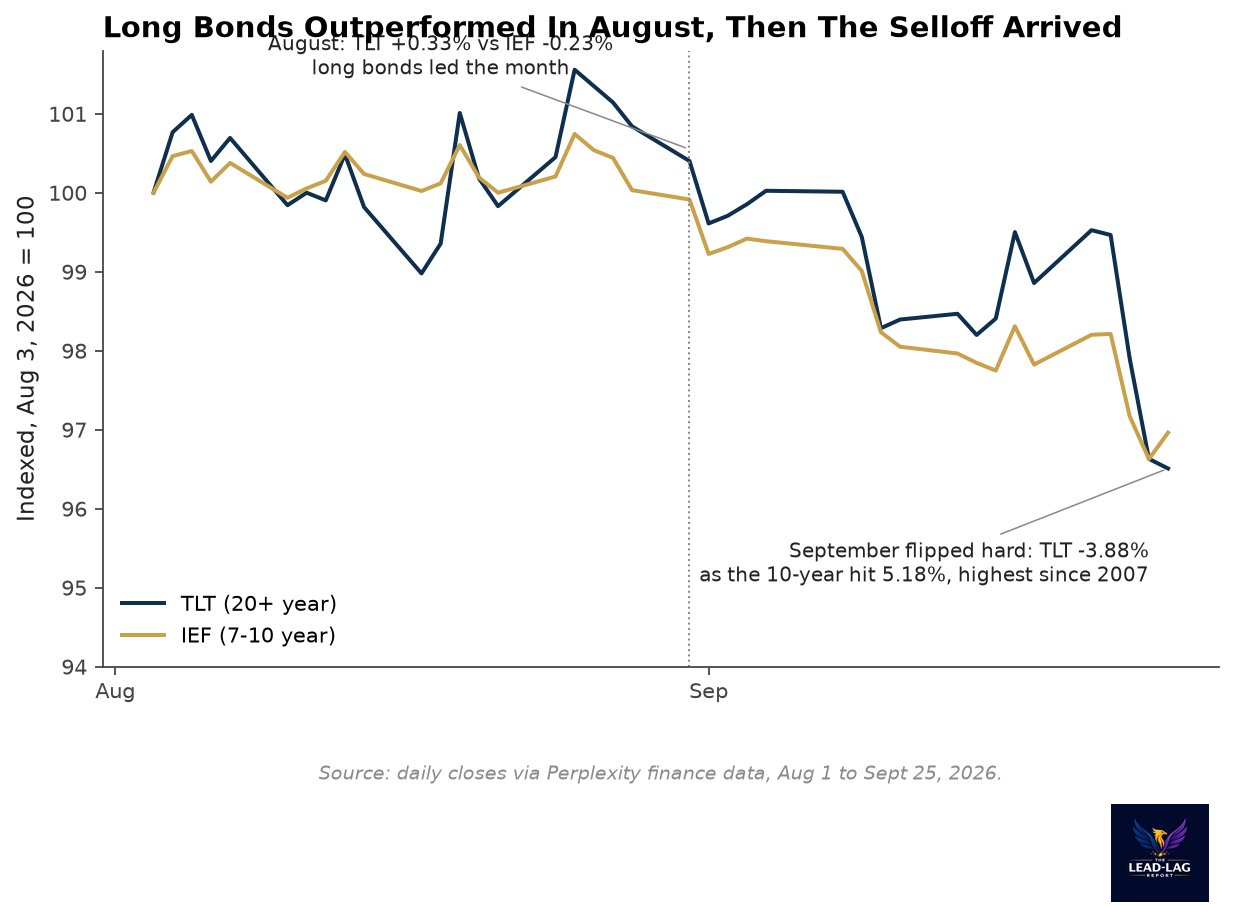
Here is the tension worth naming. A bond market that rallies hardest at the long end is a bond market pricing economic trouble ahead, and it is the same market that just pushed the 10-year to 5.18% on fiscal and term-premium grounds. Those are two different stories that produce the same defensive reading for different reasons, and the signal does not distinguish between them. What would flip this signal next week: September closing with the belly outperforming the long end, which at the current pace of selling would require the long bond to stabilize in a hurry. Until a new month completes, defensive stands.
Signal 3: Lumber/Gold (13-Week Relative Performance)
The pair trade between lumber futures and gold spot is the cleanest real-economy gauge in the set: lumber prices the physical economy's construction pipeline, gold prices fear and monetary hedging. Over the trailing 13 weeks, from June 25's close through Friday, lumber fell from 617.5 to 538, a 12.87% decline, while gold rose from 4,026.92 to 4,284.97, a 6.41% gain. The 19.3-point spread in gold's favor is the defensive configuration, and it has now held for most of the summer. The signal allocates defensive positioning when gold wins, and gold won.
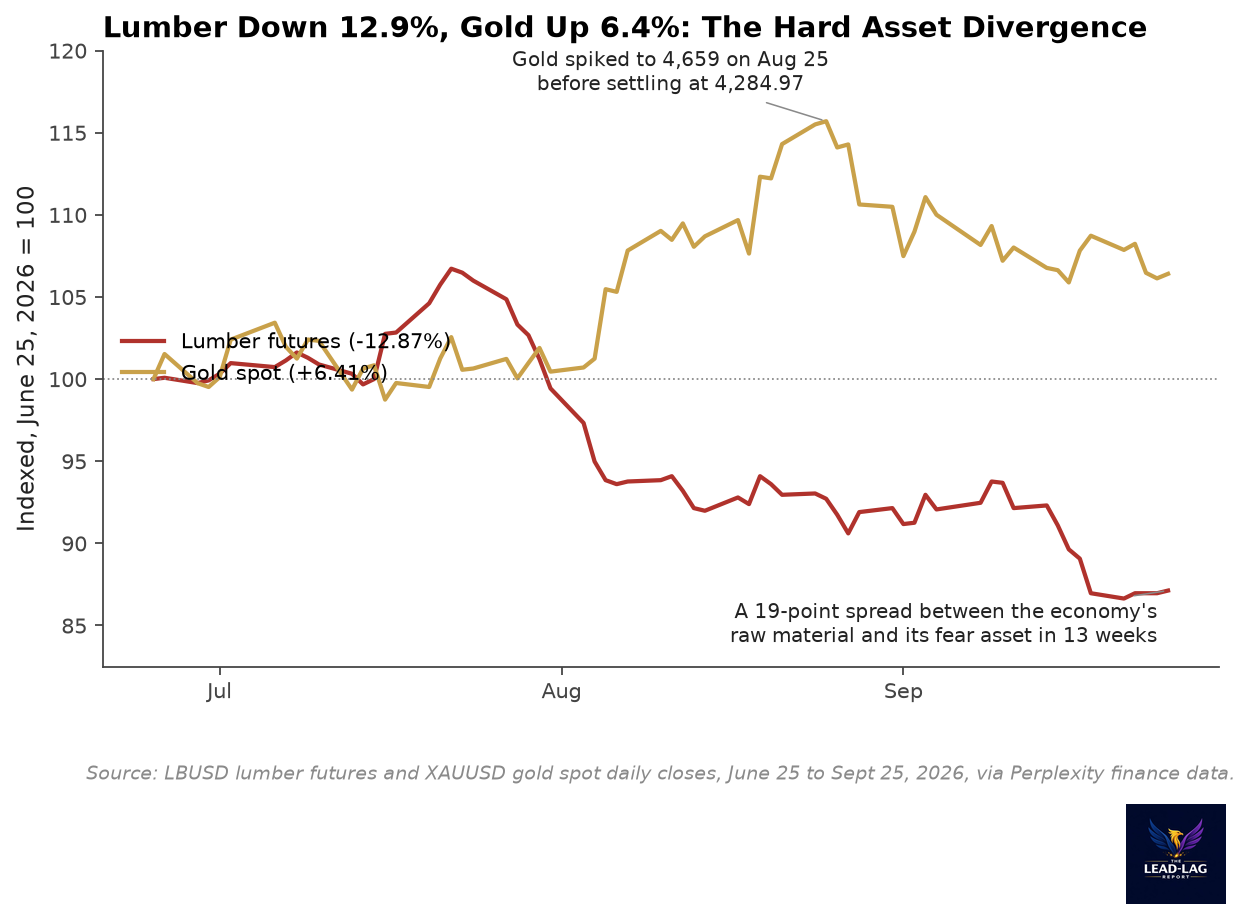
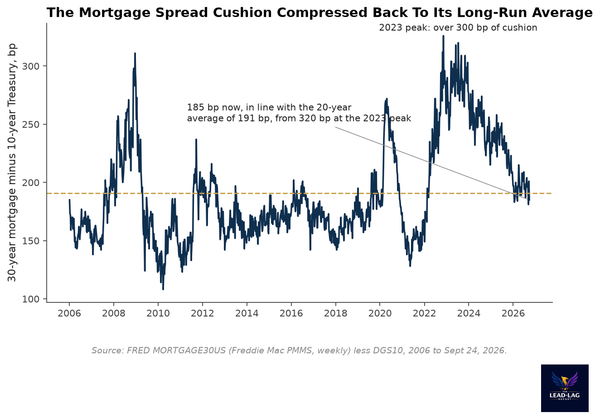
The lumber leg deserves a closer look, because a 12.87% quarterly decline in the physical input to homebuilding is a macro statement in its own right. It rhymes with the housing story running elsewhere in this report: the 30-year mortgage at 7.03%, the spread cushion compressed back to its 20-year average, and builders facing the most expensive financing of the era. Gold's path was more dramatic than its endpoint, spiking to 4,659 on August 25 before settling back 8% to end the window. What would flip this signal: two things, separately or together, a rebound in lumber off the 538 level, or a further gold decline that hands the 13-week race to the economy. Neither happened this week. Defensive stands.
Signal 4: 200-Day Moving Average (SPY vs SMA)
The trend signal needs no interpretation. SPY closed Friday at 771.35. Its 200-day simple moving average stands at 718.45. The index is 7.36% above the line, which keeps the signal firmly risk-on and its allocation rule in the leveraged stance: SSO, the 2x S&P fund. Over the full span the trend signal has been live this cycle, that stance has been rewarded, SPY is up 12.88% since early November while SSO is up 21.08%, the arithmetic of leverage compounding in a grinding uptrend.
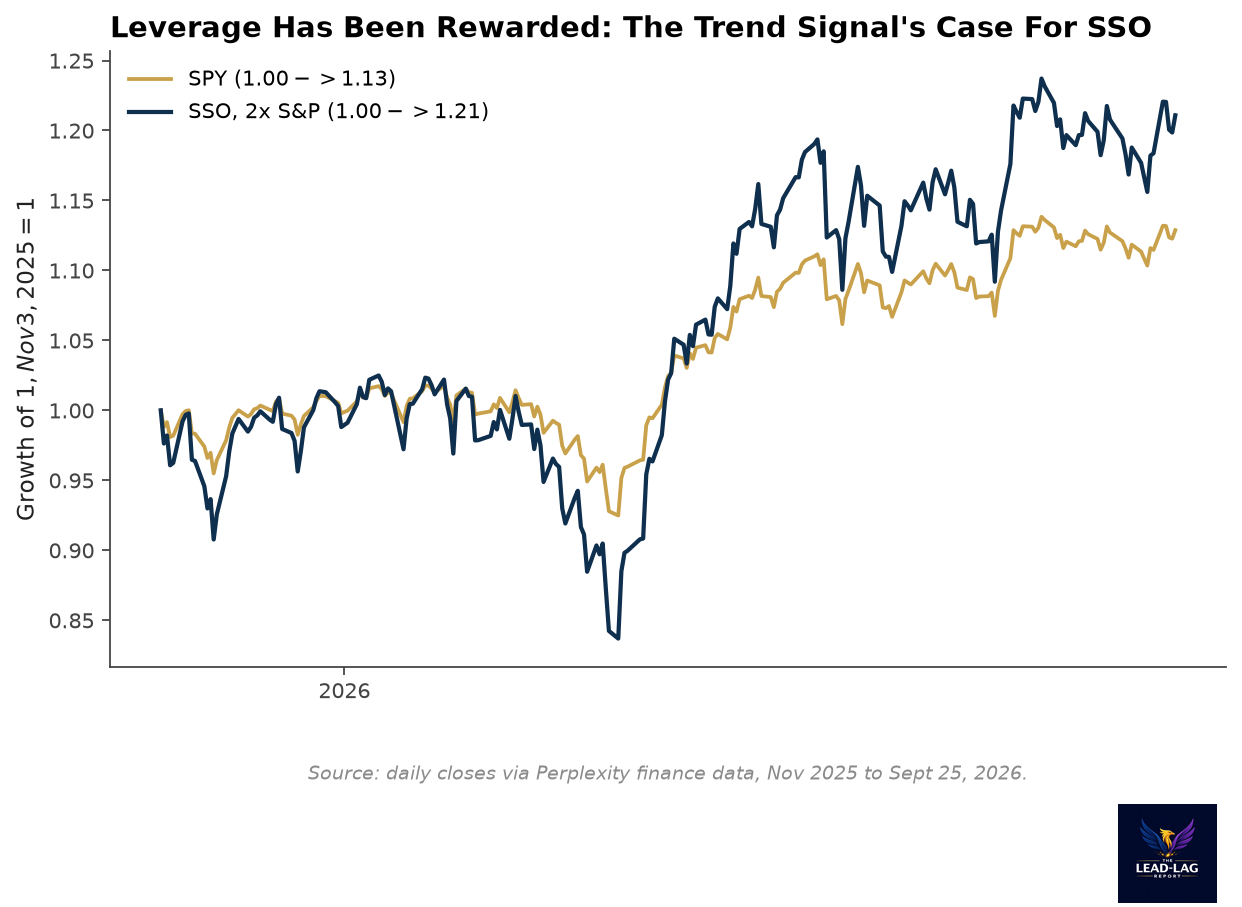
The honest caveat about this signal is that a 7.36% cushion cuts both ways. It means the trend has real distance from its floor, and it means there is real room to fall before the signal would flip. A market at this extension does not need a crash to reach its 200-day, only a pullback of ordinary size, roughly 6.9% from Friday's close. The signal's discipline is that it does not act on that possibility until the line is actually crossed. Discipline is the entire edge of a trend signal, and the line is at 718.45.
Conclusion and Allocation Guidance
Two risk-on, two risk-off: the composite is divided, and the correct response to a divided composite is balance, not coin-flipping. But look at which signals sit on which side. The risk-on pair, beta rotation and trend, are both reading the same thing: what equity investors are doing with money already committed to equities. The risk-off pair, Treasury rotation and lumber-gold, are both reading the same thing: what the bond and commodity markets expect for the economy ahead. Positioning is offensive. Expectations are defensive. That is the exact configuration that precedes either a broad confirmation, where the economy re-accelerates and the caution signals flip, or a positioning unwind, where the economy weakens and the equity signals flip. The four instruments do not agree on which, and neither, honestly, does anyone else.
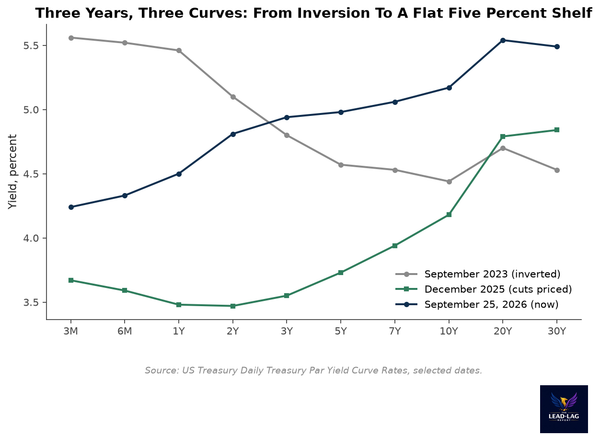
The week ahead carries real weight for the resolution. The 10-year at 5.18% is the fulcrum: a stabilizing long end would relieve the pressure on utilities and mortgages and hand the next Treasury reading to the belly, while a run above 5.25% would tighten every transmission channel at once, housing, equities, credit. Watch the XLU/SPY ratio for whether the utility abandonment accelerates or stalls, and watch whether lumber holds the 538 level. The signals will update on next Friday's close, and the standing rule applies as always: the signals describe the market's posture, the allocation rules respond mechanically, and no signal in this report is a prediction.
Bottom Line: with the composite split 2 to 2, the allocation stance is balanced. The equity-trend half of the scoreboard argues for staying long and even leveraged, the macro half argues for sizing down and keeping duration short. The mechanical reading splits the difference: hold equity exposure per the trend and beta signals, respect the caution signals by not adding leverage beyond what Signal 4's rule dictates, and let the 10-year yield at 5.18% be the tiebreaker it is likely to become.
— — —
Notes
- All equity, ETF, lumber, and gold prices are daily closes through Friday, September 25, 2026, via Perplexity finance data (SPY 771.35, XLU 39.51, SSO 70.98, TLT 79.32, IEF 90.00, LBUSD 538.0, XAUUSD 4,284.97). Signal windows: XLU/SPY 4-week rate of change -8.53%; August completed month TLT +0.33% versus IEF -0.23%; lumber/gold 13 weeks from June 25 close 617.5 and 4,026.92; SPY versus 200-day SMA 771.35 versus 718.45.
- 10-year Treasury yield 5.18% on September 24, 2026, FRED series DGS10; the September 15 print of 5.041% was the highest since July 2007: CNBC.
- 30-year fixed mortgage 7.03% for the week of September 24, 2026: Freddie Mac PMMS.
- Gold spot window peak 4,659.06 on August 25, 2026, XAUUSD daily closes via Perplexity finance data.