
The $15 Billion BDC at a 19% Discount That the Market Has Not Figured Out Yet
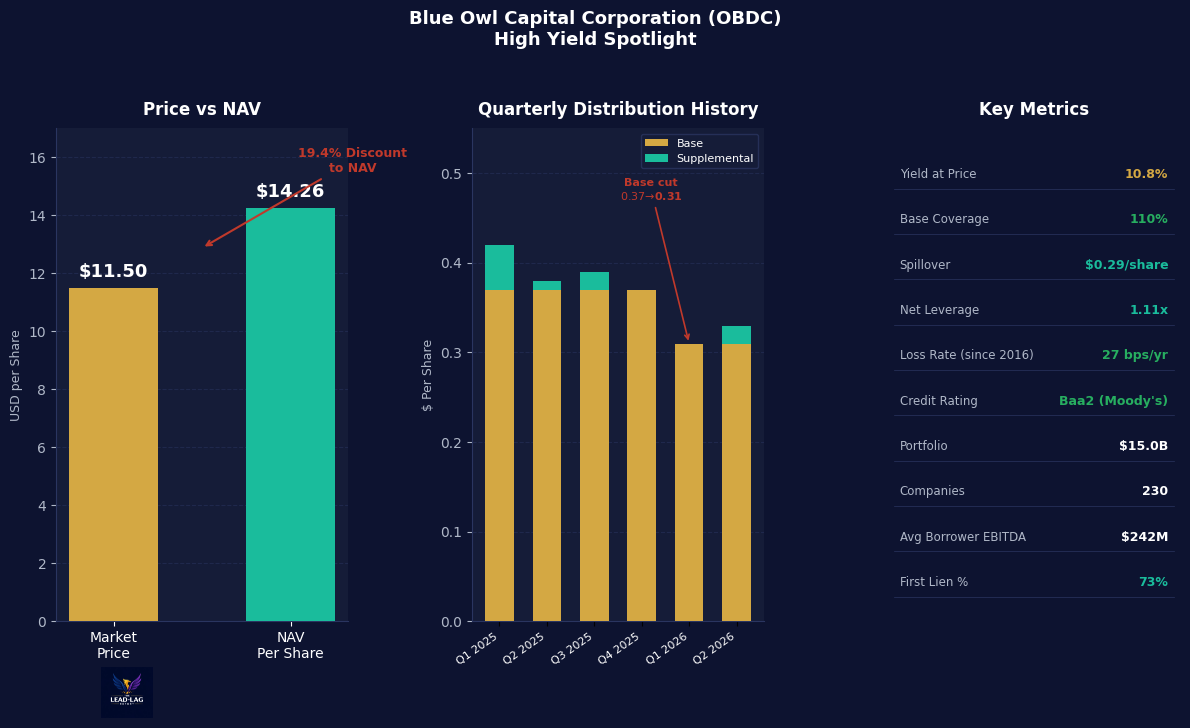
OBDC yields 10.8% and trades at a 19% discount to NAV of $14.26. Moody's Baa2 rated, 27bps annual net loss rate since 2016 inception, 110% base dividend coverage. The scale paradox: is a $15B BDC at a 19% discount a value play or a value trap?

Today's Lead-Lag Report post is sponsored by Evoke

The future is highly uncertain. Most investors are more exposed to stocks than they realize.
A traditional 60/40 portfolio is 98% correlated to the stock market, potentially exposing investors to more risk than they realize. The S&P 500 historically experienced extended periods of underperformance -- from 1966 to 1982 during inflationary times, a 0% average return from 1929 to 1949, and a lost decade prior to the recent 15-year bull market.
Risk parity seeks to offer a more diversified allocation than conventional mixes. By spreading risk across global equities, Treasuries, TIPS, and commodity producers and gold, investors can maintain a low-cost, tax-efficient passive mix seeking equity-like long-term expected returns with lower overall risk.
Learn more about the RPAR Risk Parity ETF at rparetf.com
DISCLAIMER — PLEASE READ: This is sponsored advertising content for which Lead-Lag Publishing, LLC has been paid a fee. The information provided in the link is solely the creation of Evoke Advisors. Lead-Lag Publishing, LLC does not guarantee the accuracy or completeness of the information provided in the link or make any representation as to its quality. All statements and expressions provided in the link are the sole opinion of Evoke Advisors and Lead-Lag Publishing, LLC expressly disclaims any responsibility for action taken in connection with the information provided in the link.
Before investing you should carefully consider the Fund's investment objectives, risks, charges, and expenses. This and other information is in the prospectus. Please read the prospectus carefully before you invest. Investing involves risk. Principal loss is possible. Distributed by Foreside Fund Services, LLC.
Every week, we'll profile a high yield investment fund that typically offers an annualized distribution of 6-10% or more. With the S&P 500 yielding less than 2%, many investors find it difficult to achieve the portfolio income necessary to meet their needs and goals. This report is designed to help address those concerns.

The BDC trilogy is complete. Over the past three weeks, this series profiled three very different businesses that all call themselves business development companies. HTGC (Run 24) lends to AI-era venture companies and the market rewards that positioning with a 43% premium to NAV. PFLT (Run 25) lends to middle-market businesses and trades at a 28% discount, its distribution was reset, and the numbers suggest the bad news is priced in. Now we arrive at the third one,Blue Owl Capital Corporation (OBDC), the one that by any institutional metric should trade closest to NAV and yet sits at a 19% discount.
The market's differentiation between these three lenders is one of the most interesting valuation puzzles in credit today. OBDC carries a Moody's Baa2 investment-grade rating, upgraded from Baa3 in January 2026 and shared by only a small group of publicly traded BDCs. It has run a 27 basis point annual net loss rate since its 2016 inception and owns a $15 billion portfolio of senior secured loans to upper-middle-market companies. Moody's cited nearly nine years of operating history with net loss rates well below middle-market lending norms when it made the change. Yet the stock trades at $11.50 against a NAV of $14.26. The discount is not explained by earnings. Adjusted NII of $0.34 per share in the second quarter covered the $0.31 base dividend at 110%. It is explained by something else.
That something else is a dividend cut. The base was $0.37 a quarter through the first quarter of 2026, a level set when SOFR was above 5%. As base rates fell and spreads compressed, the board reset the base to $0.31 for the second quarter, an approximate 16% reduction, and said explicitly that the new level aligned with the portfolio's go-forward earnings power. Income investors have long institutional memory on this point, and the memory does not distinguish between a cut made from strength and a cut made from distress. The discount widened from roughly 10% to 19% on that decision.
Which brings the comparison into focus. PFLT offers roughly 13% at a deeper discount against a smaller, more concentrated borrower pool that has already delivered a distribution reset after a period of undercoverage. OBDC offers 10.8% at a 19% discount against an investment-grade balance sheet, 230 borrowers, and 110% coverage on a base that has already been rebased lower. The higher headline yield is not the better risk-adjusted entry. OBDC is.
Fund Background
Blue Owl Capital Corporation, listed on the NYSE under OBDC, is a specialty finance company structured as a business development company and focused on direct lending to U.S. upper-middle-market companies with annual EBITDA between $25 million and $500 million. The mandate is deliberately unglamorous: senior secured loans to established, sponsor-backed businesses that generate real cash flow.
The company is externally managed by Blue Owl Credit Advisors LLC, part of the Blue Owl Capital platform (NYSE: OWL), which has deployed more than $118 billion in direct lending since inception. Scale is the point of this structure. It gives OBDC first look at large financings that smaller BDCs cannot underwrite, and it gives the credit team a selection funnel that most lenders cannot match. Blue Owl has evaluated more than 11,990 investment opportunities across the platform and closed on approximately 5% of them.
Moody's upgraded OBDC to Baa2 in January 2026, moving the outlook to stable from positive. The rating reflects ten years of disciplined underwriting, that 27 basis point annual net loss rate, and asset coverage that has consistently stayed above the regulatory floor with room to spare. OBDC generated 4.1% net income to average assets for the twelve months ended September 30, 2025, and held $3.0 billion in cash and undrawn committed capacity at the time of the upgrade.
The second quarter 2026 facts are straightforward. Price $11.50 against NAV of $14.26, a 19.4% discount. Portfolio of $15.0 billion at fair value across 230 companies and 30 industries. Net leverage of 1.11 times, the lowest in more than two years and inside the target range of 0.90 to 1.25 times.
Management has been deliberately shrinking the balance sheet and buying back stock rather than chasing origination volume into a tighter spread environment. New investment commitments were $319 million in the quarter against $747 million of sales and repayments. The company has repurchased approximately $220 million of its own shares since the fourth quarter of 2025, including $148 million in the fourth quarter at 86% of book value, the largest buyback in its history.
The borrower profile is the part most investors underweight. Average borrower EBITDA is $242 million and average loan-to-value across the portfolio is 47%. These are large, established businesses with substantial equity cushions beneath the debt, not the small companies that populated BDC portfolios in prior cycles and blew up when the cycle turned.
Portfolio Composition

The portfolio stood at $15.0 billion of fair value across 230 companies and 30 industries at the end of the second quarter. Seventy-nine percent is senior secured and 73% is first lien, which places OBDC at the top of the capital structure in the overwhelming majority of its positions. Ninety-six percent of the book floats, tied to SOFR plus an average spread of 5.6%, and the resulting portfolio yield is 9.9%, down from prior quarters as base rates fell.
Sector exposure is led by software and technology at 17.1%, healthcare at 12.8%, financial services at 9.4%, and aerospace and defense at 7.2%. No single industry represents more than 17% of the portfolio. That is genuine diversification rather than the marketing version of it, and it is the direct consequence of running $15 billion instead of $1.5 billion.
Non-accruals sit at 2.8% at cost and 0.8% at fair value. That gap is the most important number in this section. It means Blue Owl has already marked the troubled credits down to roughly 28 cents on the dollar. The write-down has happened. It is in the NAV you are buying at a 19% discount. The ongoing impairment to income from non-performing loans is 0.8% of fair value, which on a $15 billion portfolio of first lien paper is a rounding error rather than a thesis breaker.
The second quarter NAV decline was itself a single-name event. Management attributed it primarily to a write-down on Loparex, one credit in a book of 230. Broader portfolio metrics were stable. That is what diversification at scale buys you: idiosyncratic credit problems that show up as pennies rather than dollars.
Performance Analysis

NAV has declined from roughly $15.55 in the first quarter of 2024 to $14.26 today, an erosion of $1.29 per share over two years. The drivers are identifiable and mostly mechanical. Falling base rates, with SOFR down from 5.3% in mid-2024, compressed spread income across a 96% floating rate book, and markdowns on a small number of individual credits took the rest. The trajectory through 2025 and 2026 is visible in the reported sequence: $14.89 at September 30, 2025, then $14.81, then $14.41, then $14.26.
The second quarter move was $0.15 per share, from $14.41 to $14.26, driven by markdowns on a small number of names and partially offset by over-earning the dividend and by $0.03 per share of accretion from $35 million of share repurchases below NAV. The buyback program is not symbolic. Approximately $220 million of repurchases since the fourth quarter of 2025, executed at meaningful discounts to book, is a real commitment of shareholder capital to compressing the discount, and it has added measurable NAV per share in each quarter it has been used.
Earnings quality held up better than the NAV line suggests. Second quarter adjusted NII was $0.34 per share, up from $0.31 in the first quarter, and GAAP NII was $0.36. Total investment income was $401.3 million and adjusted net investment income was $170.6 million. Annualized return on equity improved to 9.6%, more than 100 basis points above the prior quarter. Some of that improvement came from the full repayment of the Mavis Tire investment and from higher dividend income out of the specialty finance vehicle, so the run rate is lower than $0.34.
Base dividend coverage for the quarter was 110%. Behind that sits approximately $0.29 per share of spillover income, undistributed taxable income carried forward that functions as a distribution reserve. Against a $1.24 annualized base, that buffer gives the board multiple quarters of protection even if NII moderates back toward $0.31.
Macro Environment

The rate cycle is the whole context here, and it is worth being precise about what it did. The $0.37 quarterly base was set when SOFR was 5.3%. When base rates came down and spreads compressed, that payout stopped matching the portfolio's earnings power, and the board reset it to $0.31 rather than fund the gap out of the balance sheet. Management said as much on the first quarter call, framing the reset as the appropriate level given forward earnings power with spreads widening and the rate environment stabilizing. The market's response was to widen the NAV discount from roughly 10% to 19%.
Look at what the reset actually produced. The fundamentals behind the new $0.31 base are stronger than the fundamentals behind the old $0.37 base. NII coverage is now 110% against roughly 100% before. Net leverage has come down to 1.11 times from 1.19 times and 1.13 times in the two prior quarters. Approximately $220 million of stock has been retired below book value. The portfolio has been de-risked, the payout has been right-sized, and the price is 19% lower relative to assets than it was when the payout was arguably overextended. The market punished the correct decision.
Here is the comparison that should bother anyone who thinks credit markets are efficient. A Baa2-rated credit institution with $15 billion of diversified, predominantly first lien loans, 27 basis points of historical annual losses, 110% dividend coverage, and $0.29 per share of spillover trades at a 19% discount to the audited value of its assets. Investment-grade corporate bond ETFs holding paper with the same rating, at roughly half the yield, trade at or within pennies of net asset value every single day. The difference is not credit. It is structure. The closed-end BDC wrapper has no arbitrage mechanism, so sentiment sets the price and it can stay wrong for a long time. That inefficiency is real and persistent, and at some point the size of the discount is itself the thesis.
The bear case deserves respect, because it is arithmetic rather than opinion. With 96% of a $15 billion portfolio floating, every 25 basis point cut in base rates reduces annualized investment income by roughly $30 million to $40 million before any offset from lower borrowing costs. Two more cuts take a meaningful bite out of the cushion above the $0.31 base, and the supplemental is the first thing to go. If the Fed keeps easing, OBDC earns less, and the honest version of the bull case is that the current price already assumes that happens. It does. A 19% discount on an investment-grade lender is the market pricing several quarters of earnings compression as a certainty rather than a risk.
Distribution Policy
The center panel of the stats chart shows the distribution profile. The quarterly base dividend is $0.31 per share, with the third quarter 2026 base declared on August 4, 2026 for stockholders of record as of September 30, 2026 and payable on or before October 15, 2026. The second quarter supplemental of $0.02 per share goes to holders of record August 31, 2026 and is payable on or before September 15, 2026, bringing total second quarter dividends declared to $0.33 per share.
The base annualizes to $1.24 per share, which at $11.50 is a 10.8% yield. Add the supplemental at the current run rate and the total moves higher, but the base is the number to underwrite. The supplemental framework pays out 50% of NII above the base, which creates a variable component that rises and falls with the rate environment and with non-recurring income such as the Mavis Tire realization that lifted the second quarter. Treat $1.24 as the durable payout and the supplemental as a participation in upside quarters.
The cut from $0.37 to $0.31 has to be addressed directly rather than explained away. It was a 16% reduction in the base and it was the right call. The prior level was set in a materially higher rate environment, and rather than maintain an unsustainable payout by leaning on spillover or leverage, the board proactively reset the base to match the portfolio's forward earnings power.
The contrast with PFLT is instructive. PFLT cut its monthly distribution from $0.1025 to $0.08 after a sustained period of undercoverage, which is a cut made because the math forced it. OBDC cut while still covering its dividend, and the new base is supported by 110% coverage plus a $0.29 per share reserve. Both are dividend cuts on a screen. They are categorically different events in reality, and the market has not yet finished making that distinction.
Advantages
Scale and institutional credit discipline have produced a loss record that is genuinely exceptional. Twenty-seven basis points of annual net losses over ten years, across a platform that has deployed more than $118 billion, is not a marketing claim. It is audited performance through the COVID shutdown, the 2022 rate shock, and the 2025 credit stress that pushed non-accruals higher across the middle market. Moody's reviewed that record and upgraded the entity to Baa2, placing OBDC in the small group of investment-grade publicly traded BDCs. A 5% acceptance rate on nearly 12,000 evaluated opportunities is the mechanism behind the result, and it is not replicable at a smaller BDC that has to fund what it is shown rather than what it wants.
The buyback program actively compresses the discount and is accretive to NAV, which gives this position a second return mechanism beyond the coupon. Approximately $220 million of repurchases since the fourth quarter of 2025 at prices well below book has added $0.03 to $0.05 per share to NAV per quarter, including $0.05 in the fourth quarter of 2025 and $0.03 in the second quarter of 2026. Every share retired at 81 cents on the dollar transfers value to the shares that remain. If management continues repurchasing and the discount narrows even partially, NAV per share grows without a single dollar of new investment income.
Diversification at this scale is something no other publicly traded BDC matches. Two hundred thirty companies across 30 industries, with no sector above 17% and average borrower EBITDA of $242 million, changes the shape of the risk. In a BDC with 50 to 80 borrowers, one credit event moves NAV by 50 to 100 basis points and the stock reprices immediately. In OBDC, a single credit event moves NAV by 5 to 10 basis points. The Loparex markdown this quarter is the proof: the largest negative event in the portfolio cost $0.15 per share on a $14.41 base, and the rest of the book was stable.
Disadvantages
NAV has been declining for eight consecutive quarters and there is no catalyst on the immediate horizon to reverse it. From roughly $15.55 in the first quarter of 2024 to $14.26 today, the erosion is modest in percentage terms but it is directionally consistent, and consistency is what investors extrapolate. In a falling rate environment, the 9.9% portfolio yield continues to compress unless spreads widen enough to offset the base rate decline. Buying an asset whose book value has fallen every quarter for two years requires a view that the trend flattens, and nothing in the current rate path guarantees it.
The base dividend was cut and the market has not forgotten. When a BDC reduces its distribution, even rationally and from a position of coverage, retail income investors rotate out and they do not come back on the next earnings call. The stock has underperformed MAIN, ARCC, and BXSL since the announcement, and it trades near the low end of a 52-week range of $10.52 to $14.53. Rebuilding income investor confidence is a multi-quarter process measured in dividend declarations, not press releases, and the discount can persist or widen before it narrows.
External management creates a structural misalignment of interests that no rating agency addresses. Blue Owl Credit Advisors earns a base management fee on gross assets of roughly 1.5% plus an incentive fee on returns. In a declining NAV environment where management is simultaneously repurchasing stock, that structure creates real tension. Deploying capital into new assets grows the fee base. Retiring shares at 81% of book shrinks it while producing the higher return for shareholders. Total expenses fell 15.9% year over year in the second quarter on lower interest expense and management fees, so the alignment has held so far. Whether it continues to hold once the origination environment improves is the question, and the answer determines whether NAV per share or fee income gets optimized.
Final Thoughts
OBDC is not a broken company at a distressed price. It is an institutionally run, investment-grade-rated, $15 billion direct lending platform trading at a 19% discount to the audited value of its assets. The case for owning it is not that the macro environment is perfect for BDCs, because it is not. Falling rates compress floating rate income, and 96% of this book floats. The case is that the discount already prices multiple quarters of earnings compression, a further easing cycle, and the market's residual memory of the dividend reset, all as if each were already fact.
The comparison that matters most is not OBDC against HTGC or OBDC against PFLT. It is OBDC against itself in six to twelve months. Management is buying back stock aggressively at a discount that makes every repurchase accretive. The spillover buffer is $0.29 per share. The base is covered at 110% with net leverage at a two-year low. If the macro environment stabilizes and the market's memory of the reset fades, the discount has a credible path from 19% toward 10% to 12%, which is where this name traded before the cut. That move alone produces a 7% to 9% price return on top of a 10.8% income yield, and it requires nothing more than the absence of new bad news.
For advisors and income-focused investors, OBDC is the most institutional option in the BDC space at a yield that still justifies the complexity premium of owning a levered, externally managed credit vehicle. The risks are real and I am not discounting them. Rate cuts will compress income at roughly $30 million to $40 million of annualized NII per 25 basis points. NAV is trending down and has been for eight quarters. External management is never the same as internal alignment, and the incentive fee will always create a pull toward asset growth over per-share value.
But at $11.50 against a $14.26 NAV, you are buying a well-run institution at a price that already assumes something is wrong. The non-accruals are marked at 28 cents on the dollar, the payout has been rebased to a level the portfolio actually earns, and Moody's just upgraded the balance sheet. Whether the something turns out to be as bad as the discount implies is the bet, and I would take the other side of it here.
---
The Lead-Lag Report is provided by Lead-Lag Publishing, LLC. All opinions and views mentioned in this report constitute our judgments as of the date of writing and are subject to change at any time. Information within this material is not intended to be used as a primary basis for investment decisions and should also not be construed as advice meeting the particular investment needs of any individual investor. Trading signals produced by the Lead-Lag Report are independent of other services provided by Lead-Lag Publishing, LLC or its affiliates, and positioning of accounts under their management may differ. Please remember that investing involves risk, including loss of principal, and past performance may not be indicative of future results. Lead-Lag Publishing, LLC, its members, officers, directors and employees expressly disclaim all liability in respect to actions taken based on any or all of the information on this writing.



