
The Curve Healed. The Handoff Did Not.
A positive slope is a funding condition, not proof that growth has absorbed the baton. The August 2026 curve is positive again, but the payroll and credit data have not yet confirmed the handoff.

Today’s Lead-Lag Report post is sponsored by Tuttle Capital

The Tuttle Capital Concentrated Memory Stack ETF (HBMX) is a high-conviction, actively managed portfolio of roughly 20–35 companies across the memory semiconductor ecosystem: DRAM and NAND manufacturers, high-bandwidth memory producers, advanced packaging specialists, and the testing and equipment names that enable them all.
A company qualifies for the portfolio if it derives at least 25% of revenue from memory-related products or services — deliberately broader than certain narrower single-theme approaches, so the fund can capture equipment makers and packaging specialists alongside the pure chipmakers. No pre-revenue or development-stage holdings are permitted. Launched June 2, 2026 on Cboe. Learn more at hbmxetf.com.
Investors should carefully consider the investment objectives, risks, charges, and expenses of the Tuttle Capital Concentrated Memory Stack ETF (HBMX) before investing. For a prospectus with this and other information about the Fund, please visit hbmxetf.com or call (833) 759-6110. Please read the prospectus carefully before investing.
An investment in the Fund involves risk, including possible loss of principal. The Fund is non-diversified, which means it may invest a relatively high percentage of its assets in a smaller number of issuers than a diversified fund. As a result, the Fund's performance may be more volatile and may be more susceptible to risks associated with a single economic, political, or regulatory occurrence than a diversified fund. The Fund is subject to Semiconductor and Technology Industry Risk, Memory Semiconductor Risk (DRAM/NAND/HBM), Advanced Packaging and OSAT Risk, Concentration Risk, Active Management Risk, Cyber Security Risk, ETF Structure Risk, Non-U.S. Investments Risk, Emerging Markets Risk, Non-Diversification Risk, and New Fund Risk, among others. ETF shares may trade at a premium or discount to NAV.
The Fund is distributed by Foreside Fund Services, LLC.
DISCLAIMER – PLEASE READ: This is sponsored advertising content for which Lead-Lag Publishing, LLC has been paid a fee. The information provided in the link is solely the creation of Tuttle Capital Management. Lead-Lag Publishing, LLC does not guarantee the accuracy or completeness of the information provided in the link or make any representation as to its quality. All statements and expressions provided in the link are the sole opinion of Tuttle Capital Management, and Lead-Lag Publishing, LLC expressly disclaims any responsibility for action taken in connection with the information provided in the link.
KEY HIGHLIGHTS
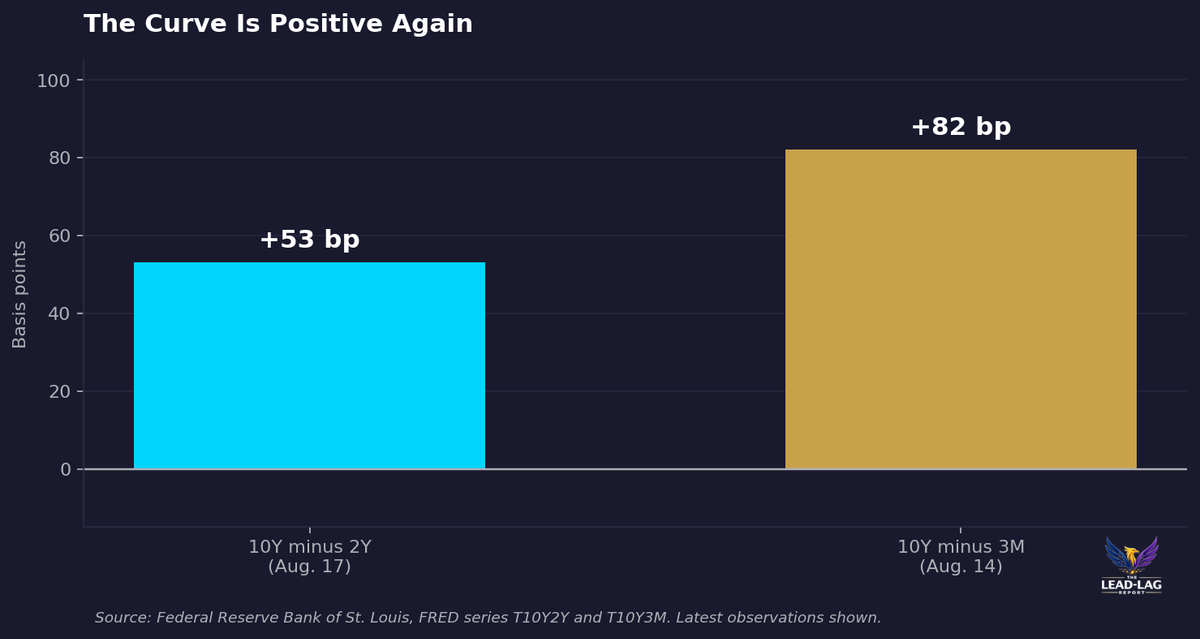
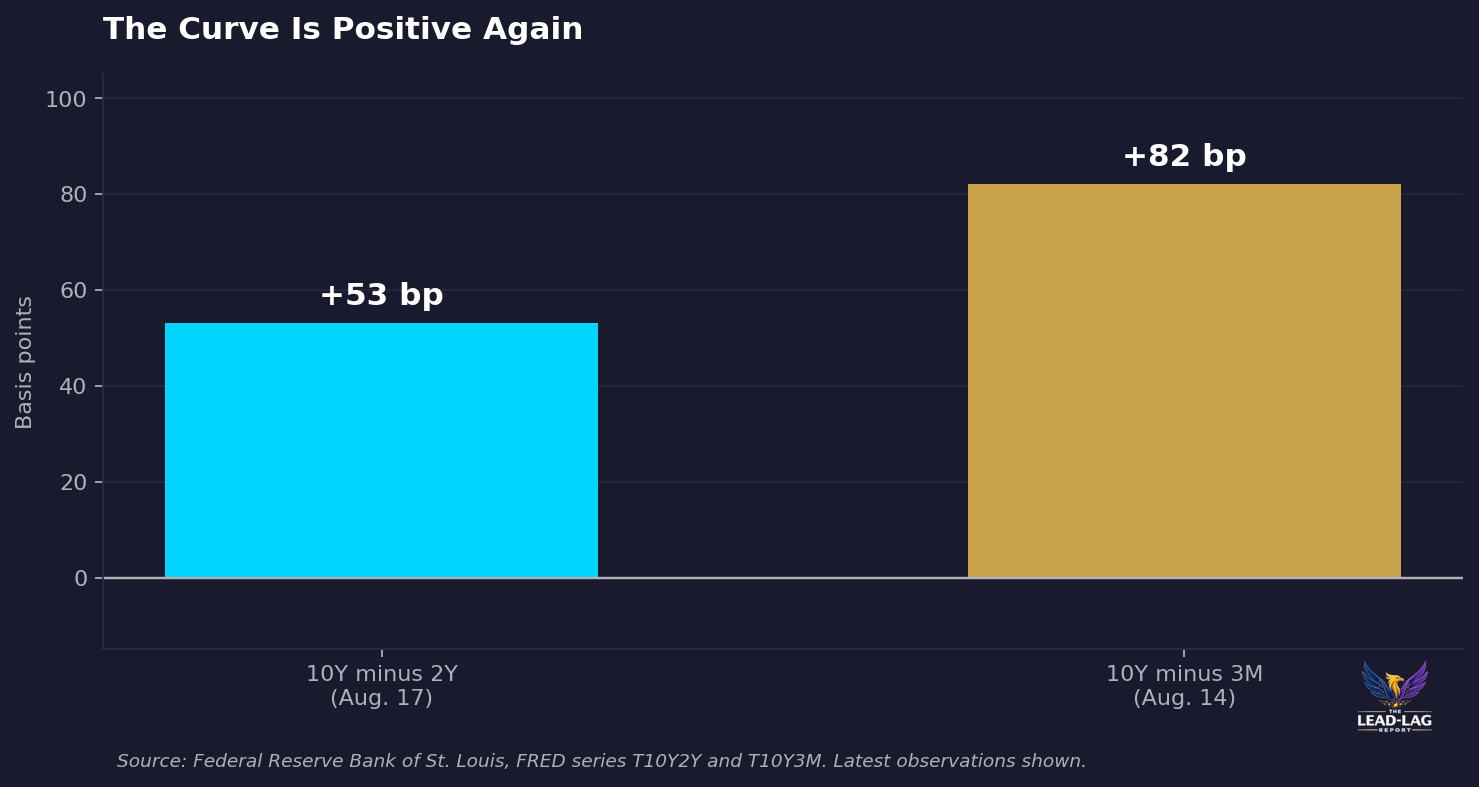
• The 10-year minus 2-year Treasury spread was +53 basis points on August 17 and the 10-year minus 3-month spread was +82 basis points on August 14. The curve is no longer inverted. [1]
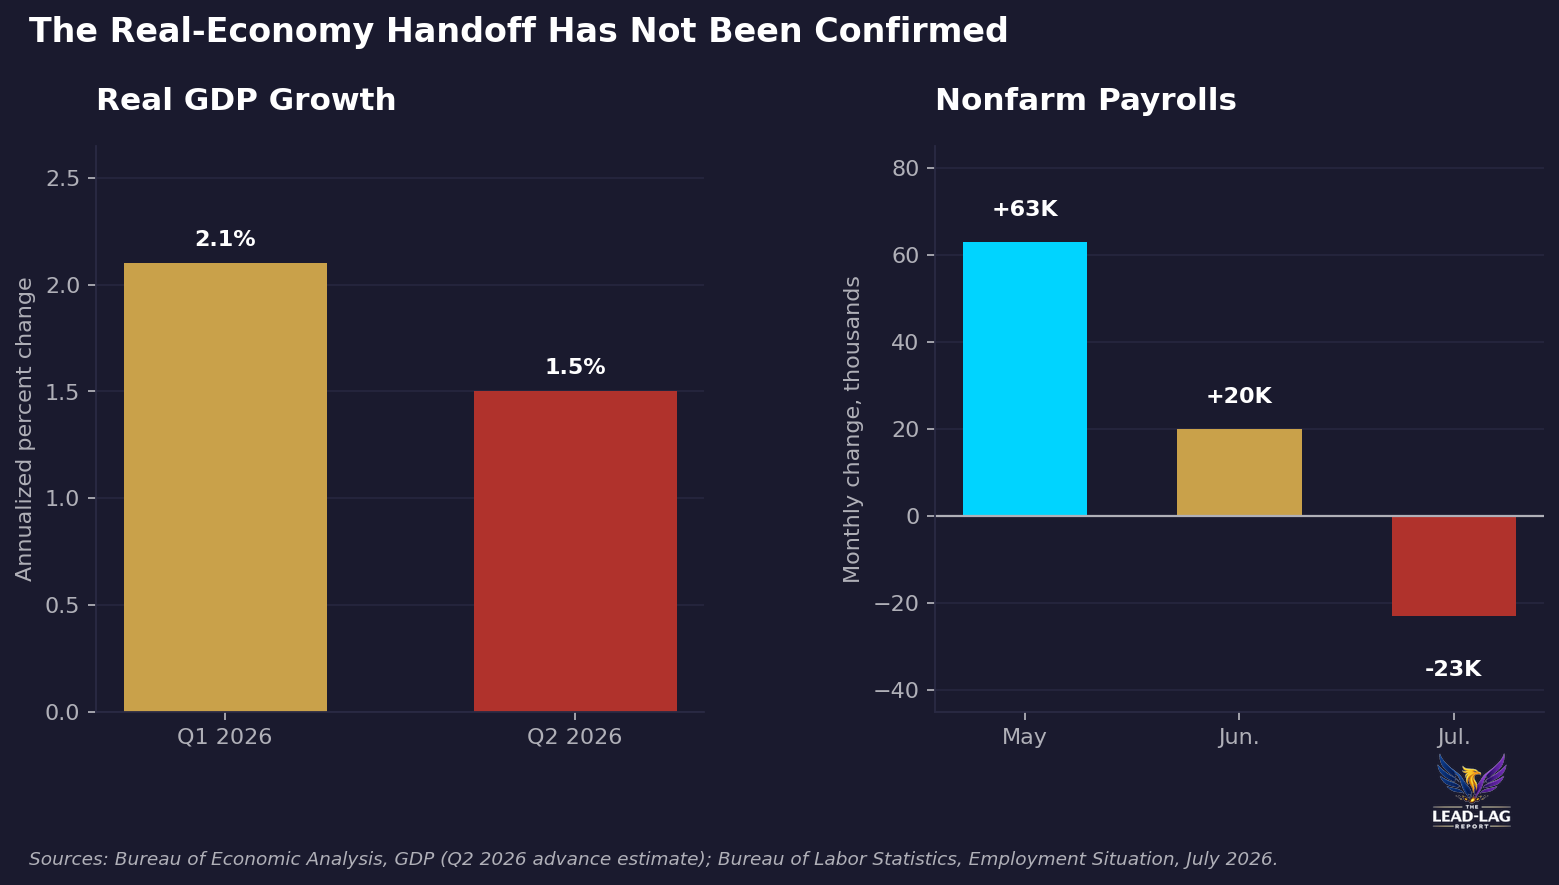
• The better question is whether the slope has reached the real economy. Real GDP slowed from a 2.1% annualized pace in the first quarter to 1.5% in the second, while July payrolls declined 23,000. [2][3]
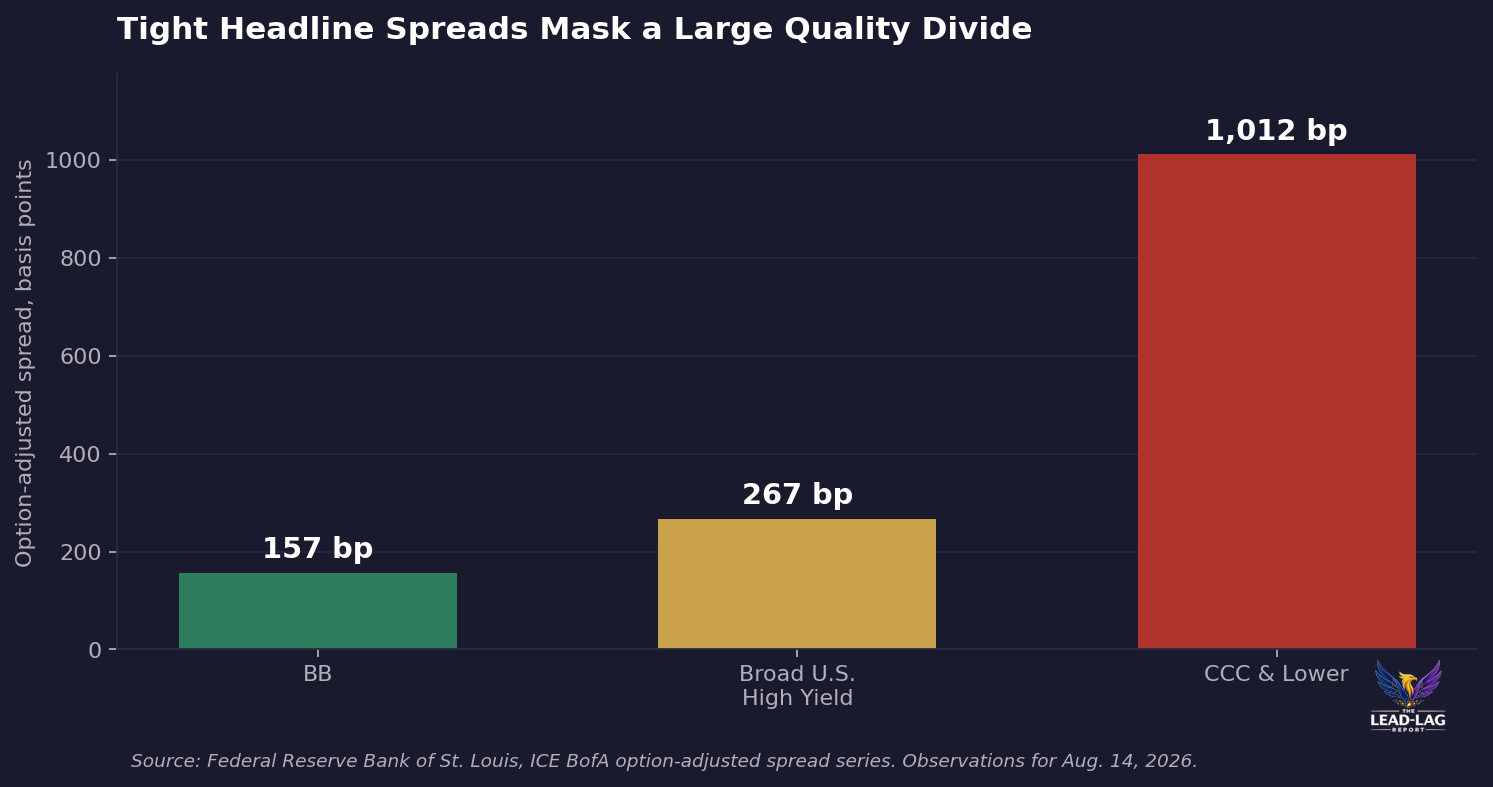
• Credit is not signaling a broad stress event: the ICE BofA U.S. High Yield OAS was 267 basis points. But CCC and lower-rated spreads stood at 1,012 basis points, a reminder that a calm aggregate can conceal a selective market. [4]
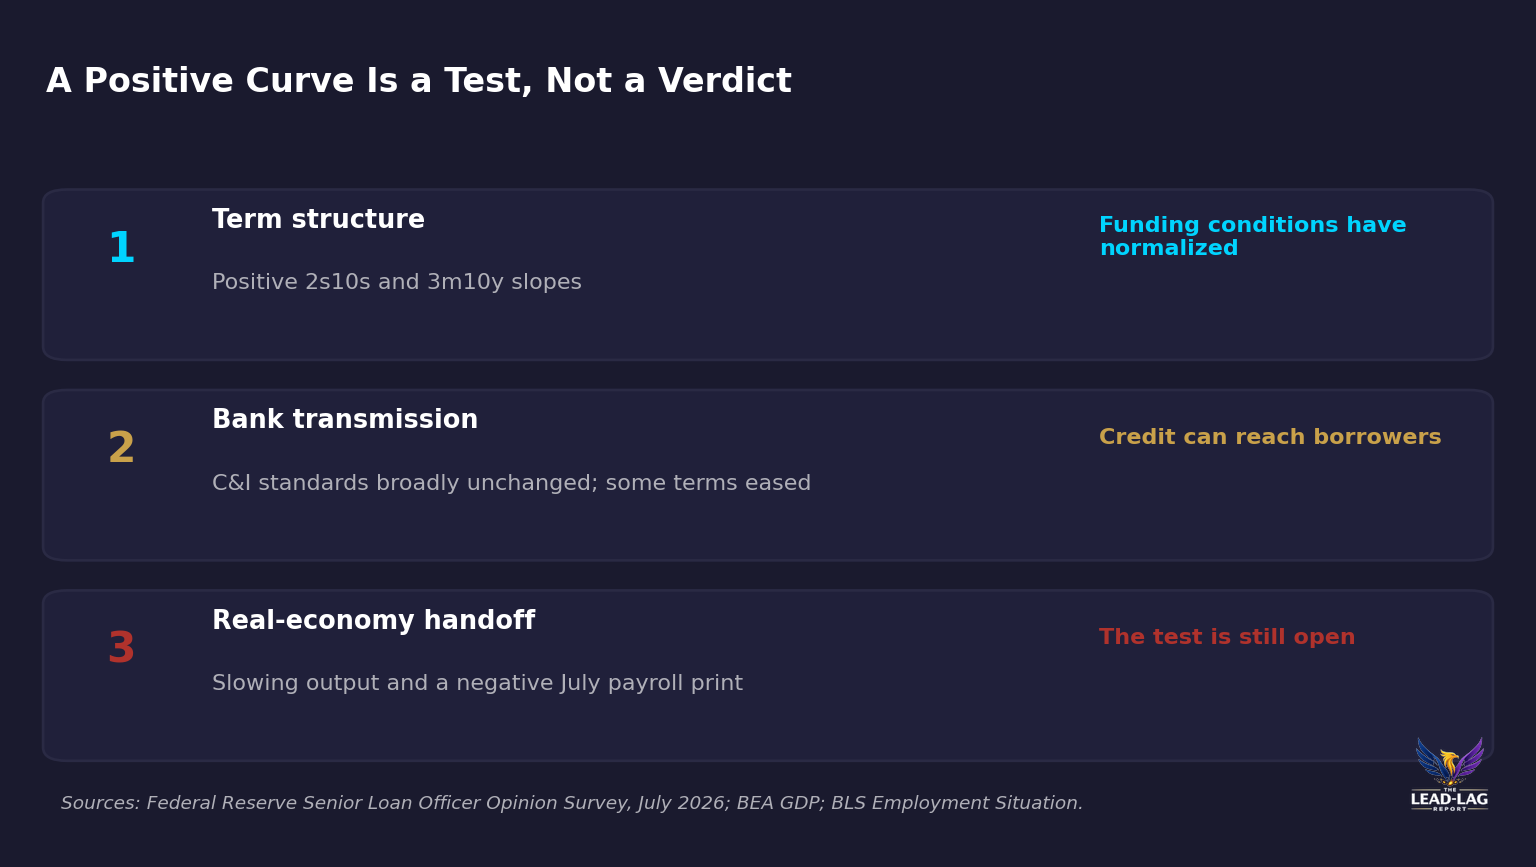
• The July Senior Loan Officer Opinion Survey offers a credible constructive case: C&I standards were broadly unchanged and some terms eased. The new test is whether that transmission becomes durable hiring and output. [5]
The first article on this theme made a simple historical point: the dangerous part of an inversion cycle is often the interval after the curve turns back up. That remains true as a calendar observation. But it is not the most useful question now. A second piece should not repeat the warning and call it analysis. The fresh question is more demanding: what, exactly, is the newly positive curve handing off to?
The market has a habit of treating a positive yield curve as a completed diagnosis. Short rates are below long rates, therefore monetary restraint has lifted, therefore credit will flow, therefore growth is safe. That sequence is tidy. It is also incomplete. A curve is a price relationship. It can improve the economics of maturity transformation and help banks extend credit. It cannot by itself create demand, preserve payrolls, or turn an uneven credit market into broad income growth.
That distinction matters in August 2026. The two headline slopes are positive again. The 10-year minus 2-year spread was +53 basis points on August 17, while the 10-year minus 3-month spread was +82 basis points on August 14.[1] Those are real improvements from inversion. They are not, by themselves, proof that the economic handoff has occurred.
A Slope Is a Funding Signal
This is the point that gets lost when the curve is used as a headline rather than a mechanism. Banks fund at short maturities and lend at longer maturities. A steeper curve can raise the expected return to maturity transformation. Federal Reserve research on term premium and bank lending finds that a higher term premium can increase those expected returns, encourage lending, and support investment and output.[6] That is the steelman case for the current shape of the curve, and it deserves to be taken seriously.
The July Senior Loan Officer Opinion Survey gives that steelman some support. Banks reported C&I standards that were broadly unchanged in the second quarter, with easing on some loan terms. Demand strengthened for loans to large and middle-market firms while demand from small firms was unchanged.[5] This is not the credit chokehold that an inverted curve narrative would imply. It is a plausible starting point for a healthier transmission channel.
But a plausible transmission channel is not an observed macro outcome. The Fed's own research describes a pathway: term premium, bank incentives, lending, investment, growth. Each arrow in that sequence must occur. Treating the first arrow as confirmation of the last is the analytical error. It confuses improved conditions for intermediation with proof that the private sector has taken the financing and turned it into a durable expansion.
The older New York Fed work on the curve is useful here precisely because it was narrower. Its message was that the 10-year minus 3-month spread had predictive content for recession risk at horizons of roughly two to six quarters, not that a single positive reading certified a recovery.[7] Predictive content is valuable. It is not a permission slip to stop checking the downstream data.
The Handoff Is the Missing Confirmation
The downstream data are mixed enough to make that distinction consequential. The Bureau of Economic Analysis reported that real GDP grew at a 1.5% annualized rate in the second quarter, down from a 2.1% pace in the first quarter.[2] Private domestic final sales were stronger than the headline, which is the constructive interpretation. But headline output still decelerated rather than accelerating into the curve's normalization.
The labor side is more uncomfortable. The Bureau of Labor Statistics reported a 23,000 decline in nonfarm payroll employment in July after gains of 20,000 in June and 63,000 in May. The unemployment rate was 4.1%, and average hourly earnings were up 3.2% over twelve months.[3] One month is not a cycle. It is, however, a direct warning against declaring that a positive slope has already become a broad hiring impulse.
The constructive case has evidence too. ISM's manufacturing PMI rose to 55.6 in July from 53.3 in June, its highest reading since May 2022; the employment index moved into expansion at 52.8.[8] That is why this is a test rather than a prediction of an inevitable break. Manufacturing surveys, bank terms, and the curve can all be early components of a more durable rebound. The question is whether they reach the payroll and output data before a soft patch becomes something larger.
Credit Is Calm, but It Is Not Uniform
The first piece emphasized the historical post-un-inversion danger window for credit stress. This piece is deliberately different. It starts with the evidence against a broad, imminent credit event. The ICE BofA U.S. High Yield OAS was 267 basis points on August 14. The BB component was 157 basis points.[4] Those are not levels that say the market expects a generalized refinancing shutdown.
Yet the same credit data contain a more useful nuance than the headline spread. The CCC and lower-rated OAS was 1,012 basis points on the same date.[4] That gap does not predict a recession on its own. It does say the market is discriminating sharply between borrowers with resilient financing capacity and those without it. A positive curve may improve the system's ability to lend while leaving the most fragile income statements outside the recovery narrative.
This is the contrarian framing consensus misses. The relevant comparison is not a healthy curve versus an inverted curve. It is a healthy curve with broad, self-sustaining credit transmission versus a healthy curve that merely sorts borrowers more efficiently. The latter can coexist with benign aggregate spreads, stronger activity in large firms, and a labor market that has not yet absorbed the benefit.
The Curve Gets a Second Chance
There is a reason not to overstate the case. A positive slope, less restrictive bank terms, a rising manufacturing PMI, and contained broad high-yield spreads are a coherent constructive cluster. The curve does not have to replay the history of every prior cycle. Fiscal support, the resilience of larger corporate borrowers, and the ability of banks to preserve credit supply could make this handoff stronger than the payroll data currently suggest.
But that is a forward proposition, not a fact already embedded in the slope. The positive curve has earned a second chance to work through the banking system. It has not earned an all-clear. For that, the data need to show an observable sequence: payroll growth reaccelerates, output growth responds, and credit remains available beyond the strongest borrowers. Until then, the curve is signaling improved potential, not completed repair.
A Clear Falsification Test
The thesis is invalidated if, by the October 2026 employment and GDP releases, payroll employment averages at least 150,000 per month for August and September, real GDP growth is revised or reported at 2.5 percent or more for the third quarter, and the ICE BofA U.S. High Yield OAS remains at or below 300 basis points.[9] That combination would show that the curve's improved funding condition became broad labor-and-output confirmation without a material deterioration in credit pricing. The handoff would no longer be missing.
The point is not to insist that the curve must fail. It is to require it to do the work the all-clear narrative assumes it has already done. A repaired slope matters. A repaired transmission mechanism matters more.
The curve healed. The handoff did not. Watch the handoff.
Few understand this.
— — —
Notes
[1] Federal Reserve Bank of St. Louis, FRED, Treasury Yield 10 Years minus 2 Years (T10Y2Y), observation for August 17, 2026; and 10-Year Treasury Constant Maturity Minus 3-Month Treasury Constant Maturity (T10Y3M), observation for August 14, 2026. https://fred.stlouisfed.org/series/T10Y2Y and https://fred.stlouisfed.org/series/T10Y3M
[2] Bureau of Economic Analysis, Gross Domestic Product, Second Quarter 2026 (Advance Estimate), released July 30, 2026. Real GDP increased at a 1.5 percent annual rate in Q2 after increasing 2.1 percent in Q1. https://www.bea.gov/news/2026/gdp-advance-estimate-2nd-quarter-2026
[3] U.S. Bureau of Labor Statistics, The Employment Situation — July 2026, released August 7, 2026. Nonfarm payroll employment decreased by 23,000 in July after increases of 20,000 in June and 63,000 in May; unemployment rate 4.1 percent; average hourly earnings up 3.2 percent over 12 months. https://www.bls.gov/news.release/empsit.nr0.htm
[4] Federal Reserve Bank of St. Louis, FRED, ICE BofA US High Yield Index Option-Adjusted Spread (BAMLH0A0HYM2), ICE BofA BB US High Yield Index Option-Adjusted Spread (BAMLH0A1HYBB), and ICE BofA CCC & Lower US High Yield Index Option-Adjusted Spread (BAMLH0A3HYC), observations for August 14, 2026. https://fred.stlouisfed.org/series/BAMLH0A0HYM2 ; https://fred.stlouisfed.org/series/BAMLH0A1HYBB ; https://fred.stlouisfed.org/series/BAMLH0A3HYC
[5] Board of Governors of the Federal Reserve System, Senior Loan Officer Opinion Survey on Bank Lending Practices, July 2026. The survey reports broadly unchanged standards for C&I loans in the second quarter, with easing on some terms and stronger demand from large and middle-market firms. https://www.federalreserve.gov/data/sloos/sloos-202607.htm
[6] Federal Reserve FEDS research, “Why Does the Yield Curve Predict GDP Growth? The Role of Banks,” discusses how higher term premia increase expected maturity-transformation returns and can encourage bank lending, investment, and growth. https://www.federalreserve.gov/econres/feds/why-does-the-yield-curve-predict-gdp-growth-the-role-of-banks.htm
[7] Arturo Estrella and Frederic S. Mishkin, The Yield Curve as a Predictor of U.S. Recessions, Federal Reserve Bank of New York Current Issues in Economics and Finance. The article describes the 10-year minus 3-month spread as a valuable predictor at horizons of two to six quarters. https://www.newyorkfed.org/medialibrary/media/research/current_issues/ci2-7.html
[8] Institute for Supply Management, July 2026 Manufacturing ISM Report On Business. The PMI registered 55.6 percent, up from 53.3 percent in June; the employment index registered 52.8 percent. https://www.ismworld.org/supply-management-news-and-reports/reports/ism-pmi-reports/pmi/july/
[9] Falsification thresholds use the Bureau of Labor Statistics Employment Situation, the Bureau of Economic Analysis GDP release, and the FRED ICE BofA US High Yield OAS series cited in notes [2], [3], and [4].
The Lead-Lag Report is provided by Lead-Lag Publishing, LLC. All opinions and views mentioned in this report constitute our judgments as of the date of writing and are subject to change at any time. Information within this material is not intended to be used as a primary basis for investment decisions and should also not be construed as advice meeting the particular investment needs of any individual investor. Trading signals produced by the Lead-Lag Report are independent of other services provided by Lead-Lag Publishing, LLC or its affiliates, and positioning of accounts under their management may differ. Please remember that investing involves risk, including loss of principal, and past performance may not be indicative of future results. Lead-Lag Publishing, LLC, its members, officers, directors and employees expressly disclaim all liability in respect to actions taken based on any or all of the information on this writing.



