The Fed Is Hiking Into a Credit Boom. Business Loans Are Up 10%.
Business loans are growing 10% a year, the fastest since March 2023, while banks have stopped tightening and the Fed raises rates. Two readings of the same number.

Free for advisors today: Prospect Call Prep Brief

Walk into the next conversation with a plan. Give us the context and your desired outcome. Get likely planning themes, questions to ask, positioning notes and a soft next step, in about one to two business days.
What you receive
- Prospect context summary
- Likely planning themes
- Questions to ask
- Advisor positioning notes
- Soft CTA options
Cost in credits: 1. Turnaround: 1-2 business days. Delivered as: an AI-prepared draft that you review. Best for: Advisors preparing for a prospect, referral partner or new-client call.
It is free for advisors. There is no invoice from us. You earn the credits by showing up: attend a sponsored Lead-Lag Media webinar, meet a fund issuer in a one-on-one introduction, or join one of our advisor dinners.
Prefer to browse first? See all 34 services at advisor.leadlagmedia.com.
Credits carry no cash value and are not payment for services. Drafts are prepared with AI assistance and are for your and your firm’s review before use; they are not investment, legal, tax or compliance advice, and nothing is guaranteed. Services are offered to financial advisors and are not a solicitation to retail investors.
Business loans are up 10% in a year, the fastest since March 2023. Banks stopped tightening standards, the money supply is growing again, and the Fed is raising rates anyway.
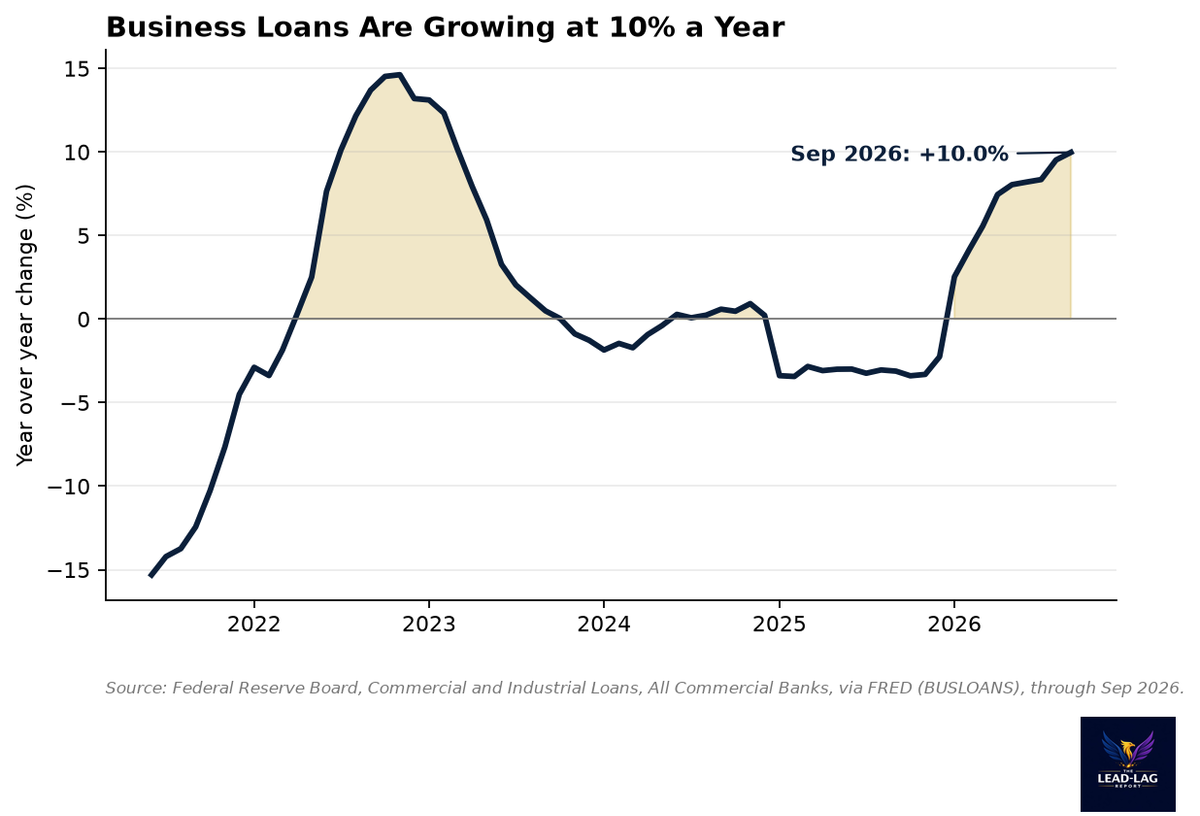
Commercial and industrial loans at U.S. banks reached $2.96 trillion in September. That is $268 billion more than a year ago, a gain of 9.98%, and it is the fastest annual growth since March 2023.[1]
A year ago the same series was shrinking. It bottomed at $2.66 trillion in April 2025, and by December 2025 it had only recovered to $2.71 trillion.[1] Since then it has grown about 9% in nine months, a pace of roughly 12.5% a year. That is a turn, not a drift.
The Fed raised its policy rate in September for the first time since 2023. Credit is accelerating into that hike. This piece is about the gap between those two facts.
Banks stopped saying no
Loan growth needs two parties. Companies have to want the money, and banks have to be willing to lend it. The Fed's Senior Loan Officer survey measures the second part, and it has changed.
The survey asks banks whether they tightened or eased standards on commercial loans to large and mid-sized firms. In July 2023 the net share tightening reached 50.8%, the peak of the post-2022 squeeze. In the July 2026 survey it was 0.0%, meaning as many banks eased as tightened.[2] The April 2026 reading was 8.1%, and the January reading was 5.3%.[2]
This matters because credit cycles are usually decided by supply. When banks are tightening, growth in lending slows no matter how much borrowers want. When banks stop tightening, demand can show up in the numbers. That is what we see in chart one.
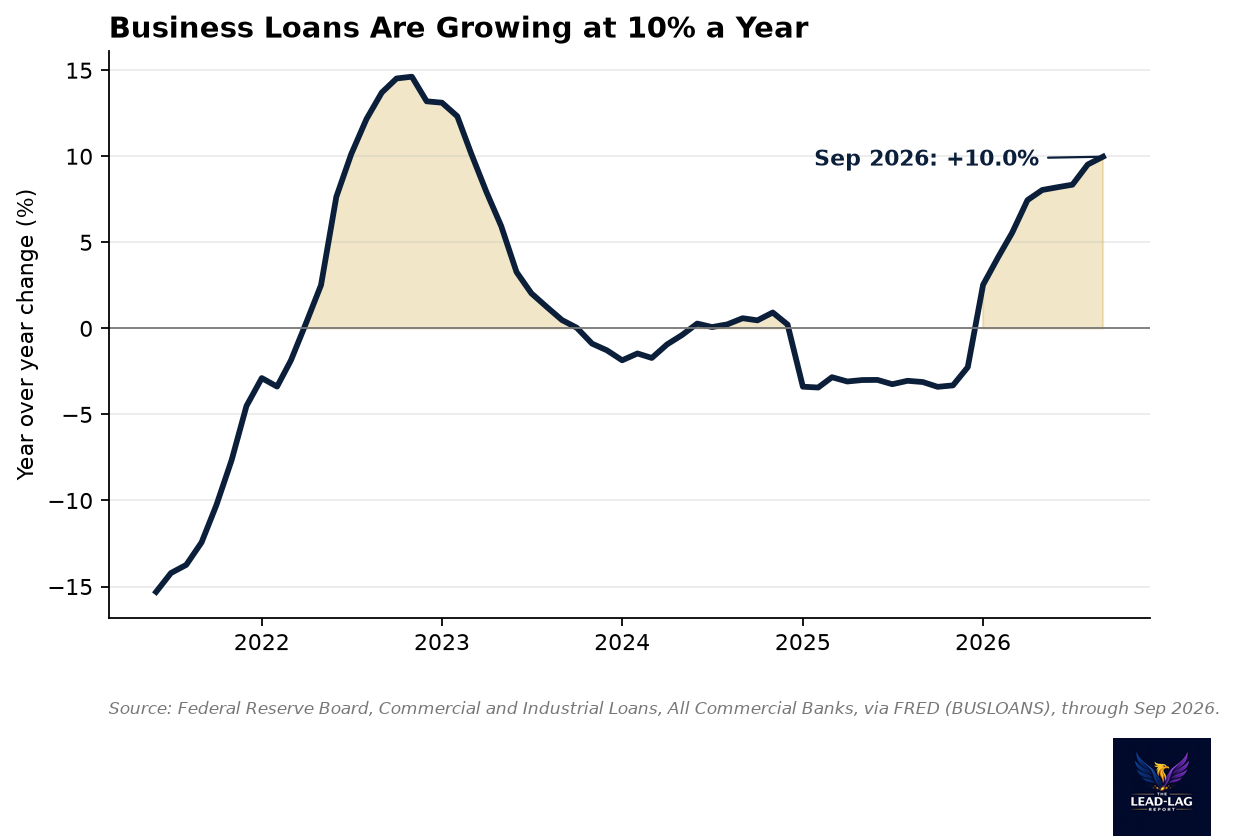
Other lending is moving too. Consumer credit outstanding grew 5.0% over the past year, and total bank credit grew 6.2% in the 52 weeks through October 7, to $19.9 trillion.[3][4] Commercial lending is the leader, but it is not alone.
The money supply agrees
Bank loans create deposits, so credit growth and money growth tend to move together. They are moving together now.
M2, the broad measure of money that includes cash, checking and savings deposits, was $23.34 trillion in August. That is 5.66% above a year earlier, the fastest growth since June 2022.[5] In April 2023 M2 was shrinking at 4.6% a year, the sharpest contraction in any month since at least 2000.[5]
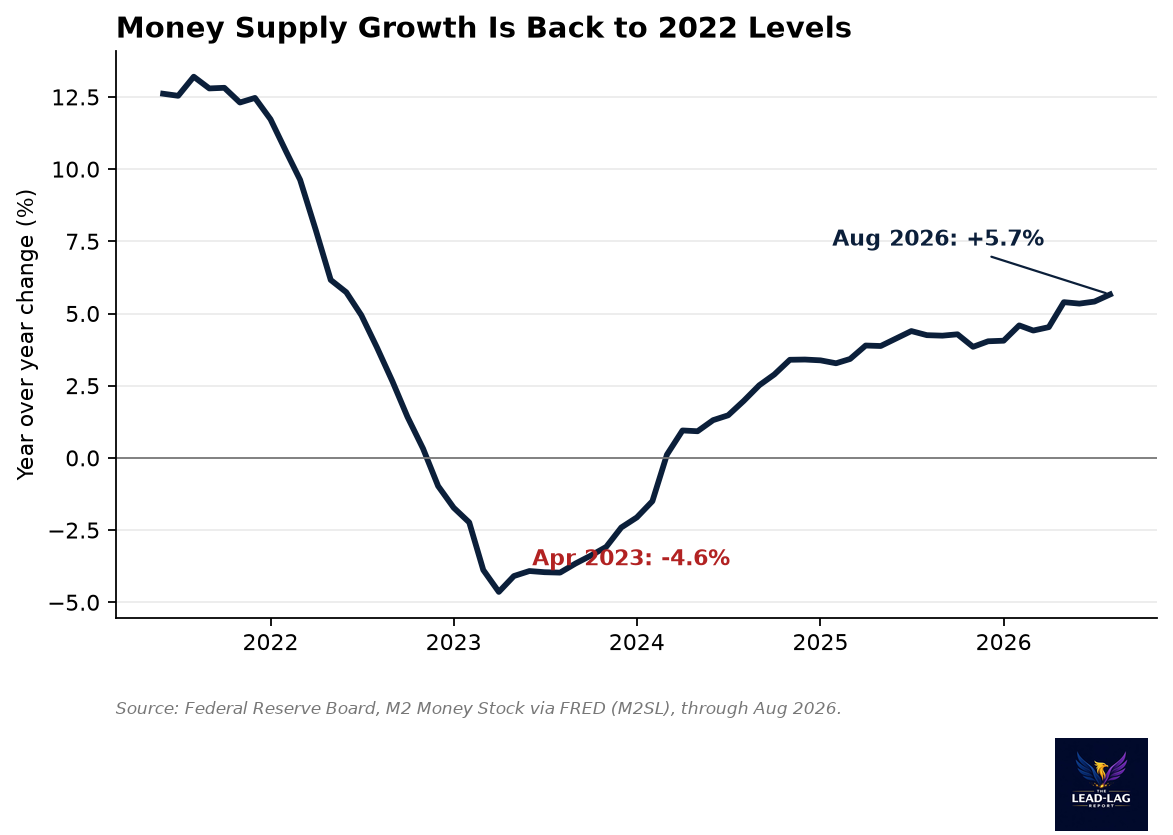
Even so, I would not call this a flood. M2 growth of 5.7% is far below the 12% pace of 2021. But the direction matters. Money and credit both bottomed in 2023 and 2025, and both have been rising since, while the policy rate has stayed well above where it was two years ago.
The Fed is hiking anyway
The effective federal funds rate rose from 3.63% to 3.88% on September 17.[6] Consumer prices were 3.72% higher in September than a year earlier.[7] By my arithmetic that puts the policy rate about 0.16 percentage points above inflation. That is close to neutral at best.
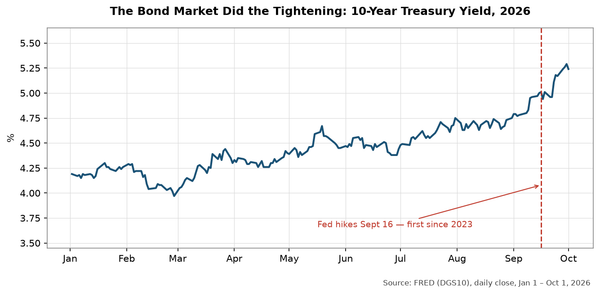
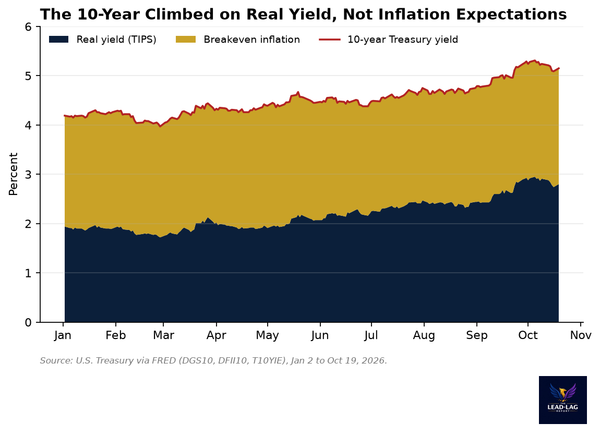
The 10-year Treasury yield was 5.13% on October 21, and oil, as measured by West Texas Intermediate, was $107.89 on October 20, up from $57.21 on January 2.[8][9] Earlier this month I wrote that the Fed is hiking into a supply shock. This chart shows the other half of the picture.
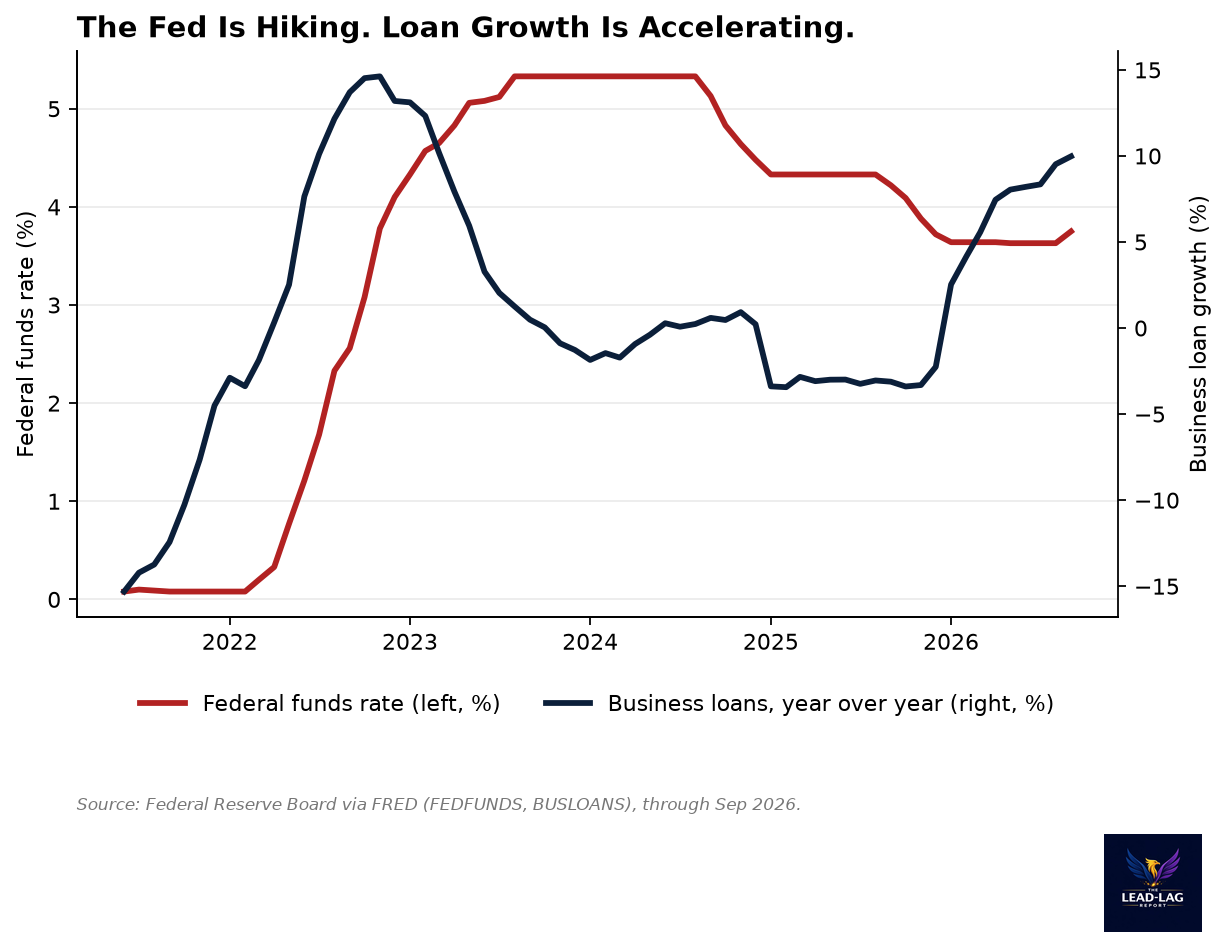
In 2022 the Fed lifted its rate from near zero to 4.1% by December, and loan growth peaked at 14.6% in November 2022 before sliding through 2023 as the tightening took hold. The 2026 sequence is different. The rate rise so far is 25 basis points, and loan growth has already climbed from a 3.4% decline in October 2025 to a 10% gain.[1][6]
Two readings of the same number
There are two ways to read faster business borrowing, and the data do not settle it.
The first reading is strength. Companies borrow when they expect to sell more. Real GDP grew at about a 2.2% annual rate in the second quarter, initial jobless claims were 194,000 in the week of October 17, and the lowest reading this year was 189,000 in July.[10][11] If that is what is driving loans, demand is stronger than an unemployment rate of 4.2% alone would suggest, and the Fed has more to do.[12]
The second reading is cost. Companies also borrow when their costs rise faster than their cash. Oil is up 89% since January. A firm that needs to carry more inventory, or pay more for fuel and freight, draws on a credit line even if it is not selling more. In that case loan growth is a symptom of the supply shock, not a sign of demand. The surveys of banks cannot tell us which one is right, because both show up as higher utilization of credit.
The reason I care is what each reading implies for the Fed. If it is strength, higher rates are working against a strong tide. If it is cost, higher rates tighten the squeeze on the firms least able to pass costs along. I do not think the data are good enough yet to choose, and I would be wary of anyone who says they are.
What to watch
Three numbers will help sort this out.
First, the next Senior Loan Officer survey. If banks start tightening again while loans keep growing, credit supply and demand are pulling in opposite directions, and growth in loans becomes harder to sustain. If standards stay near zero, the credit impulse continues.
Second, the weekly bank credit data. A reading that slows toward 5% would say the September surge was a one-time catch-up after a year of shrinking loans. A reading that holds near 10% would say the hike has not bitten yet.
Third, inflation. A growing money supply, easier bank standards and a hiking Fed do not usually sit together for long. One of them gives way. The next inflation report will show which one it is, starting from September's 3.72%.[7]
This post is for informational purposes only and is not investment advice. Past performance is no guarantee of future results.
* * *
Notes
[1] Commercial and Industrial Loans, All Commercial Banks, Board of Governors of the Federal Reserve System via FRED, series BUSLOANS: https://fred.stlouisfed.org/series/BUSLOANS. $2,959.4 billion (Sep 2026), $2,691.0 billion (Sep 2025), $2,657.3 billion (Apr 2025), $2,708.5 billion (Dec 2025). Growth rates are my calculations from monthly levels: 9.98% (Sep 2026), 10.17% (Mar 2023), 14.6% (Nov 2022), about 12.5% annualized from Dec 2025 to Sep 2026, -3.4% (Oct 2025).
[2] Net Percentage of Domestic Banks Tightening Standards for C&I Loans to Large and Middle-Market Firms, Senior Loan Officer Opinion Survey, via FRED, series DRTSCILM: https://fred.stlouisfed.org/series/DRTSCILM. 0.0 (Jul 2026), 8.1 (Apr 2026), 5.3 (Jan 2026), 50.8 (Jul 2023).
[3] Consumer Credit Owned and Securitized, Outstanding, Federal Reserve via FRED, series CONSUMER: https://fred.stlouisfed.org/series/CONSUMER. $1,927.1 billion (Sep 2026), up 5.04% from Sep 2025 by my calculation.
[4] Bank Credit, All Commercial Banks, Federal Reserve via FRED, series TOTBKCR: https://fred.stlouisfed.org/series/TOTBKCR. $19,948.5 billion (Oct 7, 2026) versus $18,791.3 billion (Oct 8, 2025), up 6.16% by my calculation.
[5] M2, Board of Governors of the Federal Reserve System via FRED, series M2SL: https://fred.stlouisfed.org/series/M2SL. $23,342.8 billion (Aug 2026), $22,092.6 billion (Aug 2025). Year-over-year rates are my calculations: 5.66% (Aug 2026), -4.64% (Apr 2023), highest since Jun 2022.
[6] Federal Funds Effective Rate, FRED series DFF: https://fred.stlouisfed.org/series/DFF. 3.63% (Sep 16, 2026), 3.88% (from Sep 17, 2026). Monthly average, series FEDFUNDS: https://fred.stlouisfed.org/series/FEDFUNDS, 3.75% (Sep 2026). 4.1% (Dec 2022).
[7] Consumer Price Index for All Urban Consumers: All Items, U.S. Bureau of Labor Statistics via FRED, series CPIAUCSL: https://fred.stlouisfed.org/series/CPIAUCSL. 336.298 (Sep 2026) versus 324.245 (Sep 2025), up 3.72% by my calculation. The policy-rate gap of 0.16 points is 3.88% less 3.72%.
[8] Market Yield on U.S. Treasury Securities at 10-Year Constant Maturity, FRED series DGS10: https://fred.stlouisfed.org/series/DGS10. 5.13% (Oct 21, 2026).
[9] Crude Oil Prices: West Texas Intermediate, FRED series DCOILWTICO: https://fred.stlouisfed.org/series/DCOILWTICO. $107.89 (Oct 20, 2026), $57.21 (Jan 2, 2026), up 89% by my calculation.
[10] Real Gross Domestic Product, Bureau of Economic Analysis via FRED, series GDPC1: https://fred.stlouisfed.org/series/GDPC1. $24,408.0 billion (Q2 2026) versus $24,274.4 billion (Q1 2026), a 2.2% annualized rate by my calculation.
[11] Initial Claims, U.S. Employment and Training Administration via FRED, series ICSA: https://fred.stlouisfed.org/series/ICSA. 194,000 (week ending Oct 17, 2026), 189,000 (week ending Jul 18, 2026, low of 2026).
[12] Unemployment Rate, Bureau of Labor Statistics via FRED, series UNRATE: https://fred.stlouisfed.org/series/UNRATE. 4.2% (Sep 2026).
The Lead-Lag Report is provided by Lead-Lag Publishing, LLC. All opinions and views mentioned in this report constitute our judgments as of the date of writing and are subject to change at any time. Information within this material is not intended to be used as a primary basis for investment decisions and should also not be construed as advice meeting the particular investment needs of any individual investor. Trading signals produced by the Lead-Lag Report are independent of other services provided by Lead-Lag Publishing, LLC or its affiliates, and positioning of accounts under their management may differ. Please remember that investing involves risk, including loss of principal, and past performance may not be indicative of future results. Lead-Lag Publishing, LLC, its members, officers, directors and employees expressly disclaim all liability in respect to actions taken based on any or all of the information on this writing.