The 10-Year Hit 5.31%. The Bond Market Says It Is Not Inflation.
The 10-year yield rose 97 basis points this year, and 87 of them were real yield. Oil is up 78%, yet 10-year inflation expectations moved 10 basis points.


Free for advisors today: Money-in-Motion Prospect Strategy Pack

Reach people at the moment their finances change. A prospect strategy for business sales, inheritances, retirements, relocations and other money-in-motion events: signal sourcing, sourced fit analysis and outreach copy, without assuming need, timing or assets.
What you receive
- Signal sourcing status
- Named prospect discovery shortlist
- Prospect/advisor research brief
- Alignment rationale
- Risk and sensitivity notes
- Recommended engagement strategy
Cost in credits: 4. Turnaround: 3-5 business days. Delivered as: an AI-prepared draft that you review. Best for: Advisors who want a focused plan for high-opportunity prospects.
It is free for advisors. There is no invoice from us. You earn the credits by showing up: attend a sponsored Lead-Lag Media webinar, meet a fund issuer in a one-on-one introduction, or join one of our advisor dinners.
Prefer to browse first? See all 34 services at advisor.leadlagmedia.com.
Credits carry no cash value and are not payment for services. Drafts are prepared with AI assistance and are for your and your firm’s review before use; they are not investment, legal, tax or compliance advice, and nothing is guaranteed. Services are offered to financial advisors and are not a solicitation to retail investors. Does not send live outreach, guarantee prospect fit, infer assets, or contact prospects. Public signal research runs only when permission and research targets are supplied; otherwise this is a strategy pack from saved inputs.
The 10-Year Hit 5.31%. The Bond Market Says It Is Not Inflation.
Real yields are at their highest since 2008, while inflation expectations have barely moved, even with oil up 78% this year.
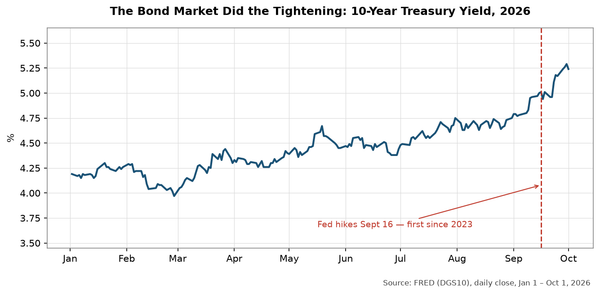
On October 5 the 10-year Treasury yield closed at 5.31%, the highest close in the FRED series that starts in January 2003. The previous high was 5.26% on June 12, 2007.[1] It closed at 5.15% on Monday, October 19.[1]
The easy story is inflation. Oil is the obvious suspect, and the bond market is not buying it.
Where the yield came from
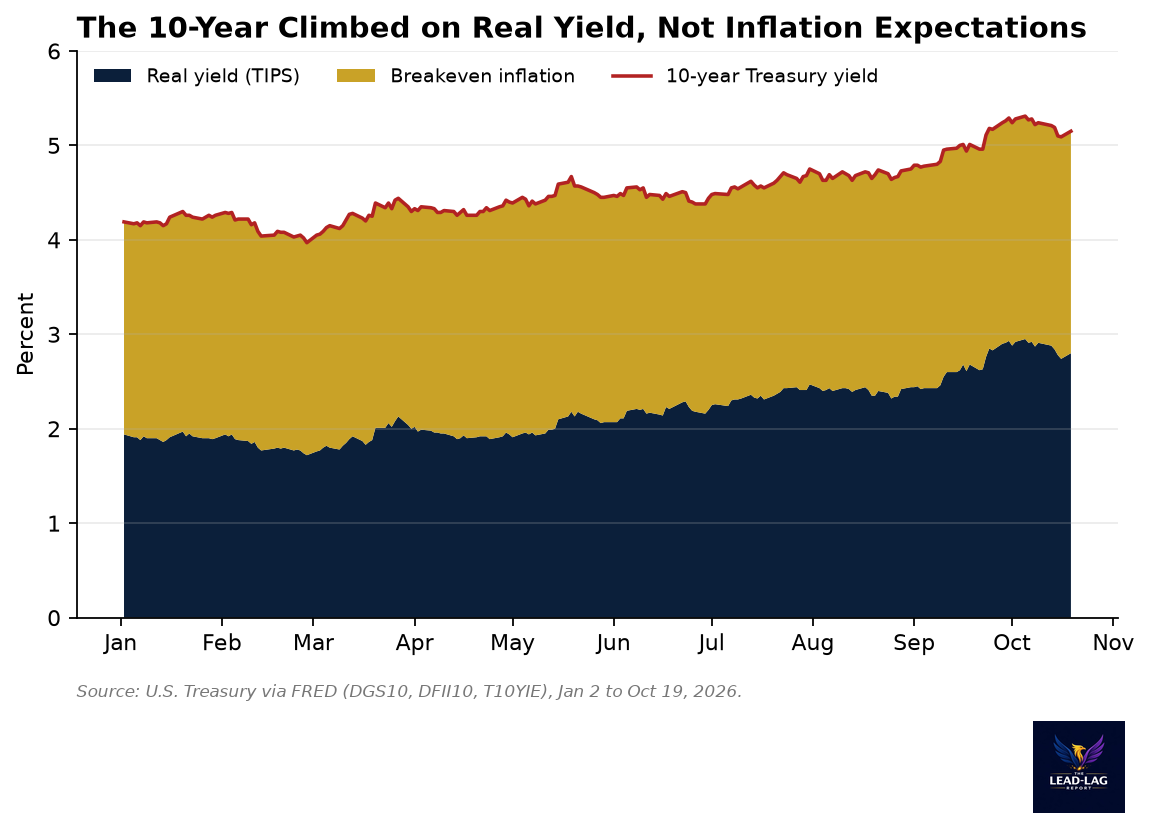
A nominal yield is a real yield plus an inflation expectation. The Treasury publishes both pieces: the 10-year TIPS yield and the breakeven rate that falls out of the comparison.[2][3]
On December 31 the 10-year yield was 4.18%, made of a 1.93% real yield and a 2.25% breakeven.[1][2][3] On October 19 it was 5.15%, made of a 2.80% real yield and a 2.35% breakeven.[1][2][3] The nominal yield rose 97 basis points. The real yield rose 87 of them, about 90%. The breakeven rose 10.
The recent leg looks the same. From August 28 to October 19 the 10-year rose 42 basis points, from 4.73% to 5.15%. The real yield rose 38 and the breakeven rose 4.[1][2][3]
The front end moved even more. The 2-year yield rose from 3.47% on December 31 to 4.77% on October 19, a gain of 130 basis points against 97 for the 10-year.[6] The gap between the two narrowed from 71 basis points to 38. A curve that flattens like this usually reflects a higher expected path for the policy rate, though a single spread cannot prove it.
Oil did not move the needle
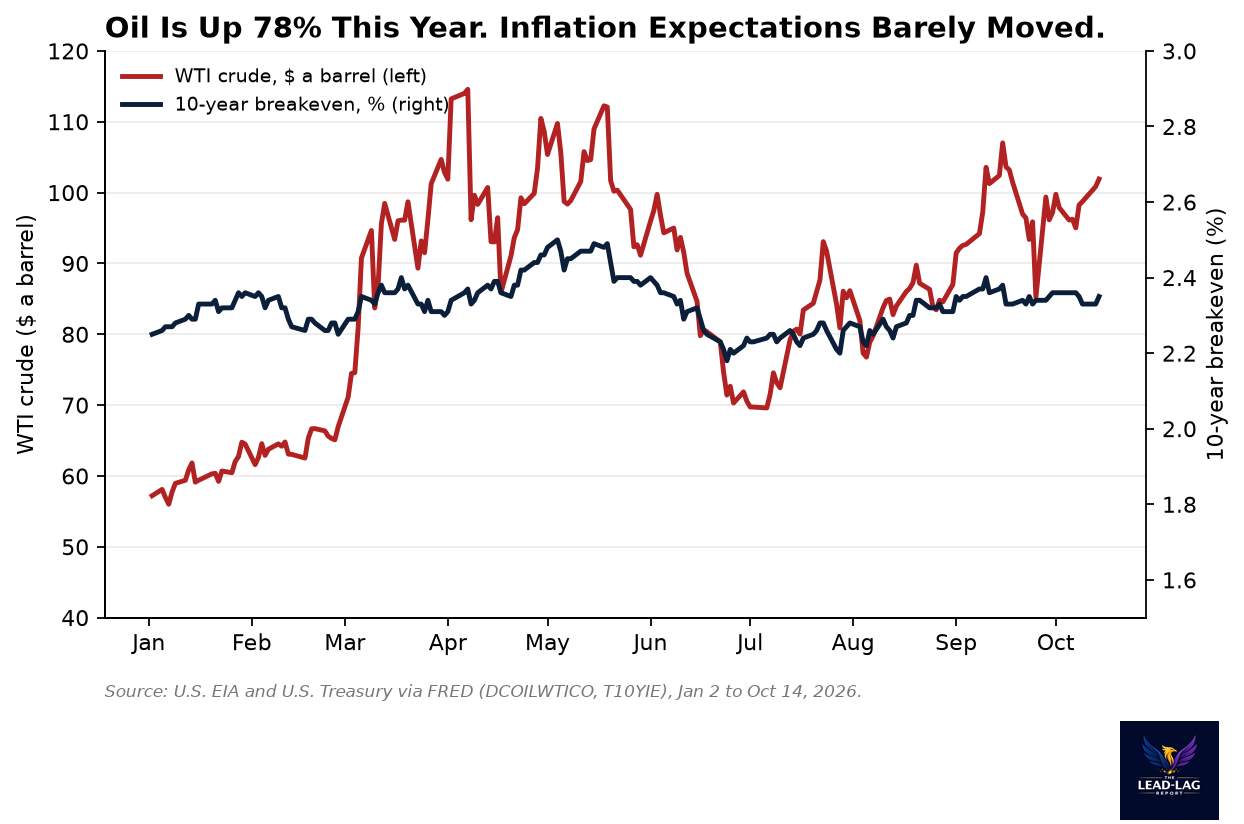
West Texas crude closed at $57.21 a barrel on January 2 and $101.91 on October 14, the latest reading in the series, a rise of 78%. It peaked at $114.58 on April 7.[4]
If bond investors expected that to feed through to prices, the 10-year breakeven would show it. It ranged between 2.18% and 2.50% this year and stood at 2.35% on October 19.[3] The highest reading came on May 4, not at the oil peak.
Two readings fit. One is that investors see the oil rise as a price-level event that does not change the path of inflation. The other is that something else is pushing the real yield up hard enough to swamp whatever oil does to expectations. These data cannot separate the two.
What a 2.80% real yield means
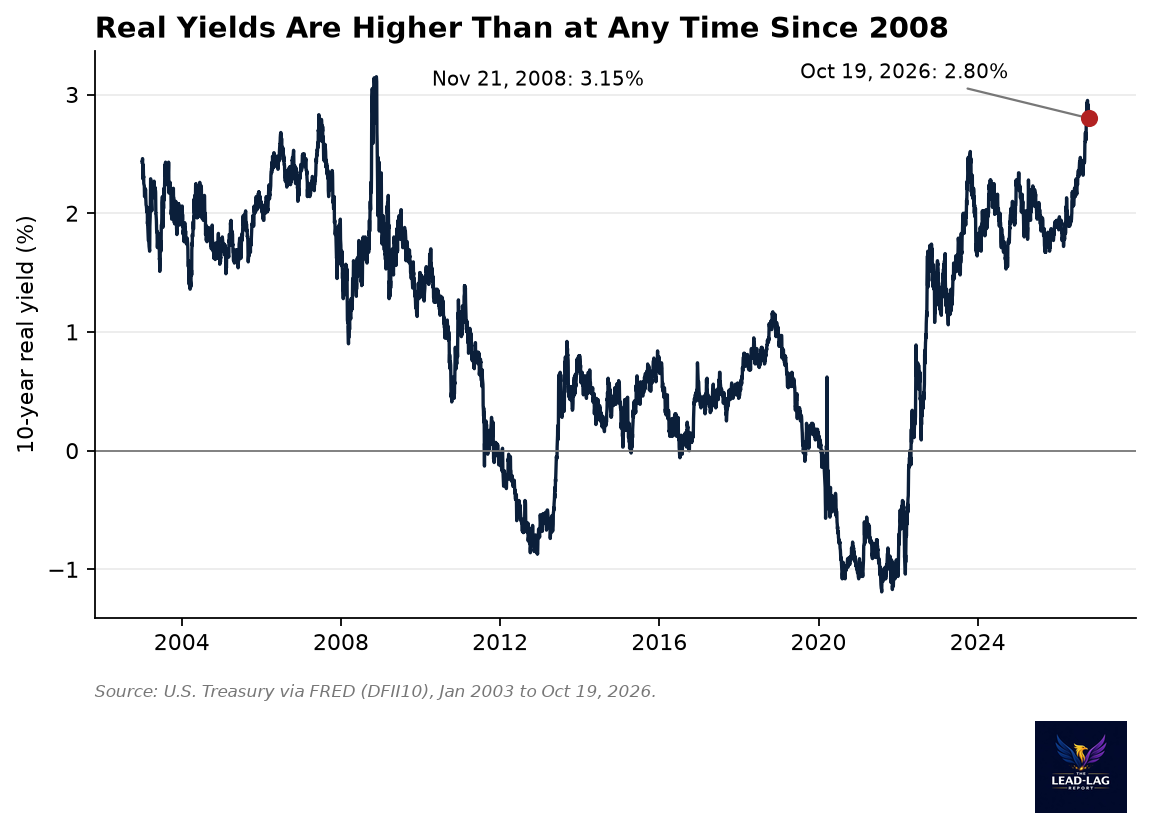
The 10-year real yield was 2.80% on October 19. It reached 2.95% on October 5.[2] The last time it was at or above 2.80% before this year was November 2008, when it spiked to 3.15% during the credit crisis.[2] Between 2009 and 2025 the highest reading was 2.52%, in October 2023.[2]
This episode is arriving in a market where the S&P 500 closed at 7,712.57 on October 20, up 12.7% from 6,845.50 on December 31.[5]
What the data cannot say
A rising real yield can reflect stronger expected growth, a higher expected path for the policy rate, heavier Treasury supply or a bigger term premium. Nothing in these series tells you which. The honest statement is narrower: over the last ten months the market has asked for a much higher return on lending for ten years and has not asked for more protection against inflation.
Duration is the practical consequence. A portfolio with a 7-year duration loses roughly 7% of its value for each full percentage point of yield. Most of this year's loss in bond prices came from the real component, which is the part that TIPS holders also carry. Holding inflation protection did not protect against this move, because the move was not about inflation.
Inflation-protected bonds hedge the inflation piece of the yield. This year that piece was small.
What to watch
Three readings will tell you whether this holds. First, the real yield against its 2.95% October high. Second, the breakeven against its 2.50% May high, which would be the first sign that oil is reaching expectations. Third, the gap between stocks and real yields: the S&P 500 has absorbed an 87 basis point rise in real rates this year without losing ground, and that is a statement about earnings and positioning that only the next few quarters can confirm or reject.
Few understand this.
* * *
Notes
[1] Market Yield on U.S. Treasury Securities at 10-Year Constant Maturity, FRED series DGS10: https://fred.stlouisfed.org/series/DGS10. 5.31% (Oct 5, 2026, highest in the series since Jan 2003; prior high 5.26% on Jun 12, 2007), 5.15% (Oct 19), 4.18% (Dec 31, 2025), 4.73% (Aug 28).
[2] Market Yield on U.S. Treasury Securities at 10-Year Constant Maturity, Inflation-Indexed, FRED series DFII10: https://fred.stlouisfed.org/series/DFII10. 2.80% (Oct 19), 2.95% (Oct 5), 1.93% (Dec 31, 2025), 2.42% (Aug 28); 3.15% on Nov 21, 2008; 2.52% on Oct 25, 2023.
[3] 10-Year Breakeven Inflation Rate, FRED series T10YIE: https://fred.stlouisfed.org/series/T10YIE. 2.35% (Oct 19 and Oct 20), 2.25% (Dec 31, 2025), 2.31% (Aug 28); 2026 range 2.18% (Jun 24) to 2.50% (May 4).
[4] Crude Oil Prices: West Texas Intermediate, Cushing, Oklahoma, U.S. Energy Information Administration via FRED, series DCOILWTICO: https://fred.stlouisfed.org/series/DCOILWTICO. $57.21 (Jan 2), $101.91 (Oct 14), $114.58 peak (Apr 7). The series was last updated through Oct 14.
[5] S&P 500, S&P Dow Jones Indices via FRED, series SP500: https://fred.stlouisfed.org/series/SP500. 7,712.57 (Oct 20), 6,845.50 (Dec 31, 2025).
[6] Market Yield on U.S. Treasury Securities at 2-Year Constant Maturity, FRED series DGS2: https://fred.stlouisfed.org/series/DGS2. 4.77% (Oct 19), 3.47% (Dec 31, 2025).
The Lead-Lag Report is provided by Lead-Lag Publishing, LLC. All opinions and views mentioned in this report constitute our judgments as of the date of writing and are subject to change at any time. Information within this material is not intended to be used as a primary basis for investment decisions and should also not be construed as advice meeting the particular investment needs of any individual investor. Trading signals produced by the Lead-Lag Report are independent of other services provided by Lead-Lag Publishing, LLC or its affiliates, and positioning of accounts under their management may differ. Please remember that investing involves risk, including loss of principal, and past performance may not be indicative of future results. Lead-Lag Publishing, LLC, its members, officers, directors and employees expressly disclaim all liability in respect to actions taken based on any or all of the information on this writing.