Small Caps Are Paying The 10-Year's Bill
The Nasdaq set a record on October 5 while the Russell 2000 sat 8.6% below its August peak. The index is not diverging from the economy. It is diverging from the price of money.


Today’s Lead-Lag Report post is sponsored by Sparkline

Looking for a fresh take on value investing? ITAN helps investors modernize their U.S. value allocations, providing exposure to innovative, intangible-rich companies at attractive prices.
Learn more by visiting the ITAN Website or contacting the Sparkline Team.
DISCLAIMER – PLEASE READ: This is sponsored advertising content for which Lead-Lag Publishing, LLC has been paid a fee. The information provided in the link is solely the creation of Sparkline Capital. Lead-Lag Publishing, LLC does not guarantee the accuracy or completeness of the information provided in the link or make any representation as to its quality. All statements and expressions provided in the link are the sole opinion of Sparkline Capital and Lead-Lag Publishing, LLC expressly disclaims any responsibility for action taken in connection with the information provided in the link.
Small Caps Are Paying The 10-Year’s Bill
The Nasdaq set a record on October 5 while the Russell 2000 sat 8.6% below its August peak and new lows outnumbered new highs four to one. The index is not diverging from the economy. It is diverging from the price of money.
MICHAEL A. GAYED, CFA
Key Highlights
- The Russell 2000 closed at 2,806.98 on October 9, 8.6% below its record close of 3,045.48 on August 12, and was the only major U.S. index to finish the week lower.
- Since that August 12 record, the Russell 2000 ETF (IWM) is down 7.9% while the Nasdaq-100 ETF (QQQ) is up 3.8% and the S&P 500 ETF (SPY) is up 0.8%.
- The IWM-to-SPY ratio stands at 0.358, 12.9% below its June 26 peak of 0.411 and below where it started a year ago.
- The 10-year Treasury yield rose from 4.68% on August 12 to 5.22% on October 8, and on daily data IWM has moved opposite to yields with a correlation of negative 0.47.
On October 5 the Nasdaq Composite closed at a record 27,477.31, and on the same day 206 Nasdaq-listed stocks made new 52-week lows against only 46 that made new highs.[1]
A record index and a four-to-one ratio of lows to highs can coexist because indexes are weighted by size, and the biggest companies are not the ones paying the price of higher rates. The Russell 2000 has now fallen 8.6% from its mid-August peak,[2] while the S&P 500 ETF sits within a fraction of a percent of its high.[3] The gap between those two numbers is the story of the quarter. It is also, I would argue, a cleaner message than most of what the market has said all year: the problem is not growth. It is the cost of capital.
The Scoreboard
The Russell 2000 closed at 2,806.98 on Friday, October 9, up 0.5% on the day but down 0.9% on the week, which made it the only major U.S. index to finish the week lower. Its record close was 3,045.48 on August 12. The S&P 500 closed at 7,811.54, up 1.2% on the week and 14.1% for the year, and the Nasdaq Composite closed at 27,366.17, up 17.7% for the year. The Russell 2000 is up 13.1% year to date.[2]
That year-to-date figure is worth sitting with, because it hides the direction of travel. A small-cap index up 13.1% for the year does not look like a market in trouble. But it was up more than that two months ago. Using the ETF that tracks it, IWM peaked at $305.09 on August 14 and closed at $278.94 on October 9, a decline of 8.6%. Over the same stretch SPY is flat to slightly up.[3] The performance is a story of the last eight weeks, not the last nine months.
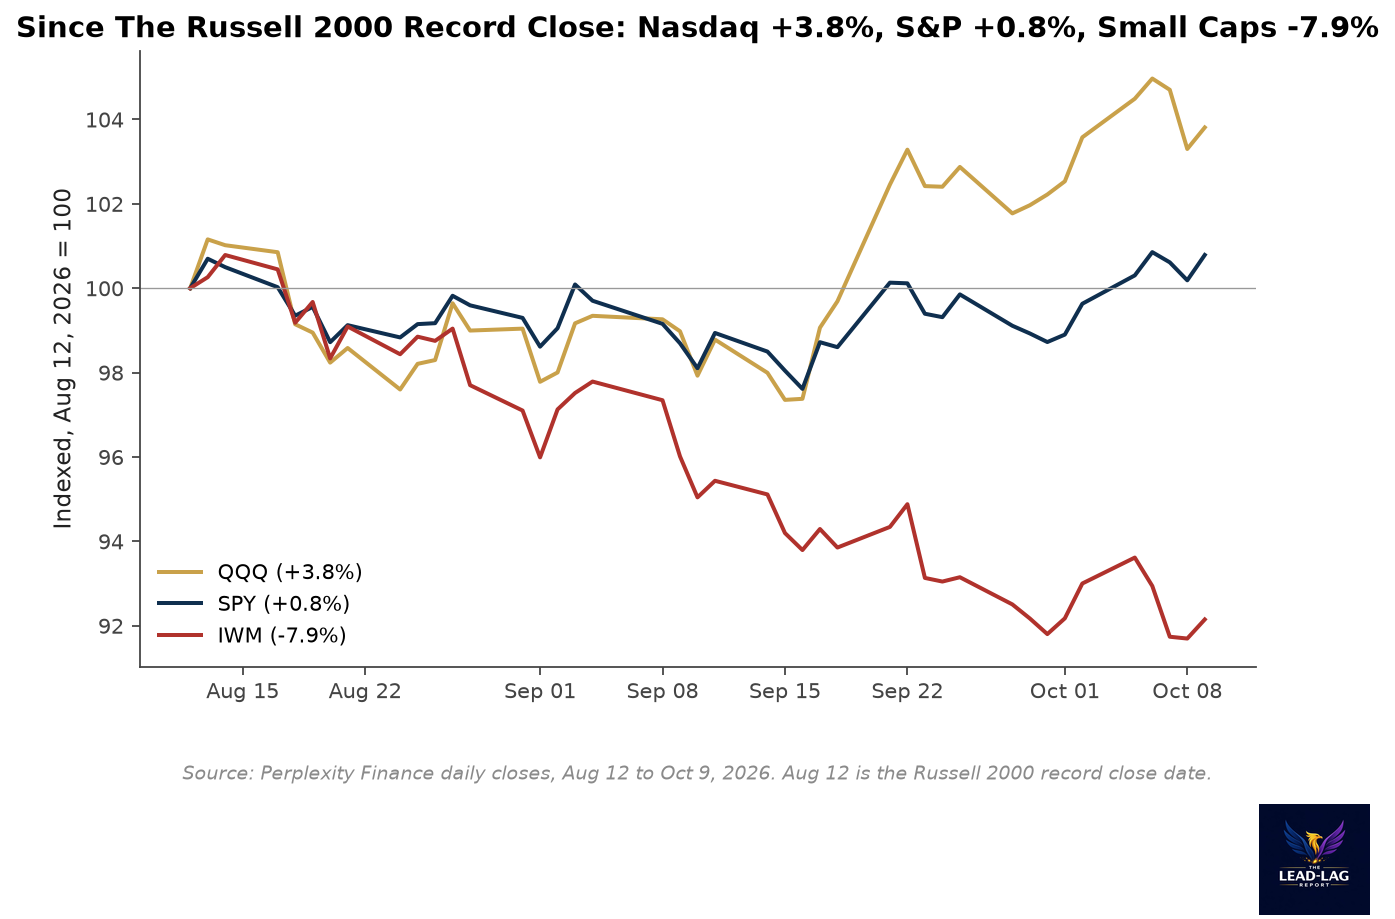
Indexed to the Russell 2000's record date, the split is stark. QQQ is up 3.8%, SPY is up 0.8%, and IWM is down 7.9%. That is an 11.7-point gap between the Nasdaq-100 and the Russell 2000 in just under two months.[3] In terms of leadership, the market has narrowed. It has not collapsed, it has narrowed, and narrowing is a different kind of fragility.
Breadth Is Worse Than The Index
The most useful data on this comes from an analysis of the Nasdaq published after the October 5 record close. Of 2,857 Nasdaq-listed common stocks with enough trading history to measure, 206 hit new 52-week lows that day against 46 that hit new highs, a ratio of more than four to one on the index’s record day.[1] Among U.S. small caps, 61 made new lows and 28 made new highs. Among U.S. companies worth $10 billion or more, 18 made new lows and 19 made new highs: effectively even.[1]
The drawdown data underscore the point. Since June 1, 57.5% of U.S. small caps fell 20% or more at some point, compared with 40.1% of large caps. As of October 5, 42.1% of small caps closed at least 20% below their summer high, against 22.9% of large caps, and 22.7% of small caps were at least 30% below their summer high, against 7.2% of large caps.[1] Only 8.3% of small caps were within 2% of a summer high, versus 10.3% of large caps, and 72.3% of small caps were trading below their 50-day average, compared with 67.1% of large caps.[1]
Read those numbers carefully. Large caps are not uniformly healthy: 40% of them fell 20% or more at some point this summer. The difference is in severity and recovery. A small-cap stock that fell 20% is much more likely to still be down 20%, or 30%, than a large-cap stock that fell 20%. The index record reflects a handful of enormous companies, including Nvidia, which closed at $238.90 on October 5, above its prior record close of $235.74 from May 14.[1] The broad market below them is working through a correction while the headline number does not show it.
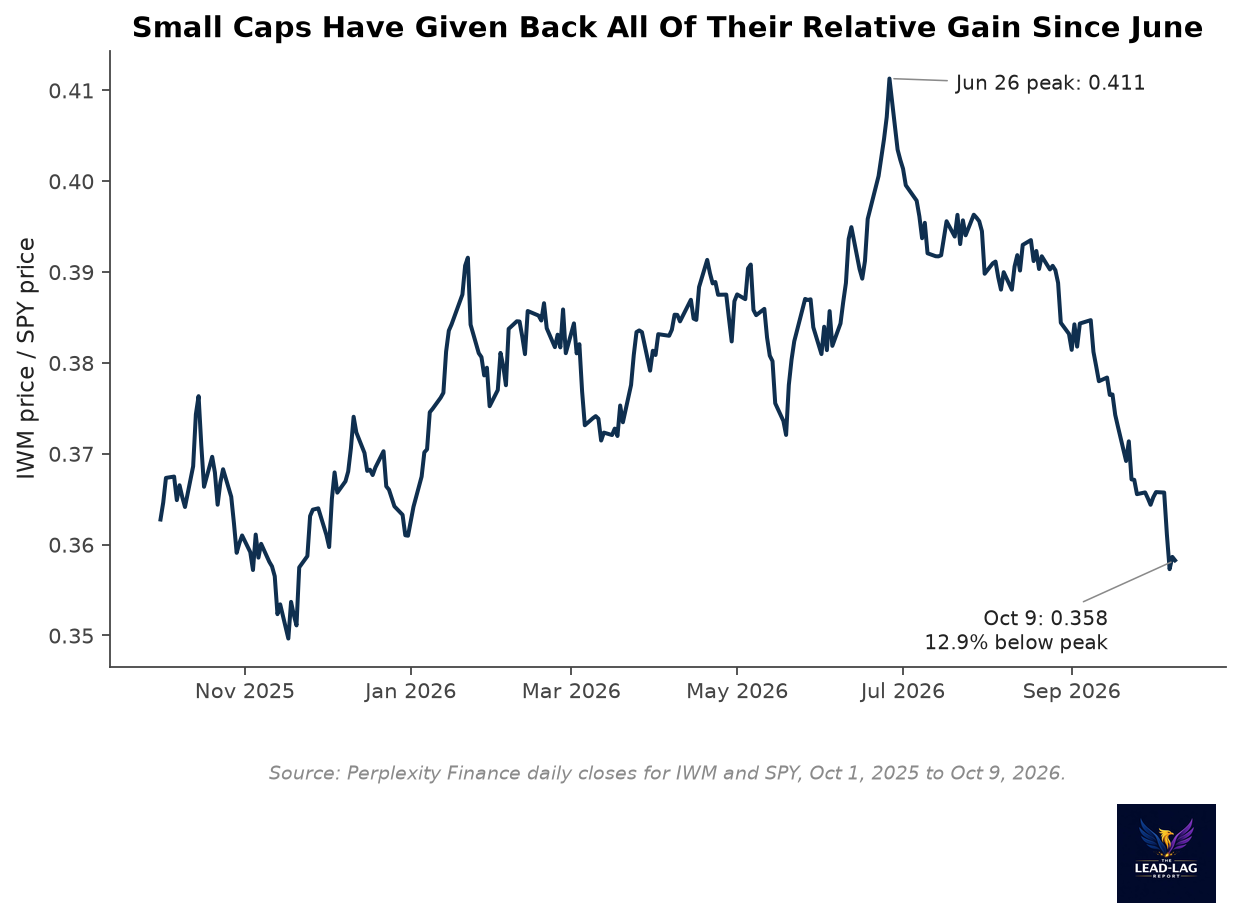
The relative-strength chart makes the same point from another angle. The ratio of IWM to SPY peaked at 0.411 on June 26 and closed October 9 at 0.358, which is 12.9% below the peak and slightly below the 0.363 it started with a year earlier.[3] Every point of relative outperformance that small caps earned in the first half of 2026 has been surrendered. For anyone who built a portfolio on the idea that the rally was broadening, the ratio is the scorecard, and it reads against them.
The Price Of Money
What changed between June and October was not the earnings outlook. It was the discount rate. The 10-year Treasury yield was 4.44% on June 30, 4.68% on August 12, and 5.22% on October 8, after a 2026 closing high of 5.31% on October 5.[4] In the eight weeks since the small-cap peak, the 10-year has risen about 54 basis points. The Federal Reserve raised the target range to 3.75% to 4.00% on September 16, and the September minutes said most participants judged another increase would likely be appropriate by year end.[5][6]
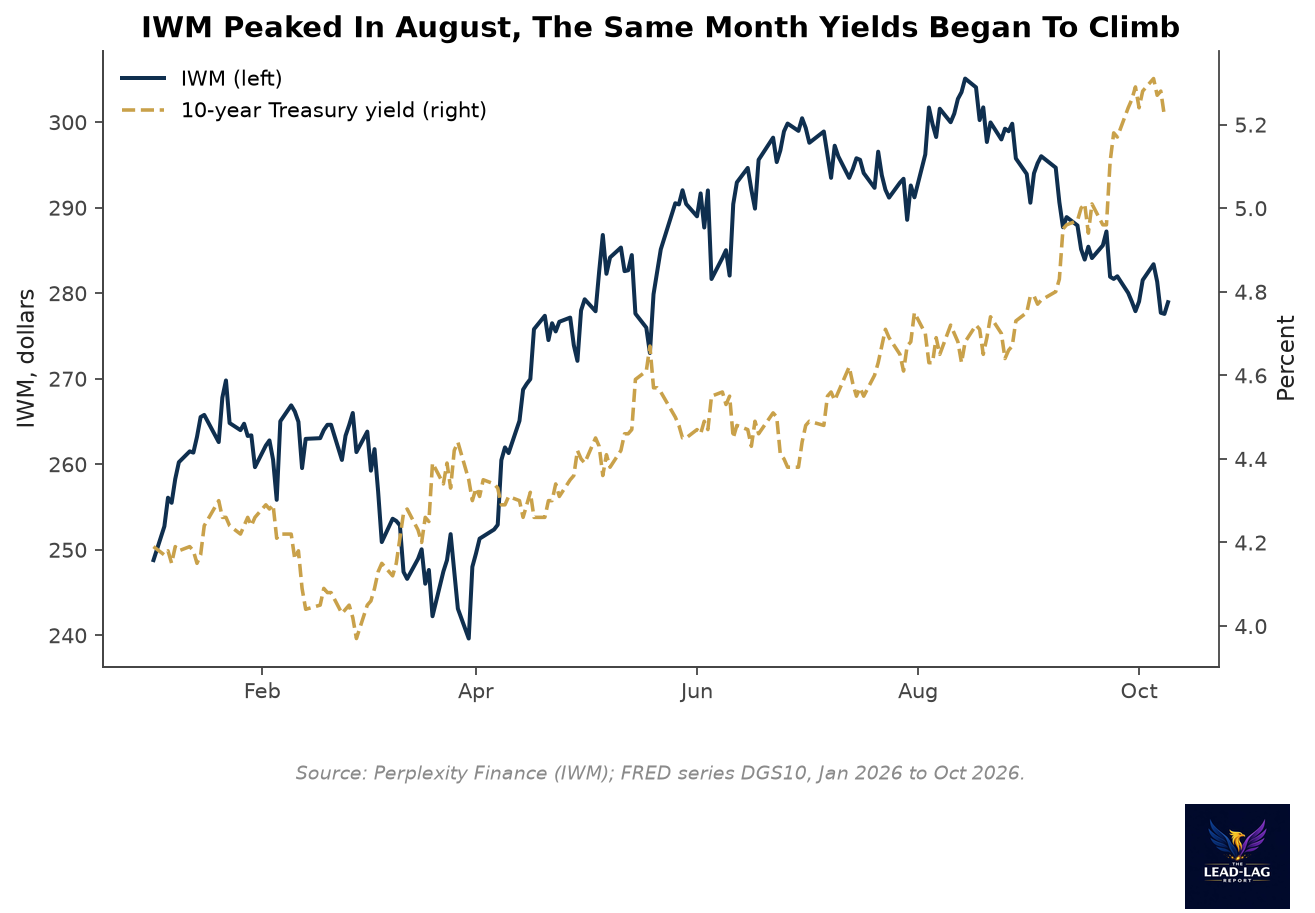
The statistical relationship is consistent with that story. On daily data from January 1 through October 9, the correlation between IWM's daily return and the daily change in the 10-year yield is negative 0.46. Since August 12 it is negative 0.47.[3][4] A simple regression of the two series suggests that since the peak, a 10-basis-point rise in the 10-year yield has been associated with an IWM decline of roughly 0.7% on the day; for the full year the estimate is about 1.2%.[3][4] These are descriptive figures from a small sample and they should not be read as a forecast. They do establish that the connection is not an anecdote. On the days yields jumped, small caps fell.
The mechanism is not mysterious. Smaller companies tend to carry a larger share of floating-rate and short-maturity debt and to have thinner cushions of interest coverage. When the Fed raises rates and long yields rise with them, their cost of capital rises faster than that of a large company that locked in long-dated fixed-rate bonds. Their valuations also lean more heavily on earnings far in the future, which a higher discount rate hits harder. Both channels point the same way: higher yields compress small-cap multiples.
The real yield tells you how much of the move is about inflation and how much is about the price of money after inflation. The 10-year TIPS real yield was 2.87% on October 8, up from a 2026 low of 1.72% on February 27.[7] A real yield near 3% is a hurdle rate. Any business that cannot earn a return above that hurdle on the incremental dollar it borrows will see its equity repriced, and small, leveraged, and unprofitable companies are disproportionately in that group.
Why The Nasdaq Is Not The Answer
It would be natural to read the Nasdaq record as evidence that the market is simply rotating, with money leaving small caps and flowing into quality growth. There is something to that. The Nasdaq-100 ETF is up 22.3% for the year and the Russell 2000 is up 13.3%, using the ETF closes.[3] But the rotation story fails to explain breadth. If investors were selecting winners, you would see lows and highs spread across the market in proportion to company quality. Instead, the lows are concentrated in small caps and in the broad Nasdaq universe, while the highs are concentrated in a few giants. That looks less like discernment and more like a liquidity preference: when capital is expensive, investors pay for balance sheets that do not need it.
This distinction matters for what comes next. A rotation can reverse when sentiment changes. A repricing of the cost of capital reverses only when the cost of capital falls, and that is a function of inflation, the Fed, and the supply of Treasury debt, none of which are changing this week.
What The Ratio Is Not Saying
It is worth being precise about the limits of the argument. The IWM-to-SPY ratio falling does not mean small-cap companies are failing. Earnings can be intact while multiples compress, and a market can reprice a whole category without any single business deteriorating. The year-to-date gain of roughly 13% in the Russell 2000 is a real gain, and the index is still well above where it began the year. What the data describe is a change in how much investors are willing to pay for each dollar of small-company earnings when the risk-free alternative pays 5.2% for ten years and nearly 3% after inflation.[4][7]
That framing also explains the speed. When a discount rate moves by about half a percentage point in eight weeks, the valuation effect arrives immediately, because it is arithmetic. Earnings revisions arrive on a quarterly lag. Small caps fell 7.9% before a single third-quarter earnings report was released, which suggests the market is repricing the denominator, not reacting to the numerator.[3] The third-quarter reporting season, which begins this month, is the first real test of whether the numerator is also weakening. If earnings hold up while the stocks stay down, the discount-rate explanation gains force. If earnings disappoint, the market is repricing both.
There is one more feature of the data that deserves attention: the large-cap numbers are not flattering either. Forty percent of large-cap stocks fell 20% or more at some point since June 1, and 67.1% of them were trading below their 50-day average on October 5.[1] The Nasdaq record is therefore a statement about a small group of stocks. It tells you very little about what the typical company has done since the summer, and the typical company is what a diversified investor actually owns.
What Would Change The Picture
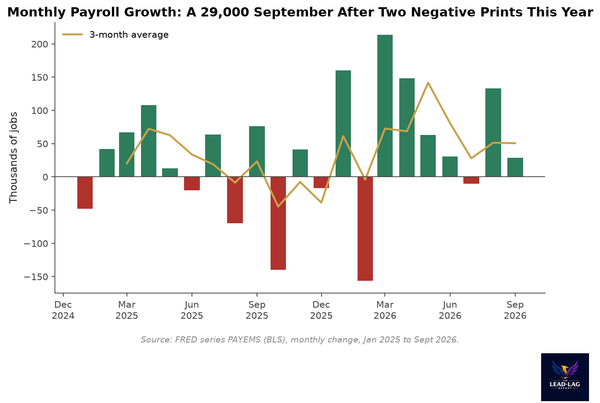
Three things would shift this analysis. First, a decline in the 10-year yield. If the September CPI report on October 14, with a headline forecast of 3.6%, comes in soft, or if the labor market keeps weakening after September payrolls rose just 29,000, yields could fall and small caps would be the first beneficiary.[6][8] The jobs data have already shifted October hike odds: the market-implied chance of a hold at the October 27 and 28 meeting rose to 82.8% after the report.[8]
Second, a different kind of evidence from breadth. If the share of small caps within 2% of a high rises above the share of large caps, the market is broadening again. Right now it is 8.3% against 10.3%.[1]
Third, the Fed itself. Markets still price a meaningful probability of another hike by December.[9] A signal that the committee is done raising rates would do more for small caps than any earnings season.
The risk for investors who hold the index and assume it reflects the whole market is that the index is not the market. The Russell 2000 is saying that the price of money matters, that the Fed’s tightening is working through the part of the economy most sensitive to it, and that the benchmark everyone watches is not where the stress is showing. The 10-year Treasury is sending the bill, and small caps are the ones paying it.
Few understand this.
— — —
Notes
- Nasdaq Composite record close 27,477.31 on October 5, 2026; 206 new 52-week lows vs 46 highs among 2,857 stocks; small cap and large cap breadth, drawdown shares since June 1, and Nvidia close of $238.90: StockTitan, October 8, 2026.
- Russell 2000 close 2,806.98 on October 9, record close 3,045.48 on August 12, weekly and year-to-date changes for the Russell 2000, S&P 500 (7,811.54) and Nasdaq Composite (27,366.17): Admiral Markets, October 12, 2026.
- IWM, SPY and QQQ daily closes, October 1, 2025 to October 9, 2026; ratio, peak, indexing and return calculations by the author: Perplexity Finance.
- 10-year Treasury constant maturity yield: 4.44% (June 30), 4.68% (August 12), 5.22% (October 8), 5.31% (October 5): FRED series DGS10. Correlation and regression computed by the author from daily IWM returns and daily changes in this series.
- Fed target range raised to 3.75% to 4.00% on September 16, 2026: Federal Reserve FOMC statement.
- September minutes language on a further increase by year end and the September CPI forecast of 3.6%: StockTitan, October 12, 2026.
- 10-year TIPS real yield, 2.87% on October 8 and 1.72% on February 27: FRED series DFII10.
- September payrolls +29,000 and CME FedWatch hold odds of 82.8% for October 27 to 28: CNBC, October 2, 2026.
- Market pricing of further Fed hikes into December: Perplexity Finance, Russell 2000 page, October 11, 2026.