Volatility Jumped 21% On Friday. High Yield Credit Moved Three Weeks Earlier.
The VIX rose 21.4% on a 1.1% stock decline, a combination seen on only four days in three years. High yield credit spreads have been saying the same thing since September 22.


Free for advisors today: Cold Email Campaign

A complete outbound campaign, built for you. Strategy, targeting, compliance-aware copy and deliverability setup for a cold email campaign grounded in your actual offering. You get a ready-to-review sequence, not a blank page.
What you receive
- Campaign strategy
- ICP and suppression checklist
- Sender and domain readiness checklist
- Deliverability setup checklist
- 3-4 email sequence
- Subject line options per email
Cost in credits: 6. Turnaround: 7-10 business days. Delivered as: an AI-prepared draft that you review. Best for: Advisors who want first conversations with qualified prospects.
It is free for advisors. There is no invoice from us. You earn the credits by showing up: attend a sponsored Lead-Lag Media webinar, meet a fund issuer in a one-on-one introduction, or join one of our advisor dinners.
Prefer to browse first? See all 34 services at advisor.leadlagmedia.com.
Credits carry no cash value and are not payment for services. Drafts are prepared with AI assistance and are for your and your firm’s review before use; they are not investment, legal, tax or compliance advice, and nothing is guaranteed. Services are offered to financial advisors and are not a solicitation to retail investors. Heavy paid list purchases and data enrichment costs are not included.
Volatility Jumped 21% On Friday. High Yield Credit Moved Three Weeks Earlier.
Junk bond spreads are up 71 basis points since August 28, investment grade is up 6, and the S&P 500 sits 1.6% below its high.
On Friday, October 16, the VIX rose 21.4% to 19.99 while the S&P 500 fell 1.09% to 7,659.44.[1][2] That is a large volatility move for a small equity move. Someone paid up for protection on a day when the index barely flinched.
The easy read is that Friday was an options story. The harder read is that credit had already been saying something for three weeks, and the stock market was the last to be asked.
What moved first
The ICE BofA US High Yield option-adjusted spread bottomed at 2.60 percentage points on August 28 and closed at 3.31 on October 16, a widening of 71 basis points.[3] Most of it arrived in seven sessions. From September 22 to October 1, the spread went from 2.68 to 3.24, a rise of 56 basis points, while the S&P 500 slipped 1.3% from 7,764.64 to 7,666.45.[3][2]
Investment grade barely noticed. The ICE BofA US Corporate spread went from 0.79 to 0.85 over the same stretch from August 28, a move of 6 basis points.[4] Over the September 22 to October 1 window it rose 9 basis points, from 0.77 to 0.86.[4]
That split matters. If the move were a general repricing of the discount rate, investment grade would have widened with it. The 10-year Treasury yield sat at 5.09% on Friday and the 2-year at 4.74%, a curve 35 basis points steep.[5][6] High rates hurt the borrower with the least room to refinance first. Spreads on the strongest balance sheets are telling you the market is discriminating on quality, not just repricing duration. That is an interpretation, not a measurement, and the data here cannot prove it.
Stocks have not agreed
The S&P 500 closed at 7,690.73 on Monday, October 19, which is 1.64% below its October 6 closing high of 7,818.93.[2] Equity investors are not showing stress. Credit investors are asking for more compensation, and volatility buyers are paying more for insurance. When three prices disagree, one of them is early or wrong.
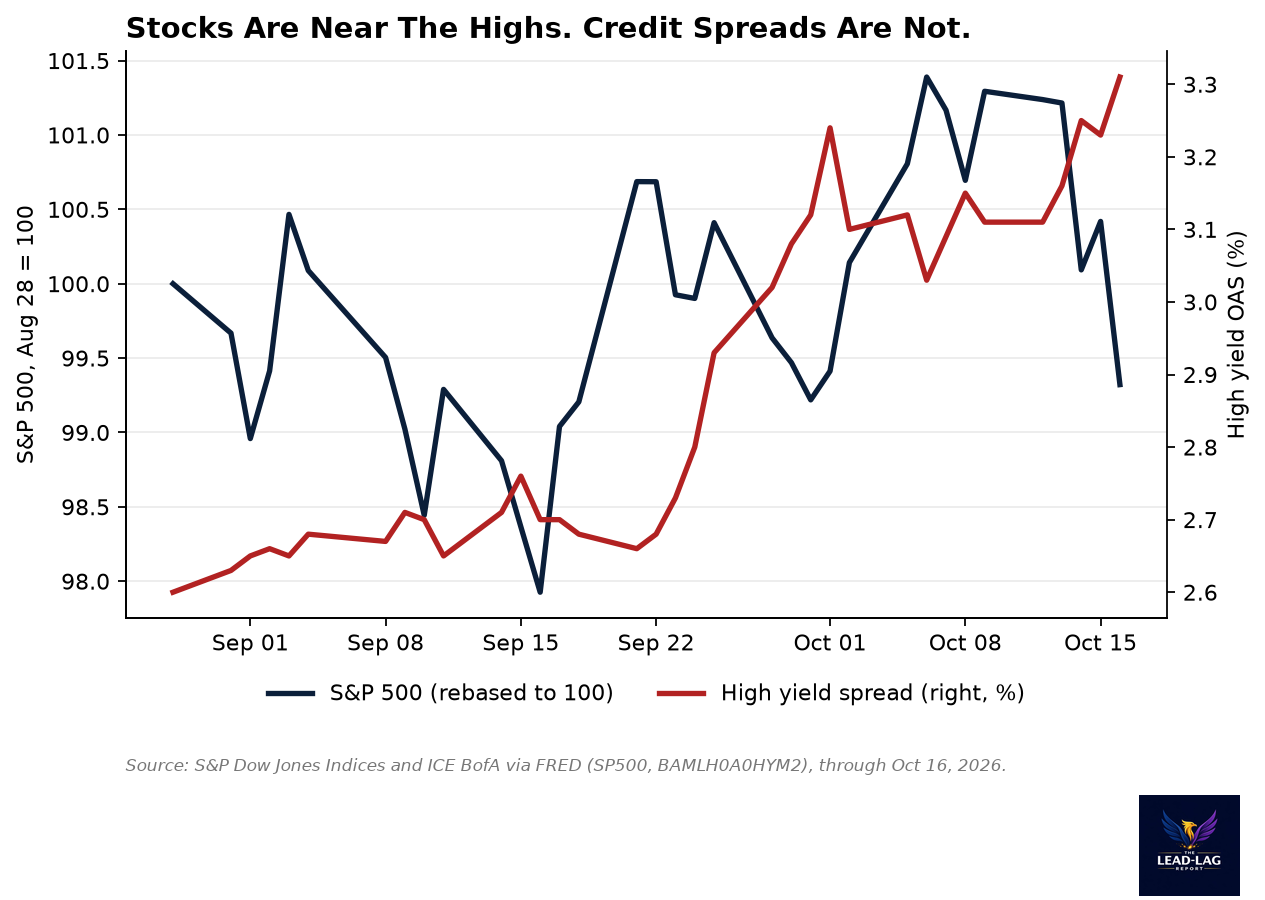
High yield at 3.31 is not distressed. It is above about 80% of the daily readings of the last three years, well below the 4.61 peak of April 7, 2025, and above the three-year median of 3.02.[3] The point is direction and breadth of disagreement, not level.
How rare was Friday
Since October 2023, the VIX has risen 20% or more in a single day 16 times. On only four of those days did the S&P 500 fall less than 1.5%: January 27, 2025, October 16, 2025, March 6, 2026, and Friday.[1][2] Most big volatility jumps come with big equity declines. A large VIX jump on a modest equity decline means the market is paying for protection against something it cannot yet see in the index.
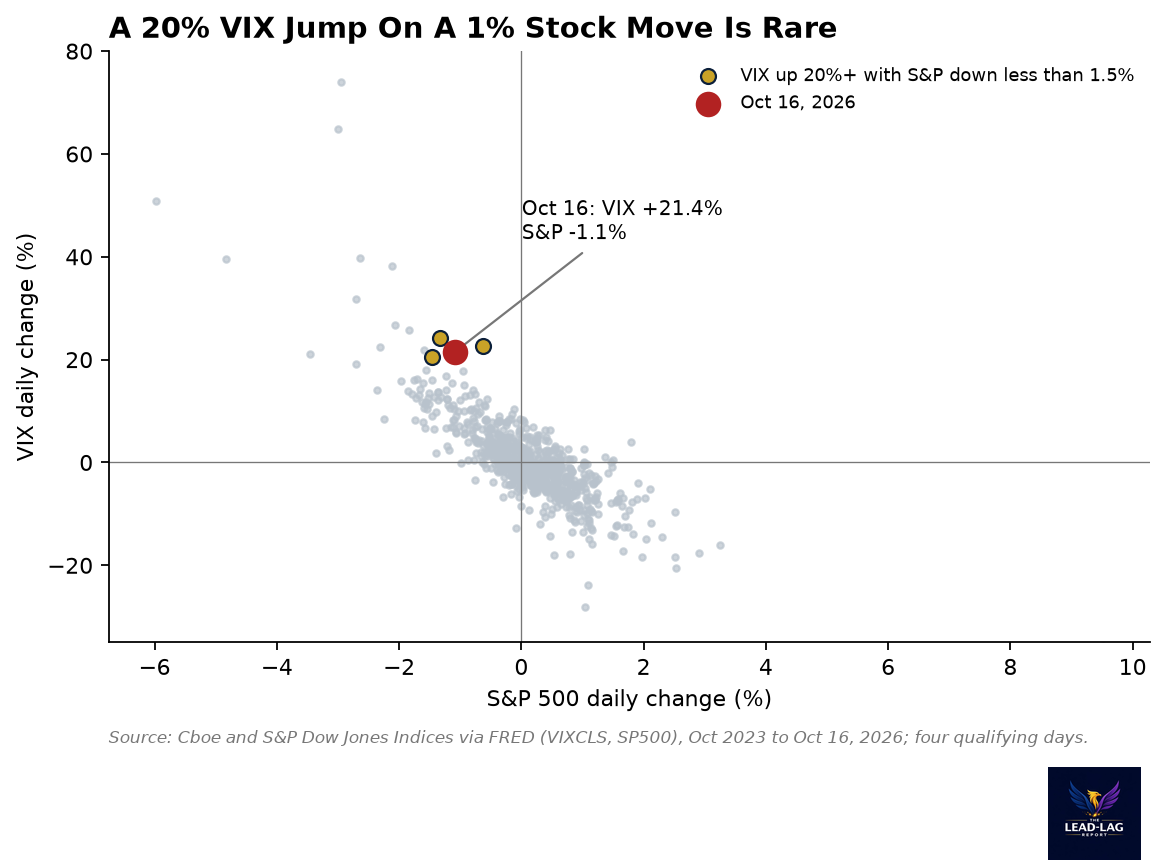
History does not resolve this. After the first three such days, the S&P 500 was down 0.95% (2025-01-27), up 1.64% (2025-10-16) and down 1.90% (2026-03-06) twenty sessions later.[2] Three observations is a description, not a signal, and we do not offer it as one.
What would change the read
Three things would turn this from a divergence into a regime. High yield spreads holding above Friday's 3.31 would show the move is not a one-day reaction to the options market. Investment grade spreads beginning to follow would show the discount rate, not credit quality, is the driver. And the S&P 500 closing below its recent range would show equities finally accepting what credit has priced.
For allocators, the practical question is where low-quality credit risk sits inside a portfolio: in high yield sleeves, in equities tied to leveraged balance sheets, and in income products that reach for yield. The market is already treating strong and weak borrowers differently. A portfolio that treats all credit risk as a single exposure is not.
Few understand this.
* * *
Notes
[1] Cboe Volatility Index, daily close, Federal Reserve Bank of St. Louis (FRED), series VIXCLS: https://fred.stlouisfed.org/series/VIXCLS. VIX close 19.99 on 2026-10-16 versus 16.46 on 2026-10-15 (+21.4%). Sixteen daily gains of 20% or more between October 2023 and October 16, 2026; four with an S&P 500 decline smaller than 1.5%.
[2] S&P 500, daily close, S&P Dow Jones Indices via FRED, series SP500: https://fred.stlouisfed.org/series/SP500. Closes: 7,659.44 (Oct 16), 7,690.73 (Oct 19), 7,818.93 (Oct 6, 52-week closing high in the data window), 7,764.64 (Sep 22), 7,666.45 (Oct 1). Forward returns computed as 20-session closing changes.
[3] ICE BofA US High Yield Index Option-Adjusted Spread, FRED series BAMLH0A0HYM2: https://fred.stlouisfed.org/series/BAMLH0A0HYM2. 2.60 (Aug 28), 2.68 (Sep 22), 3.24 (Oct 1), 3.31 (Oct 16). FRED publishes about three years of this series, so the three-year statistics (median 3.02, high 4.61 on April 7, 2025) use that window.
[4] ICE BofA US Corporate Index Option-Adjusted Spread, FRED series BAMLC0A0CM: https://fred.stlouisfed.org/series/BAMLC0A0CM. 0.79 (Aug 28), 0.77 (Sep 22), 0.86 (Oct 1), 0.85 (Oct 16).
[5] Market Yield on U.S. Treasury Securities at 10-Year Constant Maturity, FRED series DGS10: https://fred.stlouisfed.org/series/DGS10. 5.09% on Oct 16.
[6] Market Yield on U.S. Treasury Securities at 2-Year Constant Maturity, FRED series DGS2: https://fred.stlouisfed.org/series/DGS2. 4.74% on Oct 16; the 10-year minus 2-year spread (T10Y2Y) was 0.35 on that date.
The Lead-Lag Report is provided by Lead-Lag Publishing, LLC. All opinions and views mentioned in this report constitute our judgments as of the date of writing and are subject to change at any time. Information within this material is not intended to be used as a primary basis for investment decisions and should also not be construed as advice meeting the particular investment needs of any individual investor. Trading signals produced by the Lead-Lag Report are independent of other services provided by Lead-Lag Publishing, LLC or its affiliates, and positioning of accounts under their management may differ. Please remember that investing involves risk, including loss of principal, and past performance may not be indicative of future results. Lead-Lag Publishing, LLC, its members, officers, directors and employees expressly disclaim all liability in respect to actions taken based on any or all of the information on this writing.