
The Gold Signal Equity Markets Refuse to Hear
Central banks bought 243.7 tonnes of gold in Q1 2026, only about 16 tonnes were officially reported. Real yields at 2.44 percent sit at 2008 highs while gold prints records. The old model of gold as anti-real-yield has stopped working. The buyers are not who the equity crowd thinks.

This Lead-Lag Report post is sponsored by Columbia Threadneedle
What if you could target only the strongest performers in an index?
Columbia Research Enhanced Core ETF (RECS) leverages the firm's quantitative research by investing in the highest-rated stocks from the Russell 1000. The result is an ETF with reduced drag and enhanced return potential at an attractive price point.
Potential benefits of RECS:
- Aims to optimize core equity exposure
- Sector-neutral to the Russell 1000
- Competitive expense ratio of 15 basis points1
1 Net and gross expense ratio. The fund's expense ratio is from the most recent prospectus.
Investors should carefully consider the investment objectives, risks, charges and expenses of the Fund before investing. To obtain a prospectus containing this and other important information, please visit columbiathreadneedleus.com/etf to view or download a prospectus. Read the prospectus carefully before investing.
Investing involves risks, including the risk of loss of principal. Market risk may affect a single issuer, sector of the economy, industry or the market as a whole. The fund is passively managed and seeks to track the performance of an index. There is no guarantee that the index and, correspondingly, the fund will achieve positive returns. Risk exists that the index provider may not follow its methodology for index construction. Errors may result in a negative fund performance. The fund's net asset value will generally decline when the market value of its targeted index declines. The fund concentrates its investments in issuers of one or more particular industries to the same extent as the underlying index. Investments in a narrowly focused sector may exhibit higher volatility than investments with a broader focus. Investments selected using quantitative methods may perform differently from the market as a whole and may not enable the fund to achieve its objective. Investment in larger companies may involve certain risks associated with their larger size and may be less able to respond quickly to new competitive challenges than smaller competitors. Investments in mid-cap companies often involve greater risks that investments in larger companies and may have less predictable earning and be less liquid than the securities in larger firms. Growth securities, at times, may not perform as well as value securities or the stock market in general and may be out of favor with investors. Value securities may be unprofitable if the market fails to recognize their intrinsic worth or the portfolio manager misgauged that worth. Although the fund's shares are listed on an exchange, there can be no assurance that an active, liquid or otherwise orderly trading market for shares will be established or maintained. The Fund may have portfolio turnover, which may cause an adverse cost impact. There may be additional portfolio turnover risk as active market trading of the fund's shares may cause more frequent creation or redemption activities that could, in certain circumstances, increase the number of portfolio transactions as well as tracking error to the Index and high levels of transactions increase brokerage and other transaction costs and may result in increased taxable capital gains.
ETF shares are bought and sold at market price (not NAV) and are not individually redeemable. Investors buy and sell shares on a secondary market. Shares may trade at a premium or discount to the NAV. Only market makers or "authorized participants" may trade directly with the Fund(s), typically in blocks of 50,000 shares.
Shares are not FDIC insured, may lose value, and have no bank guarantee.
For broker/dealer or institutional use only.
The ETFs are distributed by ALPS Distributors, Inc. Columbia Management Investment Advisers, LLC serves as the investment manager. Columbia Threadneedle Investments is the global brand name of the Columbia and Threadneedle group of companies.
DISCLAIMER – PLEASE READ: This is sponsored advertising content for which Lead-Lag Publishing, LLC has been paid a fee. The information provided in the link is solely the creation of Columbia Threadneedle. Lead-Lag Publishing, LLC does not guarantee the accuracy or completeness of the information provided in the link or make any representation as to its quality. All statements and expressions provided in the link are the sole opinion of Columbia Threadneedle and Lead-Lag Publishing, LLC expressly disclaims any responsibility for action taken in connection with the information provided in the link.
Key Highlights
- Central banks bought a net 244 tonnes of gold in Q1 2026, but only about 16 tonnes were officially reported at time of publication. The actual official-sector flow is roughly fifteen times larger than what appears in reserve reports.
- Ten of the last eleven quarters have seen net official-sector purchases above 200 tonnes. The four-year cumulative total is well above the 2010-2021 average of 473 tonnes per year.
- U.S. real yields sit at 2.01% at five years, 2.31% at ten years, and 2.87% at thirty years as of the 17 July 2026 close, roughly double the ten-year average of 0.9%.
- The 23 July 2026 auction of new ten-year TIPS cleared at a real yield of 2.438%, the highest for that term at auction since October 2008. Under the pre-2022 pricing framework, gold has no business trading near a record at these yields.
- Gold traded around $4,024 per ounce on 29 July 2026, roughly $791 higher than a year ago and about a quarter off the 29 January 2026 record near $5,595. The 30-day rolling correlation with real yields has collapsed toward zero from a multi-year baseline near negative 0.45.
- COMEX positioning for the week ending 24 July 2026: managed money net long 124,831 contracts, swap dealers net short 193,878, producers and merchants net short 19,321, open interest 371,776. Total COMEX net longs rebounded 16% month over month to 538 tonnes, the highest month-end reading since January.
- Shanghai gold traded at a $23.87 per ounce premium to London (0.51%) in late April 2026, a four-week high. J.P. Morgan estimated 317 tonnes of Chinese net imports in Q1 2026.
- The marginal buyer of gold is not the retail cohort the consensus narrative names. Reserve managers running multi-decade diversification mandates are structurally price-insensitive over any horizon a trader watches, and their flow is largely invisible to standard equity macro frameworks.
Every market has a price it treats as a thermometer and a price it treats as noise. Equity investors treat credit spreads, the dollar and the front end of the curve as thermometers. Gold gets filed under noise: a sentiment gauge, a geopolitical barometer, a thing retail investors chase when headlines get loud. That filing was defensible for three decades. It is no longer defensible, and the reason has nothing to do with sentiment.
Gold set its modern record near $5,595 an ounce on 29 January 2026, then gave back roughly a quarter of that advance over the following five months and was trading around $4,024 an ounce on 29 July 2026, before rising about 2% after the Federal Reserve held rates steady.[1] The consensus read that sequence as confirmation of its own framework. Speculative froth built, geopolitics provided the excuse, the froth came out, and the story is over. The problem is that the cohort which did the selling and the cohort which sets the marginal price are not the same cohort, and the data separating them has been published every quarter for four years.
The Story Everyone Is Telling
The consensus narrative has two pillars. The first is that record gold reflects retail speculation, the same crowd behaviour that shows up in single-stock options and leveraged products. The second is that gold is a geopolitical hedge, so the price is a proxy for whatever conflict is on the front page in a given week. Both pillars have evidence behind them. Bar and coin demand jumped 42% year over year to 474 tonnes in the first quarter of 2026, the second-highest quarterly total on record, and total demand value hit a record US$193 billion.[2] Retail participation is real, and it is loud.
What the narrative cannot explain is direction of causality. If retail were the marginal price setter, the first-half correction should have taken official-sector demand with it, because falling prices normally break the momentum story that pulls discretionary money in. That is not what happened. The official sector bought more, not less, as the price fell. And the cohort that behaved exactly as the consensus framework predicts is the cohort the consensus insists is driving the market, which is a contradiction rather than a thesis.
None of what follows requires a forecast. Every number in it has already been published by a central bank, a regulator, or an exchange.
The Marginal Buyer Does Not Watch the Rate Screen
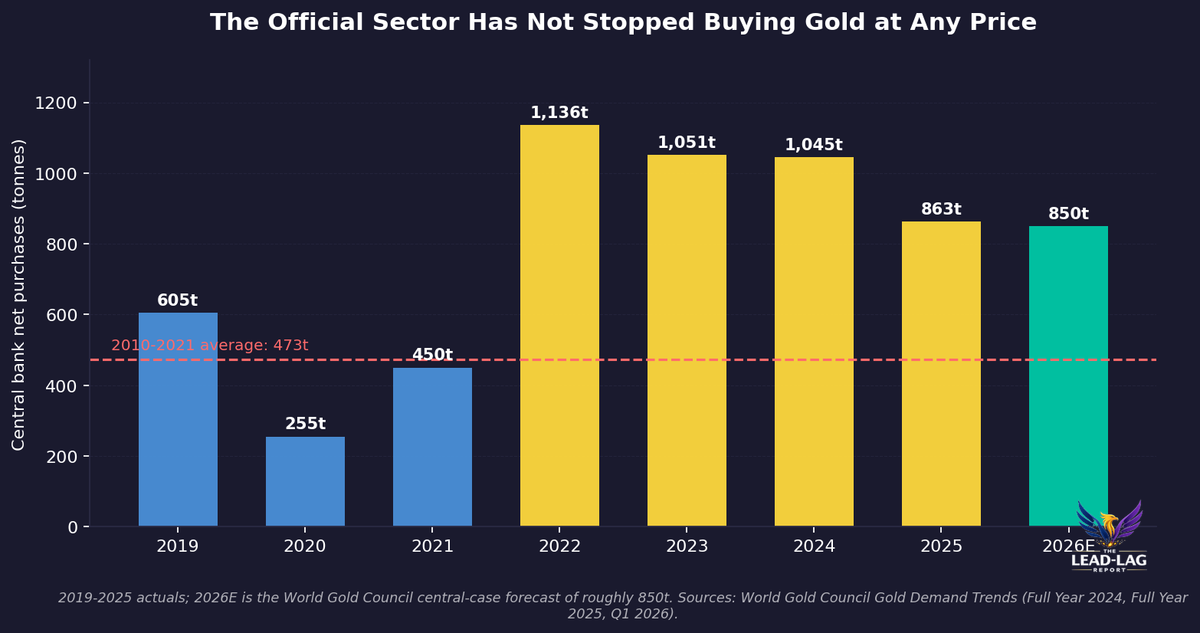
Central banks added a net 244 tonnes of gold in the first quarter of 2026, up 3% year over year and 17% from the prior quarter, exceeding both the previous quarter and the five-year average. That marks ten of the last eleven quarters above 200 tonnes.[3] The National Bank of Poland led with 31 tonnes, lifting reserves to 582 tonnes against a stated 700-tonne objective. The Central Bank of Uzbekistan added 25 tonnes, taking gold to 87% of total reserves. The People's Bank of China added 7 tonnes in the quarter, then a further 14.93 tonnes in June, its twentieth consecutive month of accumulation and its largest single-month addition since October 2023, bringing reserves to roughly 2,346 tonnes.[4]
This is a four-year pattern, not a quarter. Net official-sector purchases ran 1,136 tonnes in 2022, the highest since records began in 1950, then 1,051 tonnes in 2023 and 1,045 tonnes in 2024. Even the 2025 slowdown to 863 tonnes came in 82% above the 473-tonne annual average of 2010 to 2021.[5] The World Gold Council's central case for 2026 sits near 850 tonnes. Reserve managers running a multi-decade diversification mandate are structurally price-insensitive over any horizon a trader cares about. They are not expressing a view on the next inflation print. They are reducing the share of their reserves denominated in a single sovereign's liabilities.
There is a measurement problem that flatters the consensus view. Of the 244 tonnes estimated for the first quarter, only about 16 tonnes had been officially reported at the time of publication; the rest is estimated from London over-the-counter market data and trade statistics.[6] An investor who tracks only reported reserve changes sees a trickle. The actual flow is roughly fifteen times larger. That gap is why the marginal buyer stays invisible to most equity-side macro frameworks, and why the resulting price action looks unexplained rather than explained.
The Divergence That Is Not Supposed to Exist
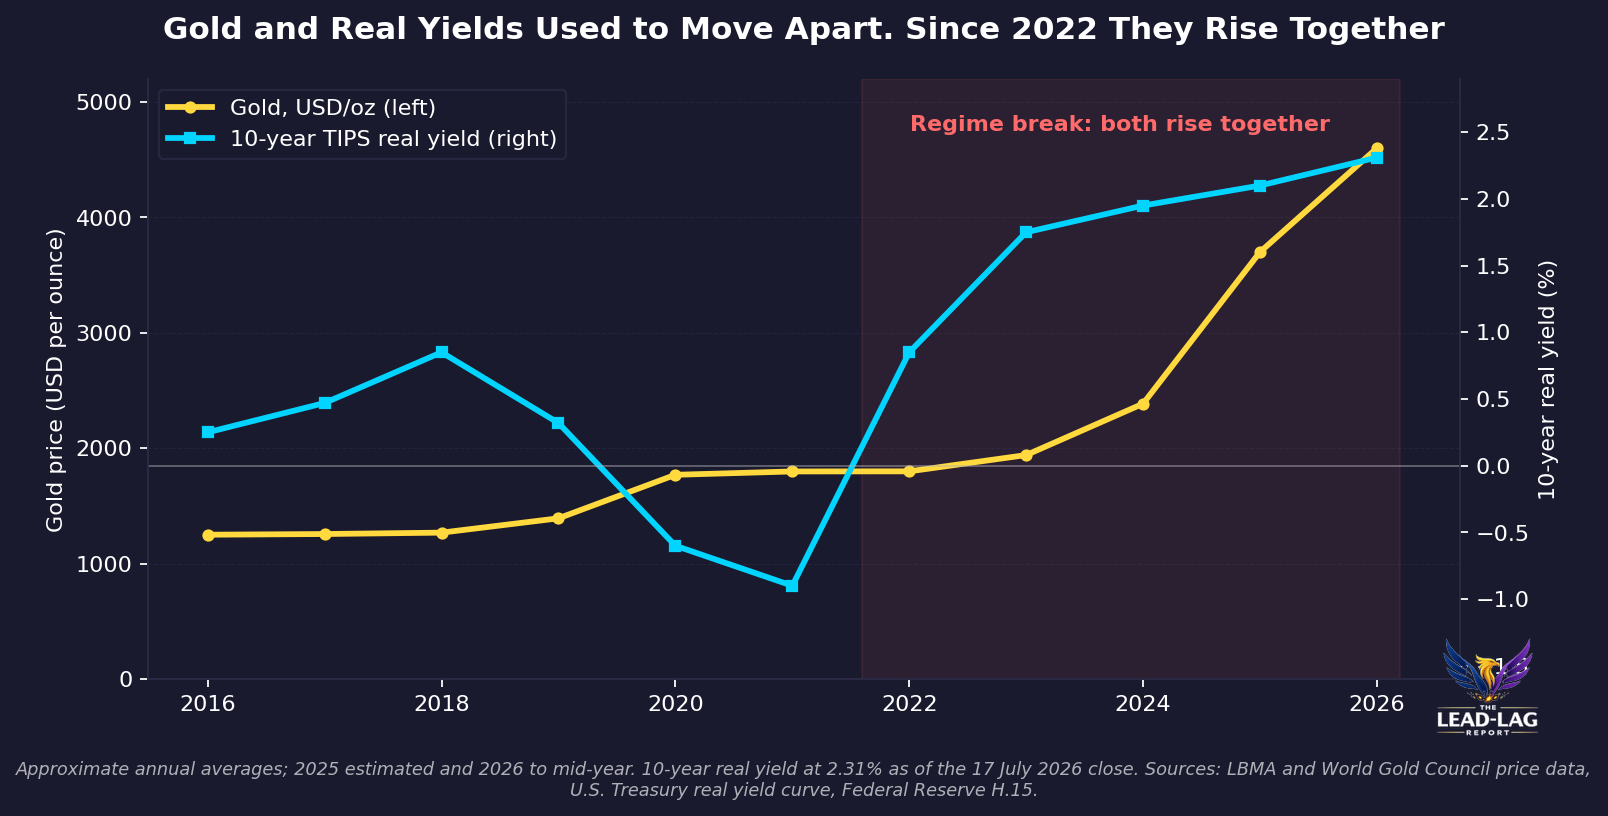
The textbook relationship is mechanical. Gold pays no coupon, so its opportunity cost is the real yield on inflation-protected Treasuries. Higher real yields, lower gold. That relationship held tightly enough for two decades to become an identity in most cross-asset models. It stopped working in 2022 and has not resumed.
Consider where real yields actually are. As of the 17 July 2026 close, Treasury real yields stood at 2.01% at five years, 2.31% at ten years and 2.87% at thirty years, roughly double the ten-year average of about 0.9%.[7] On 23 July the Treasury auctioned a new ten-year TIPS at a real yield of 2.438%, the highest at auction for that term since October 2008.[8] Under the pre-2022 framework, a 2.4% real yield is an environment in which gold has no business being within a thousand dollars of a record. Yet the metal is roughly $791 higher than it was a year ago, and market commentary tracking the relationship has documented the 30-day gold to real-yield correlation collapsing toward zero from a multi-year baseline closer to negative 0.45.[9]
A broken correlation is either a temporary dislocation or a change in the pricing function. Four years is too long to be a dislocation. The more coherent reading is that the identity of the marginal buyer changed, and with it the variable that clears the market. When the buyer is a leveraged fund financing a position, the real yield is the whole trade. When the buyer is a reserve manager swapping one reserve asset for another, the real yield is not in the decision at all. The price is now being set at the margin by an actor for whom carry is irrelevant.
What the Paper Market Actually Shows
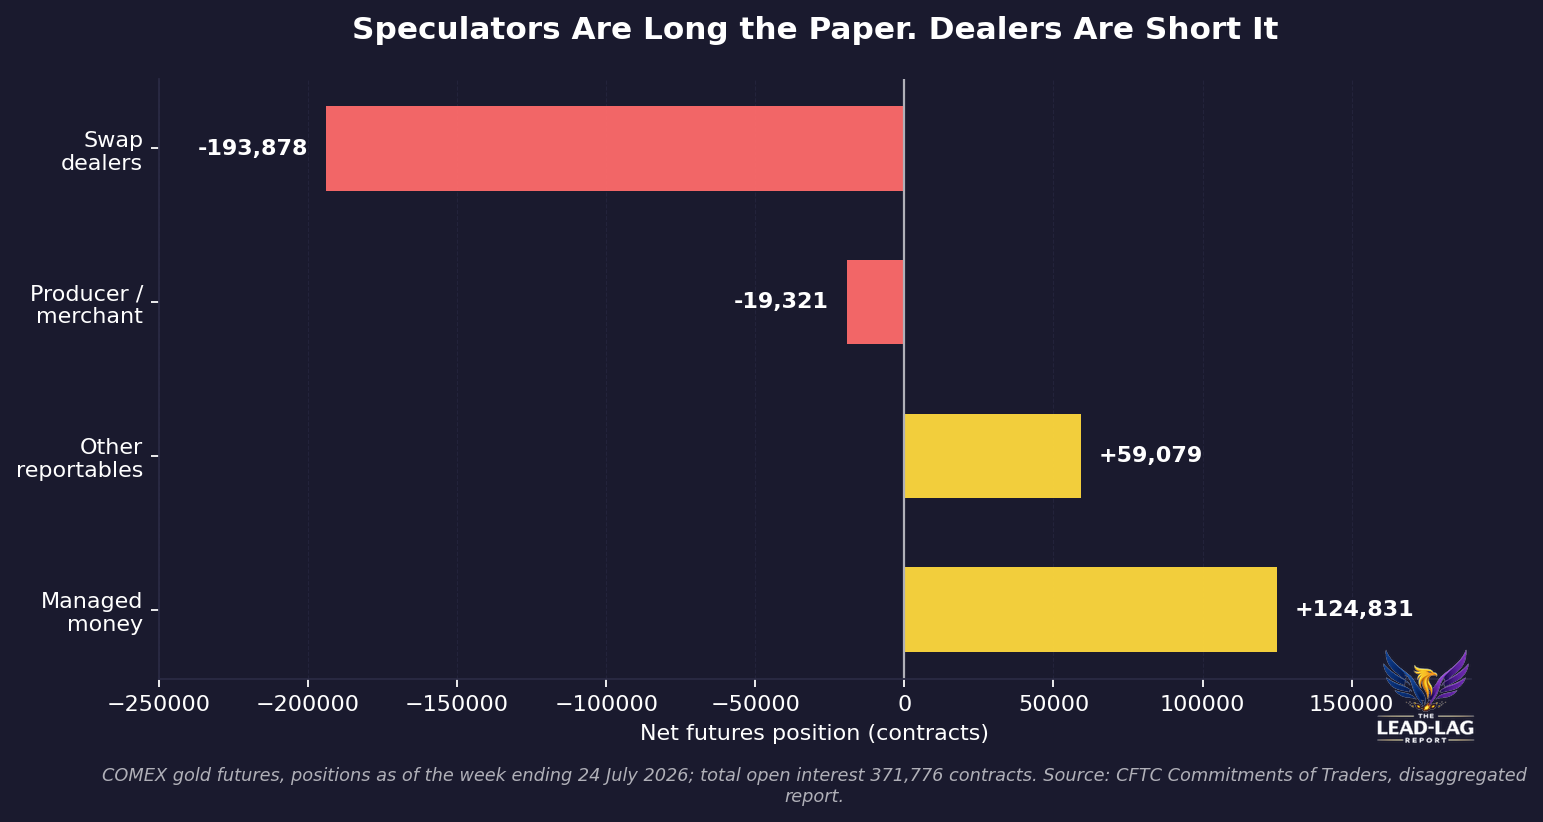
The positioning data cuts against the retail-froth story with unusual clarity. In COMEX gold futures for the week ending 24 July 2026, managed money held a net long of 124,831 contracts against total open interest of 371,776, while swap dealers sat net short 193,878 contracts and producers and merchants net short 19,321.[10] That is the ordinary architecture of a futures market: speculative length facilitated by commercial and dealer shorts. It is a crowded long, and it deserves respect as a source of liquidation risk. It is not evidence that speculators are setting the level.
The cohort breakdown is where the consensus loses the argument. The World Gold Council's June review noted that total COMEX net longs rebounded 16% month over month to 538 tonnes, the highest month-end reading since January, with managed money net longs rising through June even as the price weakened. Non-reportable positions, the closest available proxy for retail, went the other way and reduced, while other reportables added 16%. Across the first half, managed money net longs fell by only 43 tonnes.[11] Retail chased the tape. Larger accounts held. Neither pattern supports the claim that the price is a retail artifact.
The physical market tells the same story in a different currency. Chinese premiums have persisted through the correction, with the Shanghai premium reaching a four-week high of about $23.87 an ounce, roughly 0.51% over the London benchmark, in late April, while J.P. Morgan put Chinese net imports at 317 tonnes in the first quarter.[12] Renminbi-denominated pricing also demonstrated that the dollar price is not the only price: in February the LBMA benchmark in dollars rose 4.8% while the Shanghai benchmark in renminbi fell 1.3%, a divergence driven by currency rather than metal.[13] An investor who monitors only the dollar gold price is watching one translation of a market that now clears in several.
Two Buyers, One Price, and the Equity Implication
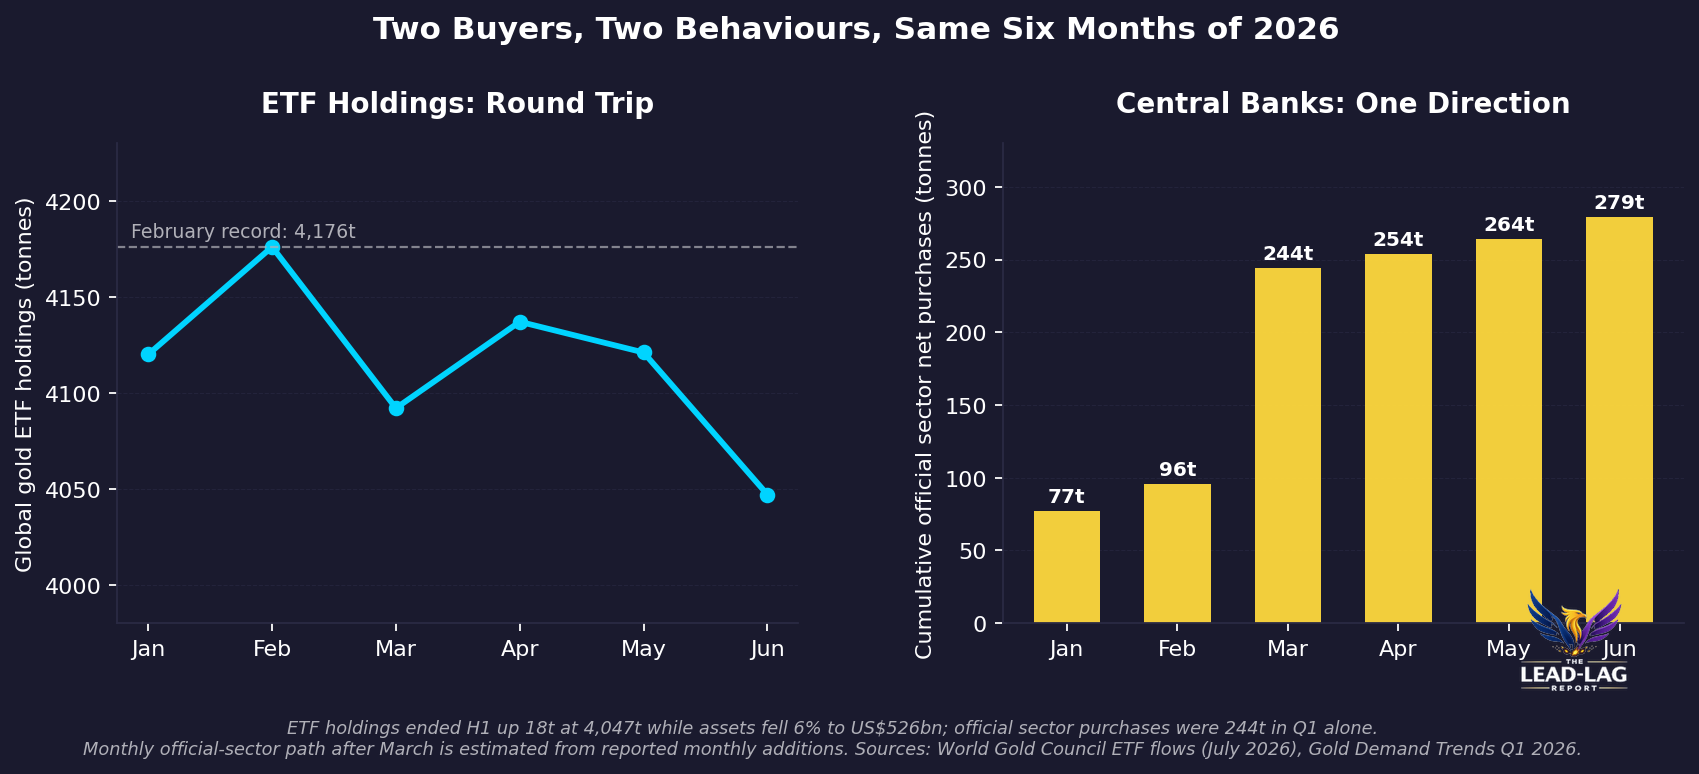
The exchange-traded fund complex is the cleanest available measurement of price-sensitive Western demand, and it behaved exactly as price-sensitive demand behaves. Holdings peaked at a record 4,176 tonnes in February, fell hard in March when United States funds recorded record monthly outflows of 85 tonnes, recovered in April, and ended the first half at 4,047 tonnes, a gain of only 18 tonnes for the six months, with assets under management down 6% to US$526 billion and a US$8.9 billion outflow in June alone.[14] Standard Chartered estimated in late June that roughly 298 tonnes of ETF gold was held at a loss around the $4,000 level, up from 270 tonnes when the price was above $4,250.[15] That is a supply of impatient holders sitting on top of a market whose structural bid is indifferent to price.
Set those two behaviours side by side. Over the same six months, the discretionary cohort added 18 tonnes and the official sector added 244 tonnes in the first quarter alone, at an estimated cost near US$37 billion, the highest quarterly value on record.[16] The marginal buyer is not the one on financial television. It is a reserve manager executing a mandate that does not reference the S&P 500, the Federal Reserve's dot plot, or the level of real yields.
The equity implication is the part that has not been priced. If sovereign reserve managers are steadily converting claims on one sovereign into a neutral asset while real yields sit at 2008 highs, the signal is about the perceived quality of the collateral underpinning global portfolios, not about inflation or conflict. Equity risk premia are calculated off a risk-free rate that is assumed to be genuinely risk-free. Gold at these levels alongside real yields at these levels is a market-based statement that a large class of institutional holders is quietly discounting that assumption. That is a discount-rate question, and discount-rate questions arrive in equity multiples with a lag.
The positioning framing follows from the diagnosis rather than the price. If the regime break is real, exposure to the assets whose valuation depends most on a stable risk-free anchor carries a risk that historical correlations understate, and the asymmetry favours holding the neutral reserve asset through drawdowns rather than trading it against the rate screen. If the regime break is not real, the divergence should close as the correlation reasserts itself.
Which is why the thesis needs a falsification test rather than a target. Two conditions would break it. First, official-sector net purchases falling below 150 tonnes in a quarter, which would mean the price-insensitive bid has turned price-sensitive after all. Second, the 90-day rolling correlation between gold returns and 10-year real yield changes returning below negative 0.40 and staying there for a full quarter, which would mean the old pricing function survived and the last four years were an unusually long anomaly. Neither condition has been met.
Consensus is arguing about why retail investors like gold. The relevant question is why the institutions that issue and hold the world's reserve assets keep converting them into something no government can print, and why equity markets have decided that question is noise.
Few understand this.
Notes
- CNBC, "The Price of Gold Today, July 29, 2026" (spot $4,023.91 per ounce at 9:00 a.m. ET, 29 July 2026), https://www.cnbc.com/select/the-price-of-gold-today-july-29-2026/; Reuters, "Gold rises 2% as Fed holds rates steady," 29 July 2026, https://www.reuters.com/world/asia-pacific/gold-edges-lower-ahead-fed-decision-interest-rates-2026-07-29/; record intraday spot high of $5,595.47 on 29 January 2026 and the roughly 28% drawdown as of 13 July 2026 per GoldSilver, "Gold Price Outlook July 2026," https://goldsilver.com/industry-news/article/gold-price-outlook-july-2026/. Year-over-year gain of $791 per ounce per Fortune, "Current price of gold: July 29, 2026," https://fortune.com/article/current-price-of-gold-07-29-2026/.
- World Gold Council, Gold Demand Trends Q1 2026 (bar and coin demand 474t, up 42% year over year; total demand value a record US$193bn, up 74%), https://www.gold.org/goldhub/research/gold-demand-trends/gold-demand-trends-q1-2026.
- World Gold Council, Gold Demand Trends Q1 2026, Central Banks section (net purchases of 243.7t, up 17% quarter over quarter and 3% year over year; quarterly series Q1 2025 237.0t, Q2 2025 179.3t, Q3 2025 226.3t, Q4 2025 207.6t), https://www.gold.org/goldhub/research/gold-demand-trends/gold-demand-trends-q1-2026/central-banks.
- World Gold Council, Gold Demand Trends Q1 2026, Central Banks section (Poland 31t to 582t, Uzbekistan 25t to 416t at 87% of reserves, People's Bank of China 7t to 2,313t), https://www.gold.org/goldhub/research/gold-demand-trends/gold-demand-trends-q1-2026/central-banks; June 2026 addition of 14.93t, twentieth consecutive month and largest single month since October 2023, taking reserves to roughly 2,346t, per GoldSilver, "Gold Price Outlook July 2026," https://goldsilver.com/industry-news/article/gold-price-outlook-july-2026/.
- Reuters, "Central banks bought the most gold on record last year, WGC says" (1,136t in 2022, highest in records back to 1950), https://www.reuters.com/markets/commodities/central-banks-bought-most-gold-since-1967-last-year-wgc-says-2023-01-31/; World Gold Council, Gold Demand Trends Full Year 2024, Central Banks section (1,050.8t in 2023 and 1,044.6t in 2024; 473t average 2010-2021), https://www.gold.org/goldhub/research/gold-demand-trends/gold-demand-trends-full-year-2024/central-banks; 2025 total of 863.3t and the 82% premium to the 2010-2021 average per GoldSilver, "Central Bank Gold Reserves," https://goldsilver.com/learn/how-money-works/central-bank-gold-reserves/.
- World Gold Council methodology as summarised in coverage of Gold Demand Trends Q1 2026: approximately 16t officially reported against an estimated 244t of net purchases, with the balance estimated from London over-the-counter market data and trade statistics, https://www.gold.org/goldhub/research/gold-demand-trends/gold-demand-trends-q1-2026/central-banks.
- U.S. Treasury Daily Par Real Yield Curve Rates as of the 17 July 2026 close (2.01% at five years, 2.31% at ten years, 2.87% at thirty years) and the roughly 0.9% ten-year average, reported by TheStreet, 20 July 2026, https://www.thestreet.com/investing/tips-inflation-protected-security-bond-real-yields-2026-retirement. Federal Reserve H.15 Selected Interest Rates showed the ten-year inflation-indexed yield between 2.24% and 2.30% in early July 2026, https://www.federalreserve.gov/releases/h15/.
- Tipswatch, "10-year TIPS auction gets real yield of 2.438%," 23 July 2026 (highest at auction for the term since October 2008), https://tipswatch.com/2026/07/23/10-year-tips-auction-gets-real-yield-of-2-438-a-great-result-for-investors/.
- Commentary tracking the gold to real-yield relationship documents the 30-day rolling correlation collapsing toward zero against a multi-year baseline near negative 0.45, and the ten-year TIPS yield reaching as high as 2.2% over the prior twelve months without suppressing gold: https://ahasignals.com/gold-real-yield-divergence-tracker/ and https://www.xnce.com/en/market-news/gold-real-rates-decorrelation.
- CFTC Commitments of Traders, disaggregated COMEX gold futures, week ending 24 July 2026, as compiled by Arc Research (managed money net long 124,831 contracts; swap dealers net short 193,878; producers and merchants net short 19,321; open interest 371,776), https://www.getarcresearch.com/commodities/gold/cot/2026-07-24.
- World Gold Council, Gold ETF Flows: June 2026 (total COMEX net longs up 16% month over month to 538t, highest month-end since January; managed money net longs rising since early June; non-reportable positions reduced while other reportables rose 16%; managed money net longs down only 43t year to date), https://www.gold.org/goldhub/research/gold-etfs-holdings-and-flows/2026/07.
- Shanghai premium of $23.87 per ounce, or 0.51% over the London benchmark, a four-week high in late April 2026, https://inproved.com/gold-s-quiet-rebuild-comex-outflows-shanghai-strength-and-premiums-firming-above-lbma/; J.P. Morgan estimate of 317t of Chinese net imports in Q1 2026 as reported in Golden Ark Reserve's weekly gold market note, https://goldenarkreserve.com/blog/gold-market-note-2026-w27/.
- World Gold Council, China gold market update, March 2026 (LBMA Gold Price PM in USD rose 4.8% in February while the Shanghai Gold Benchmark Price PM in renminbi fell 1.3%, largely on a 1.4% renminbi appreciation), https://www.gold.org/goldhub/gold-focus/2026/03/china-gold-market-update-resilient-demand-festive-month.
- World Gold Council gold ETF flow data via Nasdaq, "WGC: Global Gold ETF Flows Remain Positive in H1 2026" (June outflows of US$8.9bn; H1 flows positive at US$8bn; assets under management down 6% to US$526bn; holdings up 18t to 4,047t), https://www.nasdaq.com/articles/wgc-global-gold-etf-flows-remain-positive-h1-2026; United States funds' record monthly outflow of 85t in March 2026 per World Gold Council, Gold Demand Trends US Focus Q1 2026, https://www.gold.org/goldhub/research/gold-demand-trends/gold-demand-trends-us-focus-q1-2026; February record holdings of 4,176t and April net inflows of 45t per World Gold Council monthly ETF commentary, https://www.gold.org/goldhub/data/gold-etfs-holdings-and-flows.
- Standard Chartered estimate of approximately 298t of ETF gold held at a loss near $4,000, up from 270t above $4,250, in a 24 June 2026 research note as reported by GoldSilver, https://goldsilver.com/industry-news/goldsilver-news/gold-etf-outflows-central-bank-buying-divergence-2026/.
- First-quarter 2026 official-sector purchases valued near US$37bn, the highest quarterly value on record, based on World Gold Council tonnage and average quarterly LBMA pricing, https://www.gold.org/goldhub/research/gold-demand-trends/gold-demand-trends-q1-2026.



