
The Jobs Report Nobody Is Reading Right
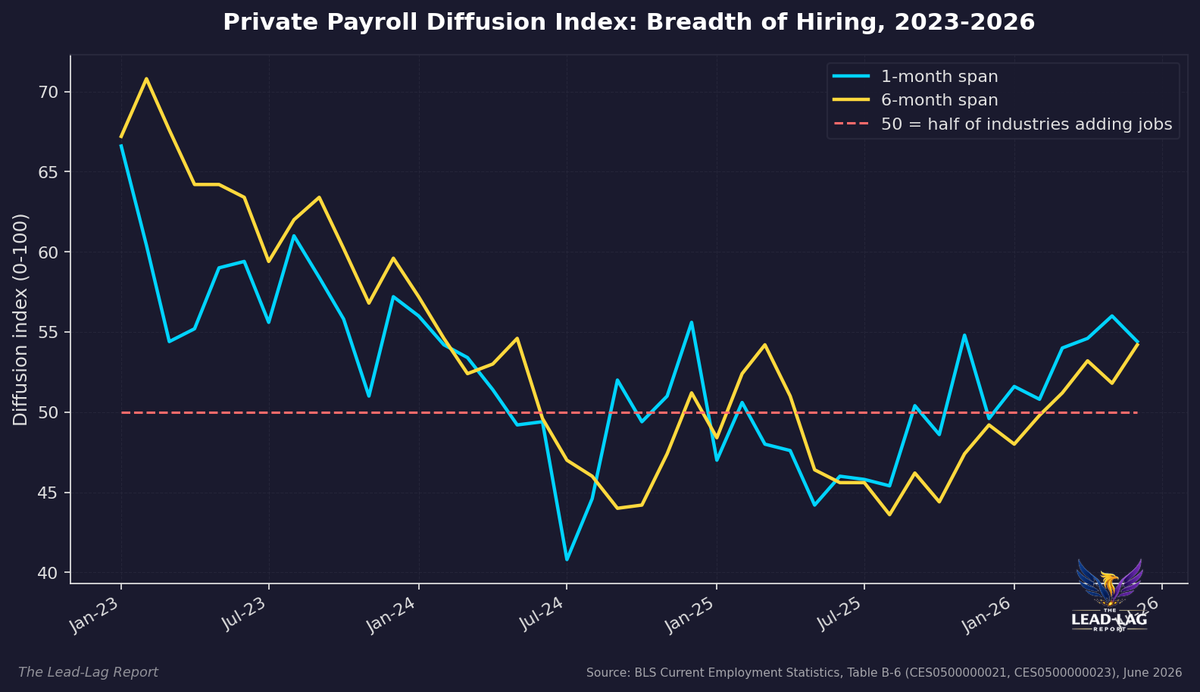
The BLS diffusion index printed 54.4 in June 2026, identical to the full-year 2007 average. Payroll breadth spent nine of twelve months of 2025 below 50. One industry, health care, is generating 86 percent of net US job growth. Every one of those facts is public. Almost nobody is quoting them.

This Lead-Lag Report post is sponsored by Columbia Threadneedle
What if you could target only the strongest performers in an index?
Columbia Research Enhanced Core ETF (RECS) leverages the firm's quantitative research by investing in the highest-rated stocks from the Russell 1000. The result is an ETF with reduced drag and enhanced return potential at an attractive price point.
Potential benefits of RECS:
- Aims to optimize core equity exposure
- Sector-neutral to the Russell 1000
- Competitive expense ratio of 15 basis points1
1 Net and gross expense ratio. The fund's expense ratio is from the most recent prospectus.
Investors should carefully consider the investment objectives, risks, charges and expenses of the Fund before investing. To obtain a prospectus containing this and other important information, please visit columbiathreadneedleus.com/etf to view or download a prospectus. Read the prospectus carefully before investing.
Investing involves risks, including the risk of loss of principal. Market risk may affect a single issuer, sector of the economy, industry or the market as a whole. The fund is passively managed and seeks to track the performance of an index. There is no guarantee that the index and, correspondingly, the fund will achieve positive returns. Risk exists that the index provider may not follow its methodology for index construction. Errors may result in a negative fund performance. The fund's net asset value will generally decline when the market value of its targeted index declines. The fund concentrates its investments in issuers of one or more particular industries to the same extent as the underlying index. Investments in a narrowly focused sector may exhibit higher volatility than investments with a broader focus. Investments selected using quantitative methods may perform differently from the market as a whole and may not enable the fund to achieve its objective. Investment in larger companies may involve certain risks associated with their larger size and may be less able to respond quickly to new competitive challenges than smaller competitors. Investments in mid-cap companies often involve greater risks that investments in larger companies and may have less predictable earning and be less liquid than the securities in larger firms. Growth securities, at times, may not perform as well as value securities or the stock market in general and may be out of favor with investors. Value securities may be unprofitable if the market fails to recognize their intrinsic worth or the portfolio manager misgauged that worth. Although the fund's shares are listed on an exchange, there can be no assurance that an active, liquid or otherwise orderly trading market for shares will be established or maintained. The Fund may have portfolio turnover, which may cause an adverse cost impact. There may be additional portfolio turnover risk as active market trading of the fund's shares may cause more frequent creation or redemption activities that could, in certain circumstances, increase the number of portfolio transactions as well as tracking error to the Index and high levels of transactions increase brokerage and other transaction costs and may result in increased taxable capital gains.
ETF shares are bought and sold at market price (not NAV) and are not individually redeemable. Investors buy and sell shares on a secondary market. Shares may trade at a premium or discount to the NAV. Only market makers or "authorized participants" may trade directly with the Fund(s), typically in blocks of 50,000 shares.
Shares are not FDIC insured, may lose value, and have no bank guarantee.
For broker/dealer or institutional use only.
The ETFs are distributed by ALPS Distributors, Inc. Columbia Management Investment Advisers, LLC serves as the investment manager. Columbia Threadneedle Investments is the global brand name of the Columbia and Threadneedle group of companies.
DISCLAIMER – PLEASE READ: This is sponsored advertising content for which Lead-Lag Publishing, LLC has been paid a fee. The information provided in the link is solely the creation of Columbia Threadneedle. Lead-Lag Publishing, LLC does not guarantee the accuracy or completeness of the information provided in the link or make any representation as to its quality. All statements and expressions provided in the link are the sole opinion of Columbia Threadneedle and Lead-Lag Publishing, LLC expressly disclaims any responsibility for action taken in connection with the information provided in the link.
Key Highlights
- The BLS one-month diffusion index for private payrolls printed 54.4 in June 2026, identical to the full-year 2007 average of 54.4 and more than six points below the 2014-2019 expansion average of 60.8. [1][2]
- Payroll breadth spent nine of twelve months below 50 in 2025, averaging 48.2 for the year, the lowest annual average since 2003. [2]
- Total nonfarm employment rose only 506,000 in the twelve months to June 2026, and health care alone accounted for 437,500 of that, roughly 86 percent. [3][4]
- The quits rate sits at 1.9 percent and the hires rate at 3.3 percent, mobility levels last seen outside of a downturn in 2015. [5][6]
- The real-time Sahm indicator reads 0.07 against a 0.50 threshold, which is precisely why breadth, not the unemployment rate, is the variable that matters here. [7]
The June employment report was filed under solid. Nonfarm payrolls rose 57,000, the unemployment rate ticked down to 4.2 percent from 4.3 percent, and initial claims came in at 197,000 for the week ended July 25. [3][8][9] Every one of those numbers is accurate. Together they describe a labor market that does not exist.
The gap between the headline and the internals of this labor market is now the widest it has been in this cycle, and it is visible in a series the Bureau of Labor Statistics publishes every month that almost nobody quotes. The diffusion index measures how many industries are adding workers rather than how many workers are being added. It answers a different question than payrolls, and right now it is giving a different answer.
The Index Nobody Quotes
The BLS calculates diffusion indexes across 250 private industries in Table B-6 of the Employment Situation release. An industry that adds jobs counts as one, an unchanged industry counts as one half, and a shrinking industry counts as zero. A reading of 50 means half the economy is hiring and half is shedding. Anything above 50 is expansion by count, but the level matters far more than the sign. [1]
The one-month index printed 54.4 in June 2026, down from 56.0 in May. The three-month span read 56.2 and the six-month span 54.2. [2] Nothing there looks alarming on its own. The problem is what those numbers look like next to their own history, and against the size of the payroll gains they are supposed to be generating.
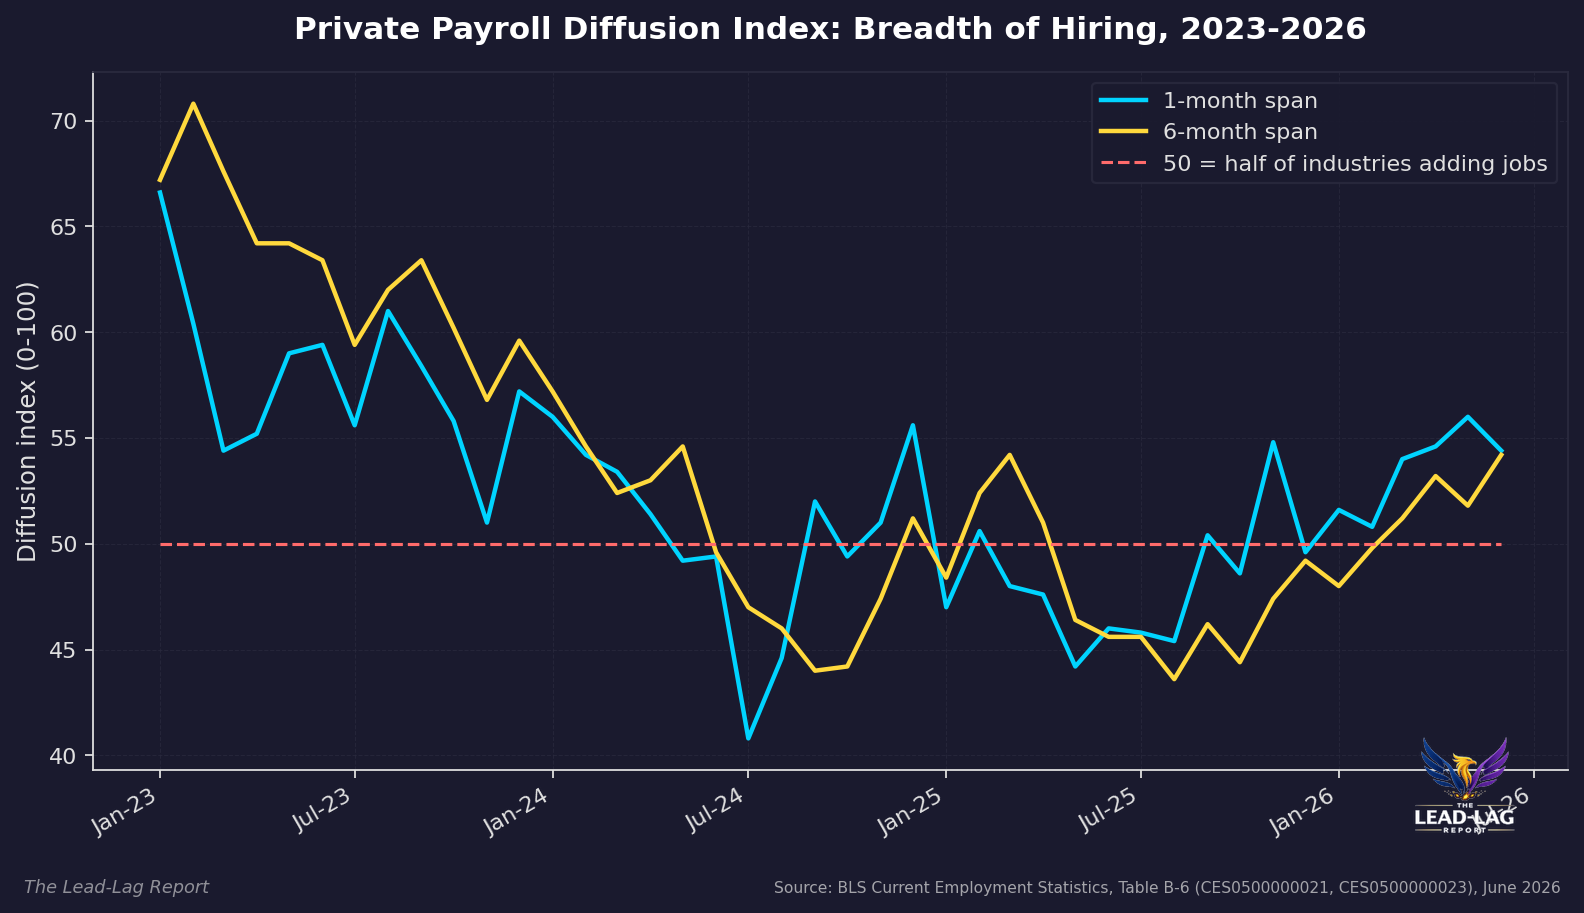
Breadth cracked in mid-2024, bottoming at 40.8 in July of that year, then spent 2025 grinding along under the waterline for nine of twelve months at a 48.2 annual average. [2] That is not a soft patch. The only other calendar years in which this index has averaged below 50 since the series began in 1991 are 1991, 2001, 2002, 2003, 2008 and 2009, every one of them a recession or immediate post-recession year. The 2026 recovery to a 53.6 year-to-date average is real, and it still leaves breadth below every full-year average recorded between 2004 and 2023.
The 2026 Reading Is the 2007 Reading
Here is the comparison that should stop the conversation about a strong labor market. The full-year 2007 average for the one-month diffusion index was 54.4. The June 2026 print was 54.4. [2] Averaged across the year in which a recession began that December, the 2007 economy was by the count of industries hiring exactly as broad as this one. [10]
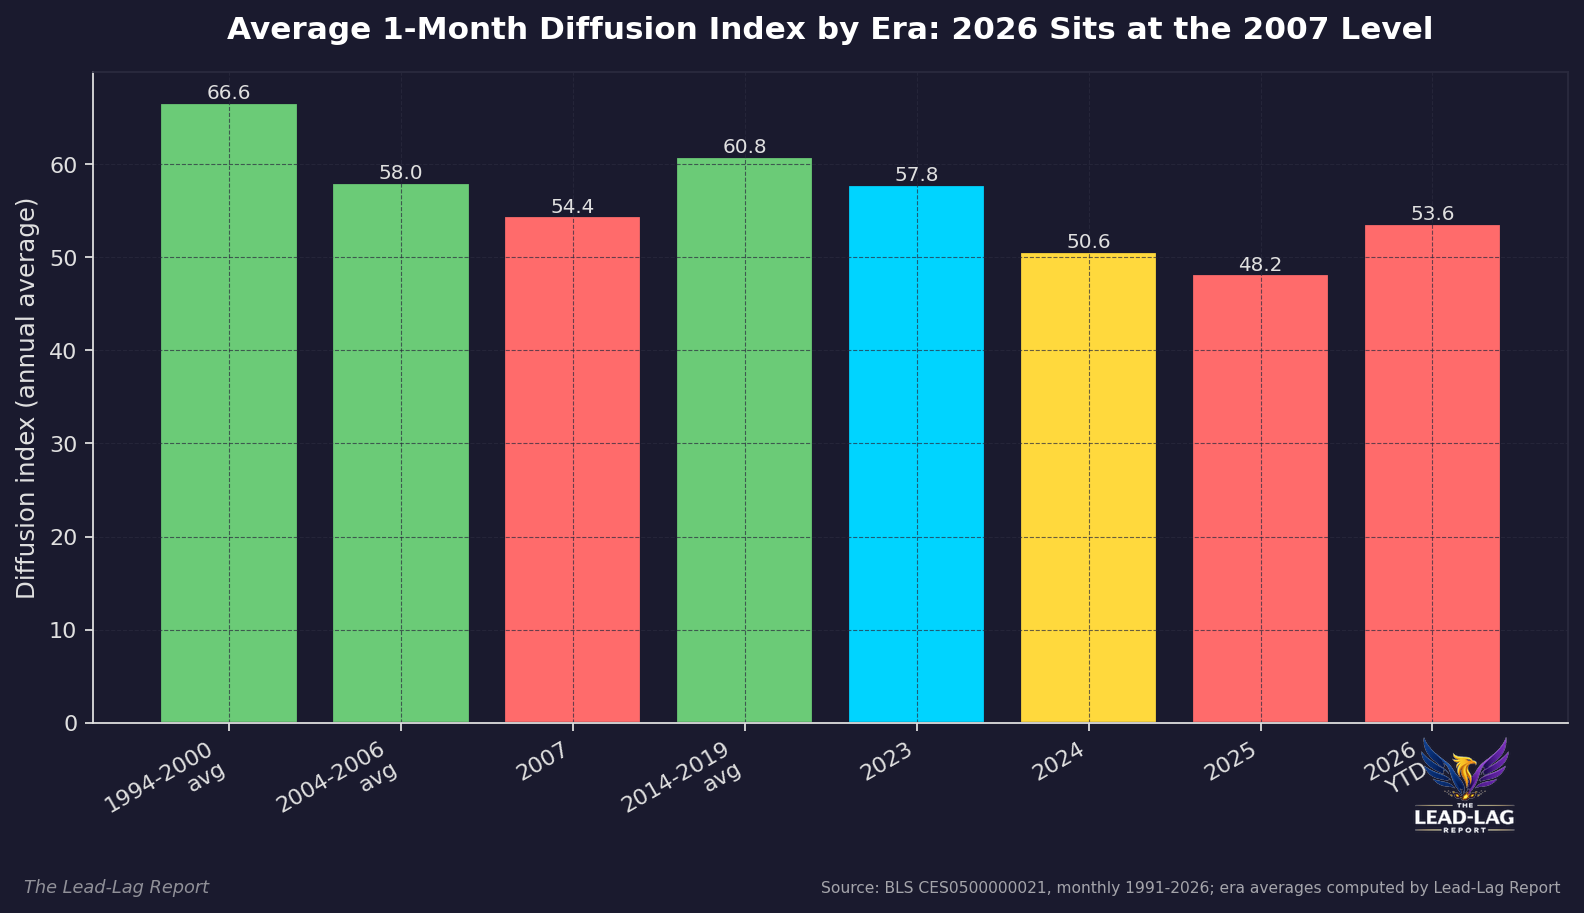
Set that against genuine expansions. The 2014-2019 stretch averaged 60.8. The 1994-2000 run averaged 66.6. Even the mid-2000s housing boom years of 2004-2006 averaged 58.0. [2] A reading in the low fifties is not the middle of a cycle, it is the shoulder of one. Breadth does not collapse from 61 to 33 in a straight line; it stalls in the low-to-mid fifties first, sometimes for a year or more, which is exactly what 2007 did before the floor gave way in 2008 and the index averaged 37.0.
That is the analytical point of a diffusion index. It does not tell you a recession has arrived. It tells you how much of the economy would have to change its mind for one to arrive, and that number is now small.
One Industry Is Carrying the Expansion
Total nonfarm employment grew 506,000 in the twelve months to June 2026, a gain of 0.32 percent. [3] Health care employment grew 437,500 over the same span. [4] One industry group therefore accounts for about 86 percent of all net job creation in the United States over the past year. Government payrolls fell 215,000. [11] Private payrolls excluding health care added 283,500, which works out to under 24,000 jobs a month for an economy of 159 million workers. [3][4][12]
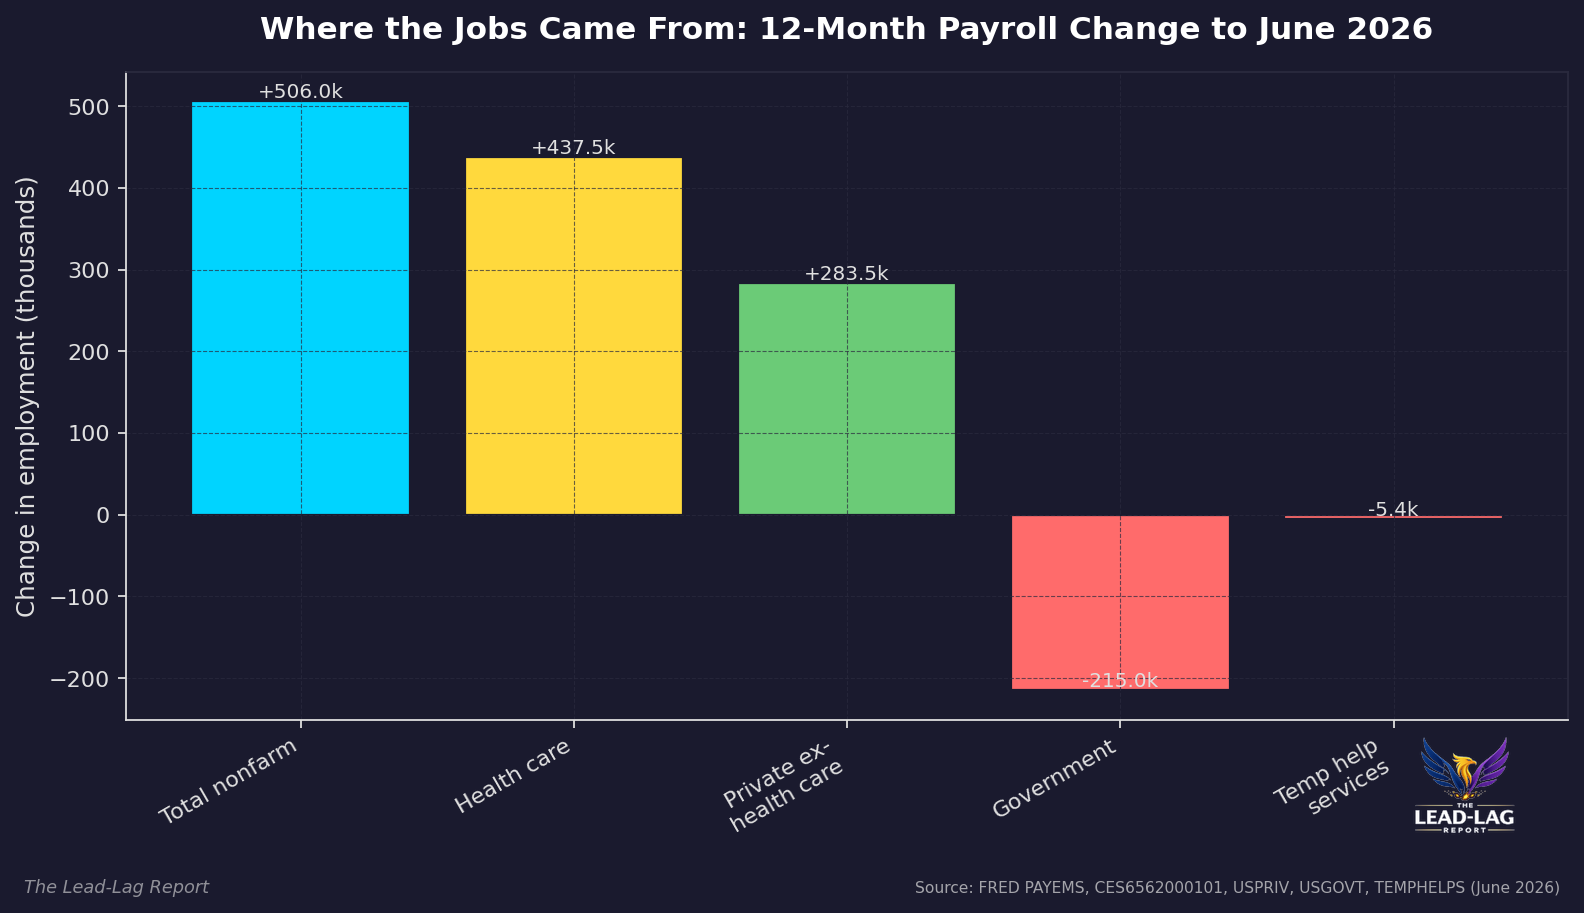
This is what a low diffusion index looks like from the inside. Health care hiring is demographically driven, funded largely through public and quasi-public channels, and almost entirely insensitive to the credit cycle and to the business investment cycle. It is the least informative payroll growth available, and it is the payroll growth doing nearly all of the work. Strip it out and the headline that gets described as resilient becomes a rounding error.
The Frozen Middle: Quits, Hires and Hours
The flow data confirm what the breadth data imply. Temporary help services employment stood at 2,499,200 in June, lower by 5,400 from a year earlier and down 662,200, or 20.9 percent, from the March 2022 peak of 3,161,400. [13] Temp help is the cyclical canary because it is the first line adjusted when managers doubt forward demand, and it has been flat on its back for four years without recovering.
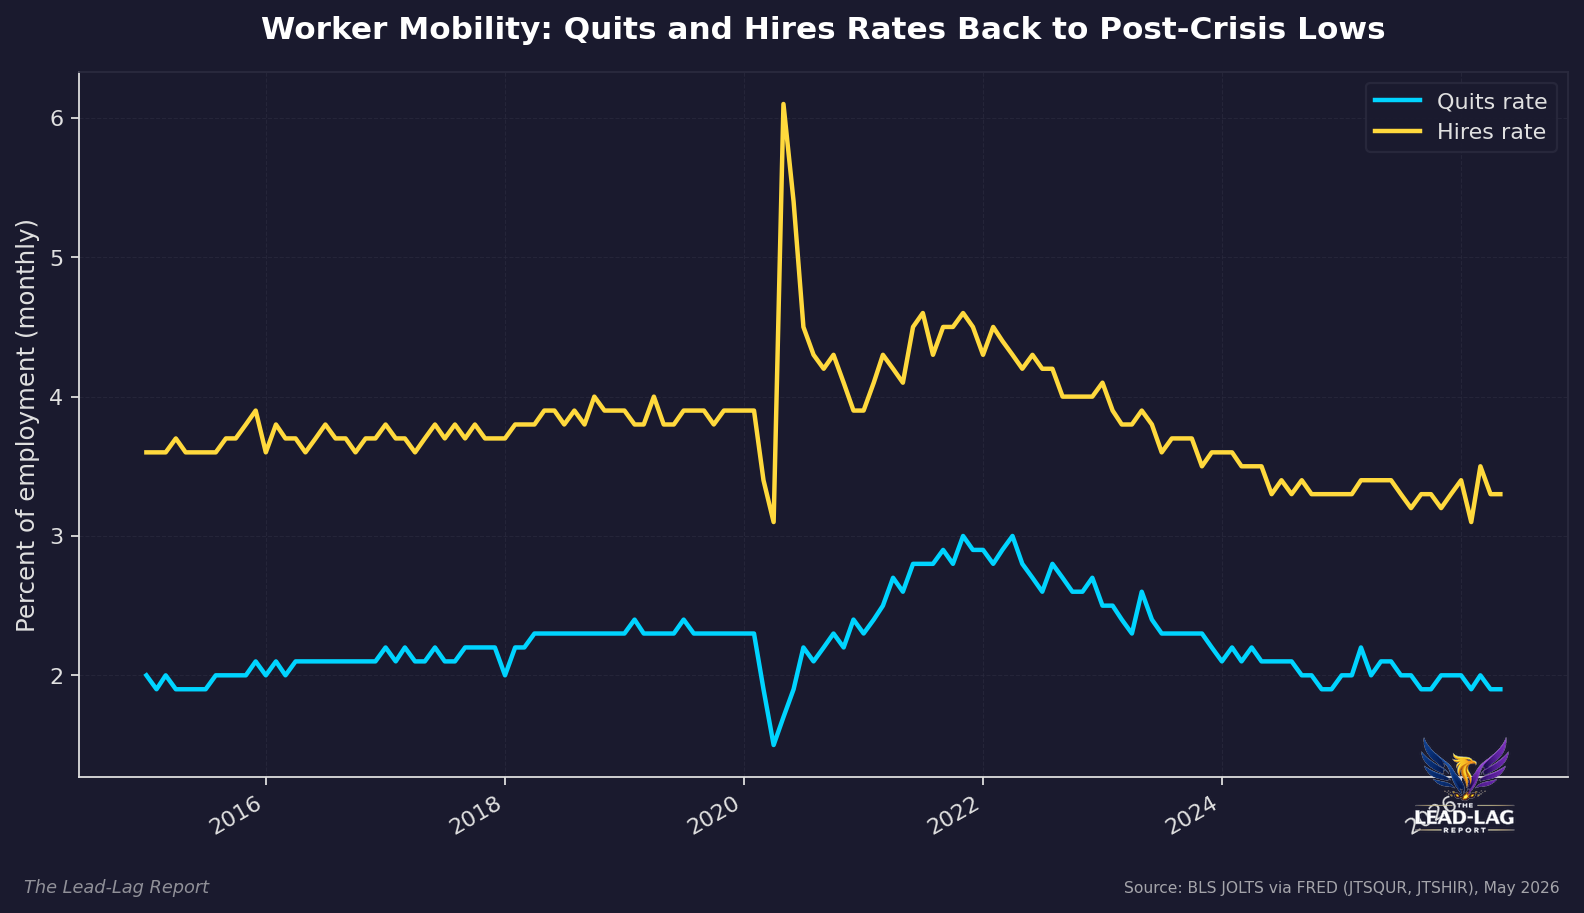
The quits rate is 1.9 percent, against a November 2021 peak of 3.0 percent, and the last time it sat this low outside the 2020 shutdown was July 2015. [5] The hires rate is 3.3 percent versus 3.9 percent in December 2019, closer to the 2.8 percent post-crisis trough than to any expansion norm. [6] Job openings have fallen to 7.59 million from 12.3 million in March 2022. [14] Workers are not quitting because they do not see the next job, and firms are not hiring because they do not see the next order.
Hours tell the same story more quietly. The average private workweek is 34.3 hours against a January 2021 peak of 35.0, and the index of aggregate weekly hours slipped to 124.3 in June from a record 124.8 in May. [15][16] Labor input is being trimmed at the margin of the hour before it is trimmed at the margin of the head count, which is the sequence that always precedes the payroll declines that make headlines.
The Trigger That Is Not Flashing
The obvious objection is the Sahm rule. The real-time Sahm indicator sits at 0.07 percentage points against a 0.50 trigger, and it has been falling since April. [7] By that measure nothing is happening. That is the correct reading of the Sahm rule and the wrong conclusion to draw from it.
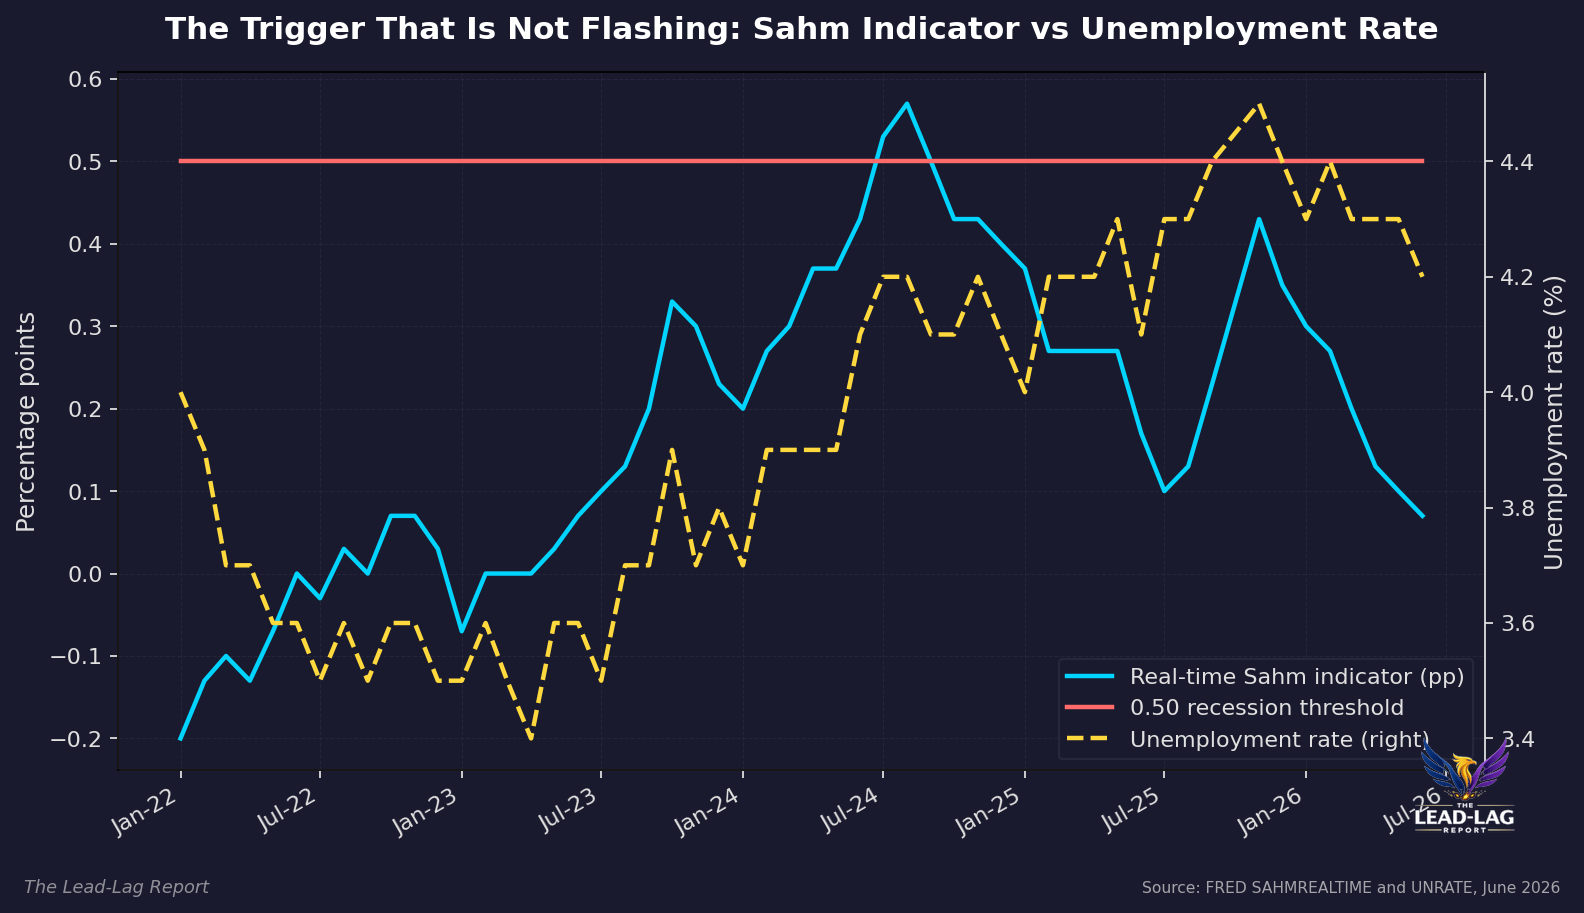
The Sahm rule is a confirmation tool built on the three-month average unemployment rate, and the unemployment rate is a composition of who is counted. The rate fell to 4.2 percent in June while the participation rate fell to 61.5 percent from 62.3 percent a year earlier. [8][17] A rate that improves because the denominator shrinks is not the same signal as a rate that improves because hiring broadens. Meanwhile the U-6 underemployment rate rose to 7.9 percent from 7.7 percent a year ago, and the median duration of unemployment lengthened to 11.0 weeks from 10.1. [18][19] People who lose work are taking longer to find it, which is what a narrow hiring base does to the unemployed.
For positioning, the implication is a regime question rather than a forecast. A labor market with breadth in the low fifties, mobility at 2015 levels and a single non-cyclical industry generating 86 percent of net job gains does not need a shock to produce negative payroll prints. It needs an ordinary month in which health care hiring normalizes. That asymmetry argues for duration exposure over cyclical exposure, for quality over leverage in credit, and for treating the strong-labor-market premise embedded in equity earnings estimates as the fragile assumption in the stack rather than the safe one.
The thesis is falsifiable, which is the point of writing it down. If the one-month diffusion index moves back through 58 and holds there for a full quarter, and if the six-month span follows it above 55 from the 54.2 reading in June, then breadth is genuinely rebuilding and the narrow-expansion argument fails. [2] The same applies if the quits rate lifts back toward 2.3 percent or if temporary help services employment posts three consecutive monthly gains after four years of stagnation. [5][13] None of those confirmations have arrived. What has arrived instead is a June print of 54.4 on a metric that averaged 60.8 through the last real expansion, alongside a headline gain of 57,000 jobs that would have been described as a stall in any prior cycle. [2][3]
The consensus is not wrong about the data. It is reading the wrong column of it. Payrolls measure how many. Diffusion measures how many places. When the second number stalls in the low fifties while the first one holds, the first one is being carried, and carried things get dropped.
The next recession will not announce itself with a bad headline print; it will announce itself as the month the narrowest expansion in three decades finally ran out of industries willing to hire.
Few understand this.
— — —
Notes
- U.S. Bureau of Labor Statistics, Employment Situation, Table B-6, Diffusion indexes of employment change, seasonally adjusted, based on 250 private industries. https://www.bls.gov/web/empsit/ceseeb6.htm
- BLS Current Employment Statistics series CES0500000021 (1-month span), CES0500000022 (3-month) and CES0500000023 (6-month), total private, monthly 1991 through June 2026; era averages computed from the full BLS series file. https://data.bls.gov/timeseries/CES0500000021 and https://download.bls.gov/pub/time.series/ce/
- Total nonfarm payroll employment, 158,984,000 in June 2026 versus 158,478,000 in June 2025; June monthly change +57,000. FRED series PAYEMS. https://fred.stlouisfed.org/series/PAYEMS
- All employees, health care, 18,502,200 in June 2026 versus 18,064,700 in June 2025. FRED series CES6562000101. https://fred.stlouisfed.org/series/CES6562000101
- Quits rate, total nonfarm, 1.9 percent in May 2026; November 2021 peak 3.0 percent; prior sub-2.0 percent readings outside 2020 last occurred in July 2015. FRED series JTSQUR. https://fred.stlouisfed.org/series/JTSQUR
- Hires rate, total nonfarm, 3.3 percent in May 2026 versus 3.9 percent in December 2019 and a 2.8 percent June 2009 trough. FRED series JTSHIR. https://fred.stlouisfed.org/series/JTSHIR
- Real-time Sahm Rule Recession Indicator, 0.07 percentage points in June 2026 versus 0.13 in April 2026. FRED series SAHMREALTIME. https://fred.stlouisfed.org/series/SAHMREALTIME
- Civilian unemployment rate, 4.2 percent in June 2026 versus 4.3 percent in May 2026. FRED series UNRATE. https://fred.stlouisfed.org/series/UNRATE
- Initial claims for unemployment insurance, 197,000 for the week ended July 25, 2026. FRED series ICSA. https://fred.stlouisfed.org/series/ICSA
- National Bureau of Economic Research, US Business Cycle Expansions and Contractions, December 2007 peak. https://www.nber.org/research/data/us-business-cycle-expansions-and-contractions
- All employees, government, 23,371,000 in June 2026 versus 23,586,000 in June 2025. FRED series USGOVT. https://fred.stlouisfed.org/series/USGOVT
- All employees, total private, 135,613,000 in June 2026 versus 134,892,000 in June 2025; private ex-health care change computed as the difference against series CES6562000101. FRED series USPRIV. https://fred.stlouisfed.org/series/USPRIV
- Temporary help services employment, 2,499,200 in June 2026 versus 2,504,600 in June 2025 and a March 2022 peak of 3,161,400. FRED series TEMPHELPS. https://fred.stlouisfed.org/series/TEMPHELPS
- Job openings, total nonfarm, 7,594,000 in May 2026 versus a March 2022 peak of 12,301,000. FRED series JTSJOL. https://fred.stlouisfed.org/series/JTSJOL
- Average weekly hours of all employees, total private, 34.3 in June 2026 versus a January 2021 peak of 35.0. FRED series AWHAETP. https://fred.stlouisfed.org/series/AWHAETP
- Index of aggregate weekly hours, total private, 124.3 in June 2026 versus 124.8 in May 2026. FRED series AWHI. https://fred.stlouisfed.org/series/AWHI
- Civilian labor force participation rate, 61.5 percent in June 2026 versus 62.3 percent in June 2025. FRED series CIVPART. https://fred.stlouisfed.org/series/CIVPART
- Total unemployed plus all marginally attached workers plus those employed part time for economic reasons (U-6), 7.9 percent in June 2026 versus 7.7 percent in June 2025. FRED series U6RATE. https://fred.stlouisfed.org/series/U6RATE
- Median duration of unemployment, 11.0 weeks in June 2026 versus 10.1 weeks in June 2025. FRED series UEMPMED. https://fred.stlouisfed.org/series/UEMPMED



