The Offense Lost Its Quorum
Treasury Rotation flips defensive, the lumber-gold gap blows out to nineteen points, and both remaining offensive readings lose conviction. The composite tilts risk-off at -18.

THE LEAD-LAG REPORT
The Offense Lost Its Quorum
Treasury Rotation flips to the defensive side, the lumber-gold gap blows out to nineteen points, and both remaining offensive readings lose conviction. The framework no longer has a risk-on majority.
Week Ending September 18, 2026
By Michael A. Gayed, CFA
Today’s Lead-Lag Report post is sponsored by Tuttle Capital Management

Special Announcement
Not everything in this market needs to be an AI trade.
The Tuttle Capital Heavy Asset Low Obsolescence ETF (HALX) tracks a rules-based index of U.S. companies with a different profile from many AI-related companies: heavy tangible assets, durable asset-backed cash flow, and low reliance on digitizable, asset-light business models — think regulated utilities, freight rail, pipelines, and materials producers.
The underlying index, built and maintained by VettaFi, scores companies on a “HALO Score” — tangible asset intensity, cash flow durability, and low digital-substitution risk — and holds roughly 30–50 constituents, equal-weighted, rebalanced quarterly.
Launched May 19, 2026 on Cboe. Passively managed.
Learn more at halxetf.com
Investors should carefully consider the investment objectives, risks, charges, and expenses of the Tuttle Capital Heavy Asset Low Obsolescence ETF (HALX) before investing. For a prospectus with this and other information about the Fund, please visit halxetf.com or call (833) 759-6110. Please read the prospectus carefully before investing.
Investment in the Fund is subject to investment risks, including the possible loss of some or the entire principal amount invested. There can be no assurance that the Fund will be successful in meeting its investment objective.
Limited History of Operations Risk: As of the date of this prospectus, the Fund has no operating history and currently has fewer assets than larger funds. Like other new funds, large inflows and outflows may impact the Fund’s market exposure for limited periods of time. This impact may be positive or negative, depending on the direction of market movement during the period affected.
Index Tracking Risk: Returns may not match its reference Index due to costs, timing differences, or operational constraints. The Fund will hold reference index securities regardless of outlook, which may lead to underperformance versus active strategies.
Non-Diversification Risk: The Fund is considered to be non-diversified, which means it may invest more of its assets in the securities of a single issuer or a smaller number of issuers than if it were a diversified fund. To the extent the Fund invests a significant percentage of its assets in a limited number of issuers, it may be more susceptible to a single adverse economic or regulatory occurrence. As a result, changes in the market value of a single security could cause greater fluctuations in the value of Fund shares than would occur in a diversified fund.
There is no guarantee that the Fund’s investment strategy will be properly implemented, and an investor may lose some or all of its investment. The Fund’s focus on companies with tangible asset intensity and characteristics associated with durable, asset-backed cash flows does not constitute a forecast of technological developments or a guarantee of reduced exposure to artificial intelligence or other innovations. The theme underlying the Fund may fall out of favor, underperform broader equity markets, or experience periods of significant volatility. Companies with high fixed costs and significant capital expenditure requirements may experience amplified earnings volatility during periods of reduced demand.
The Fund is non-diversified and may invest a greater percentage of its assets in a smaller number of issuers than a diversified fund, which may increase the volatility of the Fund’s returns. ETF shares may trade at a premium or discount to NAV. References to specific companies and sectors are for illustrative purposes only, reflect the Index universe as of a recent reconstitution, and are subject to change at each quarterly reconstitution. Such references do not constitute a recommendation to buy, sell, or hold any security. Any reference to a third party, including VettaFi LLC, does not imply endorsement of the Fund.
Distributor: Foreside Fund Services, LLC
DISCLAIMER – PLEASE READ: This is sponsored advertising content for which Lead-Lag Publishing, LLC has been paid a fee. The information provided in the link is solely the creation of Tuttle Capital Management. Lead-Lag Publishing, LLC does not guarantee the accuracy or completeness of the information provided in the link or make any representation as to its quality. All statements and expressions provided in the link are the sole opinion of Tuttle Capital Management and Lead-Lag Publishing, LLC expressly disclaims any responsibility for action taken in connection with the information provided in the link.
SIGNAL SUMMARY
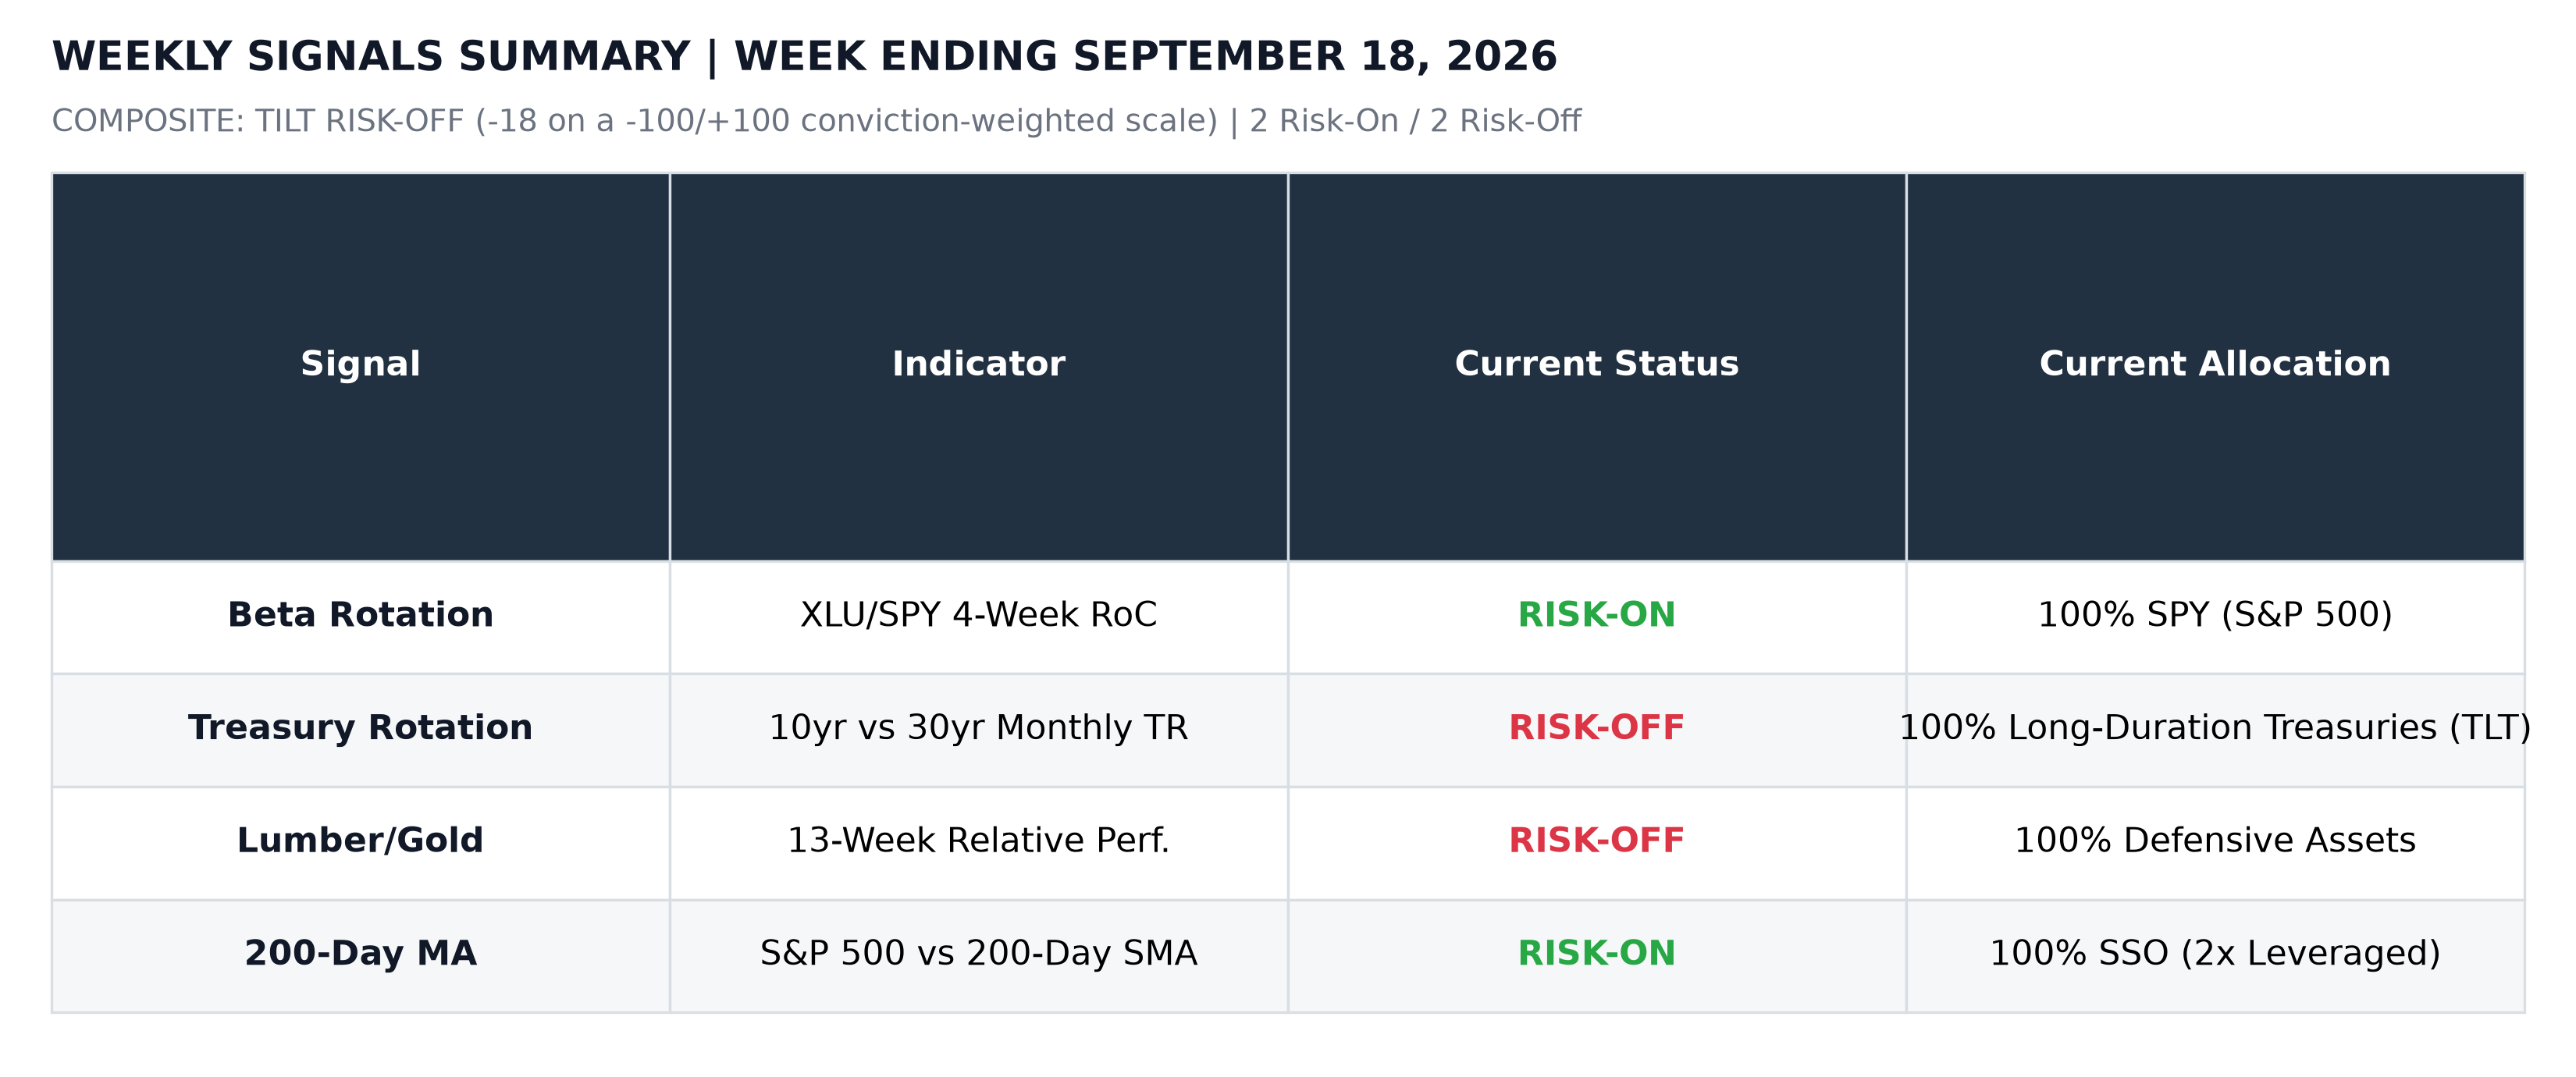
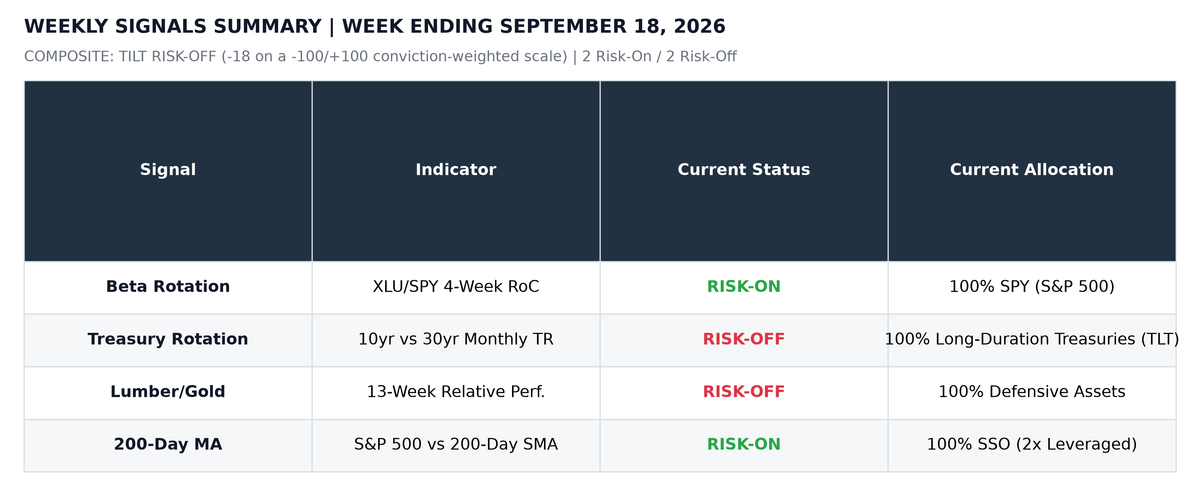
COMPOSITE: TILT RISK-OFF (-18 on a -100/+100 conviction-weighted scale)
2-of-4 RISK-ON · 2-of-4 RISK-OFF
Split-decision alert: for the first time since late July, the framework has no risk-on majority. Treasury Rotation joined Lumber/Gold on the defensive side this month, and both offensive readings lost ground: Beta Rotation conviction fell from 100 to 36 as utilities closed nearly two-thirds of their four-week underperformance gap, and the S&P 500 cushion above its 200-day average compressed from +8.2% to +6.5%. Two-on-two splits historically resolve decisively in one direction. The burden of proof now sits with the offense.
Key Takeaways:
- Signal 1 (Beta Rotation) remains Risk-On but badly weakened. The XLU/SPY 4-week rate of change narrowed to -3.64% from -10.84% four weeks ago as utilities rallied into the Fed meeting. The allocation remains 100% SPY, but this is now the framework’s softest offensive reading.
- Signal 2 (Treasury Rotation) flipped RISK-OFF on the August month-end reading. TLT returned +0.73% versus IEF at +0.12% in August, the first long-duration outperformance month since the May-June stretch. The allocation rotates to 100% Long-Duration Treasuries (TLT).
- Signal 3 (Lumber/Gold) is RISK-OFF and deepening. Lumber’s 13-week return of -15.17% trails gold’s +4.22%, a 19.38-point gap, the widest of the current defensive regime. All seven sub-strategies remain in defensive positioning.
- Signal 4 (200-Day MA) is Risk-On with a shrinking cushion. The S&P 500 at 7,650.50 sits +6.51% above its 200-day SMA of 7,183.05, down from +8.22% at the August 21 reading. The allocation remains 100% SSO (2x leveraged S&P 500).
- The composite reads -18, a defensive tilt. The Federal Reserve’s September 16 hike to 3.75%-4.00%, approved 12-0, plus guidance for one more increase this year, is hardening the defensive side of the framework while the equity trend holds.
MARKET COMMENTARY
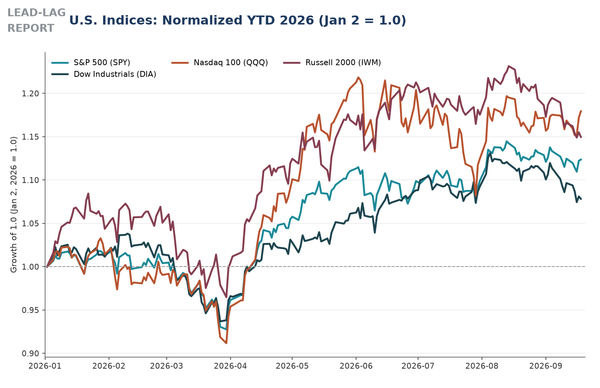
The framework reads 2-2 this week. Two of the four intermarket indicators favor offensive positioning and two favor defense, and the conviction-weighted composite tilts risk-off at -18. The S&P 500 closed at 7,650.50 on September 18, down 0.08% for the week, its second consecutive weekly decline, with the Nasdaq Composite providing the only real bid. The index is up 11.8% year to date and still sits above a rising 200-day average, so the primary trend remains intact. What changed this month is the composition underneath it: both defensive signals hardened and both offensive signals lost conviction.
The catalyst was the Federal Reserve. On September 16 the FOMC raised the target range for the federal funds rate to 3.75%-4.00% by a 12-0 vote and signaled one more increase is likely before year-end. Markets absorbed the hike without panic, but the composition of the week told the story the framework is reading: the Dow dropped 1.69% while the S&P 500 finished essentially flat and rate-sensitive sectors lagged badly. Utilities fell 3.04% on the week even as the four-week momentum signal still favors broad equity, and gold settled near $4,425 after a 2.5% surge on hike day itself.
The Treasury Rotation flip is the most consequential change. In August, long-duration Treasuries outperformed intermediate maturities for the first month since the May-June defensive stretch, as the 30-year yield retreated from its 19-year high and the Treasury announced it would double long-end buyback operations from $2 billion to at least $4 billion per operation. TLT gained 0.73% on the month against 0.12% for IEF. The signal is intentionally slow, monthly by design, and each month-end reading holds through the end of the following month. A flight-to-quality signature inside a hiking cycle is exactly the kind of divergence the framework was built to catch.
The Lumber/Gold gap, meanwhile, blew out to its widest reading of the current regime. Lumber futures fell to roughly $535 per thousand board feet, a nine-month low, after August housing starts dropped 2.6% month over month to 1.28 million annualized units, below the 1.32 million consensus. Gold has held a premium bid near four-month highs even as a hawkish Fed tempered the rally’s momentum. A 19.38-point 13-week spread between lumber and gold is not noise; it is the cyclical-defensive spread pricing in a housing downcycle and a safety bid at the same time.
What would flip the composite back toward offense is straightforward: the XLU/SPY four-week rate of change re-widening beyond -10% rather than converging toward zero, September’s month-end TLT reading falling back below IEF, or a lumber recovery that narrows the 13-week gap. What would deepen the defensive tilt: a fourth consecutive weekly decline in the S&P 500 compressing the 200-day cushion further, the December FOMC hike being priced as near-certain, or the XLU/SPY ratio finishing a fourth-week rally that pushes the Beta Rotation signal itself to RISK-OFF. The risks are now two-sided, and the framework says so.
SIGNAL 1: BETA ROTATION
Based on: “An Intermarket Approach to Beta Rotation: The Strategy, Signal, and Power of Utilities” (SSRN 2417974)
Target Investor:
Self-directed investors who want to capture relative strength between equity market segments. This signal uses the 4-week rate of change of the Utilities-to-S&P 500 price ratio to determine whether the market favors offense (broad equity) or defense (Utilities).
CURRENT INDICATOR: RISK-ON
Conviction: 36/100 · Regime age: 8 weeks (57 days) · Whipsaw alert: 1 flip in last 12 readings
What would flip this signal:
Signal flips RISK-OFF when the XLU/SPY 4-week rate of change crosses zero (currently -3.64%). That requires the XLU/SPY ratio to rise to 0.05559 from today’s 0.05357.
Prior RISK-ON regimes: Jun 2026 (7d), Apr 2026–Jun 2026 (63d), Jan 2026–Feb 2026 (14d).
This Week’s Context:
Utilities narrowed the gap dramatically over the past month even though they still trail badly year to date, with XLU down 2.4% against an 11.8% gain for the S&P 500. The defensive bid into utilities ahead of the Fed’s September 16 hike closed most of the four-week underperformance, compressing the signal’s reading from -10.84% to -3.64% over four weekly readings. After the hike, the rate picture turned hostile again: the 30-year Treasury yield finished the week at 5.34%, near its highest level since 2007, which pressures bond-proxy sectors even when the defensive bid tries to reassert itself. The signal is still Risk-On, but this is the weakest offensive reading on the board.
Sources: finance.yahoo.com · fred.stlouisfed.org · federalreserve.gov
XLU/SPY 4-Week Rate of Change: -3.64%
Current Allocation: 100% SPY (S&P 500)
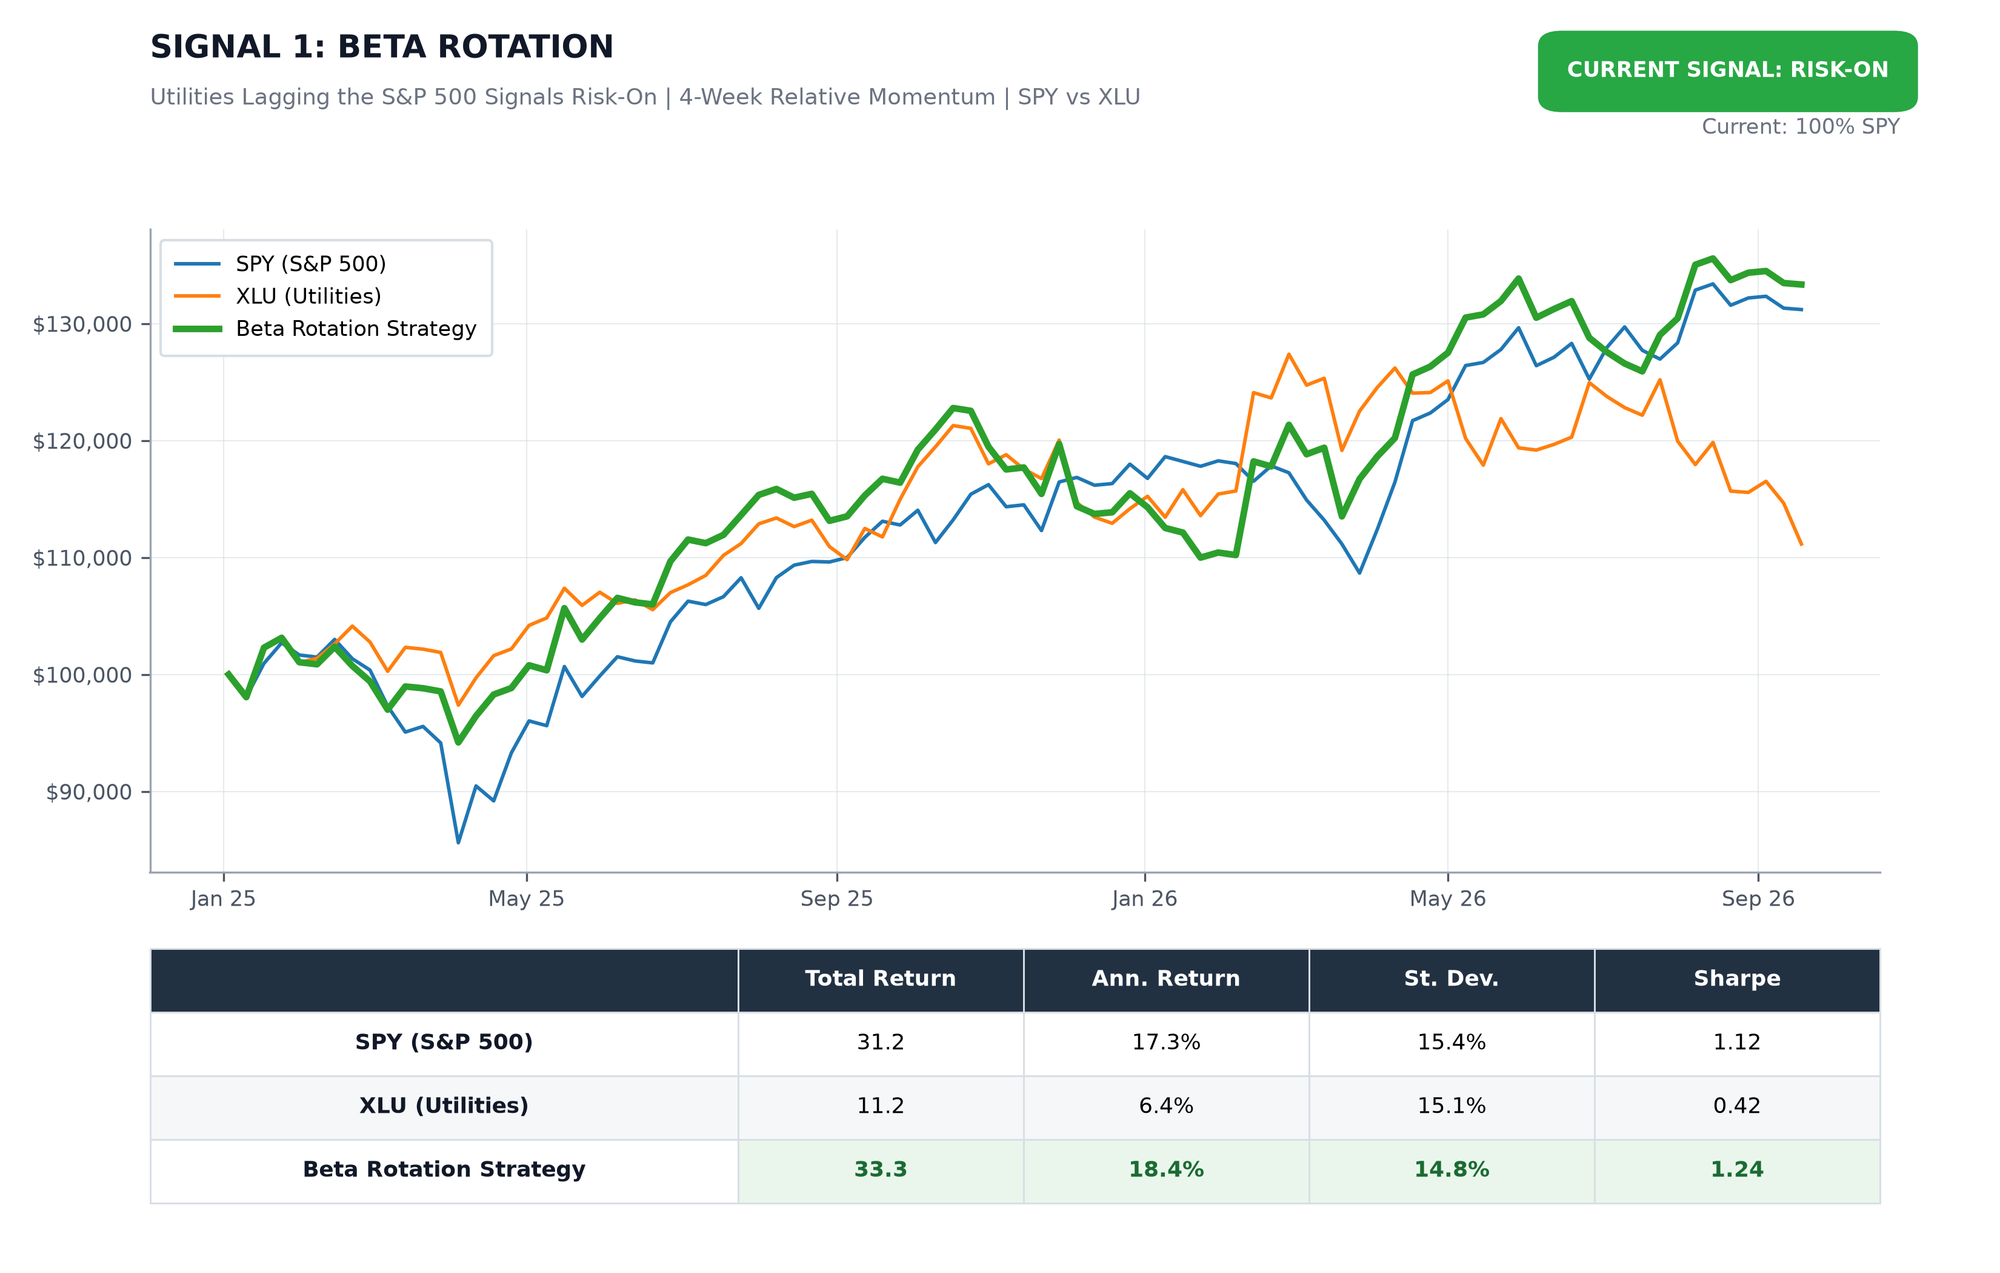
Growth of $100,000 | Since January 3, 2025 | Data: Lead-Lag Publishing, LLC
Reading the chart: XLU/SPY 4-week RoC currently -3.64%. Flip threshold: 0.00%. Distance to flip: 3.64 percentage points.
SIGNAL 2: TACTICAL RISK ROTATION
Based on: “A Quantitative Approach to Tactical Asset Allocation” (SSRN 2431022)
Target Investor:
Conservative to moderate investors seeking a tactical overlay between equities and long-duration Treasuries. This signal compares the prior month total return of 10-year versus 30-year Treasury bonds to identify shifts in the yield curve’s risk appetite signal.
CURRENT INDICATOR: RISK-OFF
Conviction: 81/100 · Regime age: 3 weeks (18 days) · Whipsaw alert: 6 flips in last 12 readings
What would flip this signal:
Signal flips back to RISK-ON when next month’s IEF return exceeds TLT. Current spread: TLT +0.73% vs IEF +0.12% (+0.61 pp).
Prior RISK-OFF regimes: May 2026–Jun 2026 (61d), Jan 2026–Mar 2026 (59d), Oct 2025–Nov 2025 (61d).
This Week’s Context:
Long-duration Treasuries outperformed in August as the 30-year yield retreated from its 19-year high and the Treasury stepped up long-end support, doubling buyback operations from $2 billion to at least $4 billion per operation. TLT remains 4.07% negative on total return year to date and hit a 22-year price low as recently as August 18, so the flip is not a momentum story; it is a relative one. Capital reaching further out the curve while the front of the market prices another hike is a classic flight-to-quality signature, and it is the first one since the May-June stretch. With the 30-year yield back at 5.34% to end the week, the long bond is doing exactly what this signal watches for: absorbing fear better than the belly of the curve.
Sources: ts2.tech · fred.stlouisfed.org · ishares.com
30yr Treasury (TLT) August 2026 Return: +0.73%
10yr Treasury (IEF) August 2026 Return: +0.12%
Current Allocation: 100% Long-Duration Treasuries (TLT)
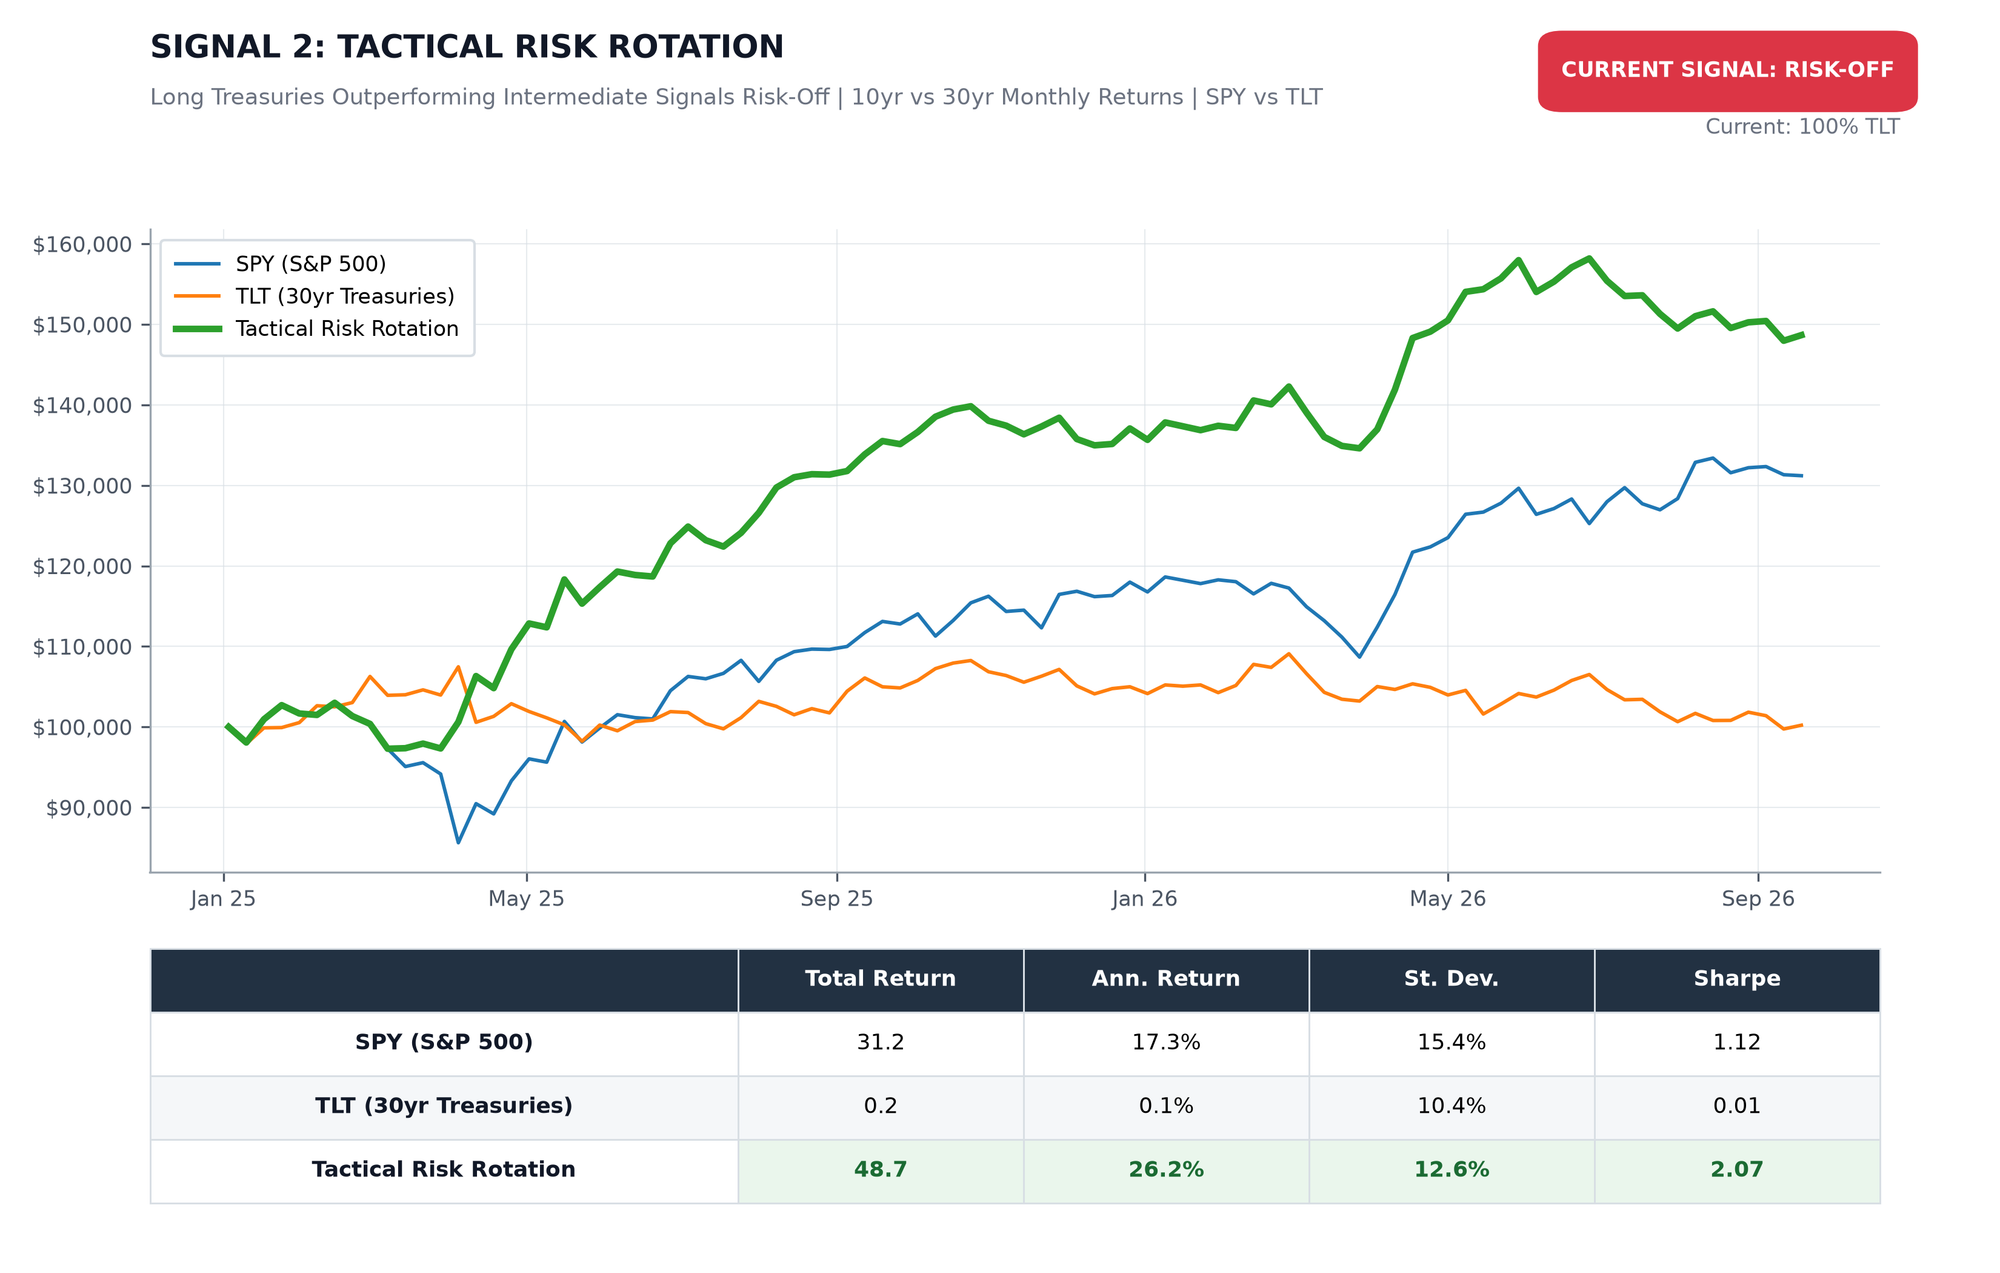
Growth of $100,000 | Monthly Signal, Weekly Data from January 2025 | Data: Lead-Lag Publishing, LLC
Reading the chart: TLT-minus-IEF latest completed month return spread +0.61%. Flip threshold: spread crosses 0%. Distance to flip: 0.61 percentage points.
SIGNAL 3: LUMBER/GOLD RATIO
Based on: “Lumber: Worth Its Weight in Gold” (SSRN 2604248)
Target Investor:
Active investors seeking to rotate between offensive and defensive exposures across multiple asset class pairings. This signal uses the 13-week relative performance of Lumber futures versus Gold spot to determine the market’s risk appetite. When Lumber outperforms Gold, the economy is likely strengthening (Risk-On). When Gold outperforms, investors should favor defensive positioning (Risk-Off).
CURRENT INDICATOR: RISK-OFF
Conviction: 98/100 · Regime age: 5 weeks (36 days)
What would flip this signal:
Signal flips RISK-ON when lumber overtakes gold on a 13-week return basis. Current spread: lumber -15.2% vs gold +4.2% (-19.38 pp gap).
Prior RISK-OFF regimes: Jan 2026–Mar 2026 (77d), May 2026 (7d), Apr 2026 (7d).
This Week’s Context:
Lumber collapsed to a nine-month low near $535 per thousand board feet, with Madison’s framing lumber index at $515.93 on September 18, down 1.6% week over week. The demand side keeps deteriorating: August housing starts fell 2.6% month over month to 1.28 million annualized units, below consensus expectations, and builders continue to discount inventory. Gold, the defensive leg, held above $4,400 near its early-September highs, surging 2.5% on Fed hike day and riding eight straight sessions of ETF inflows before a hawkish central bank cooled the momentum. The 19.38-point spread is the widest of this regime and one of the widest of the year: a housing downcycle and a safety bid, priced simultaneously.
Sources: tradingeconomics.com · census.gov · oanda.com
Lumber 13-Week Return: -15.17%
Gold 13-Week Return: +4.22%
The cyclical-defensive spread has widened every week since this regime began on August 14. All 7 sub-strategies have rotated to defensive positioning.
Lumber/Gold Bond Rotation (SPY vs GOVT)
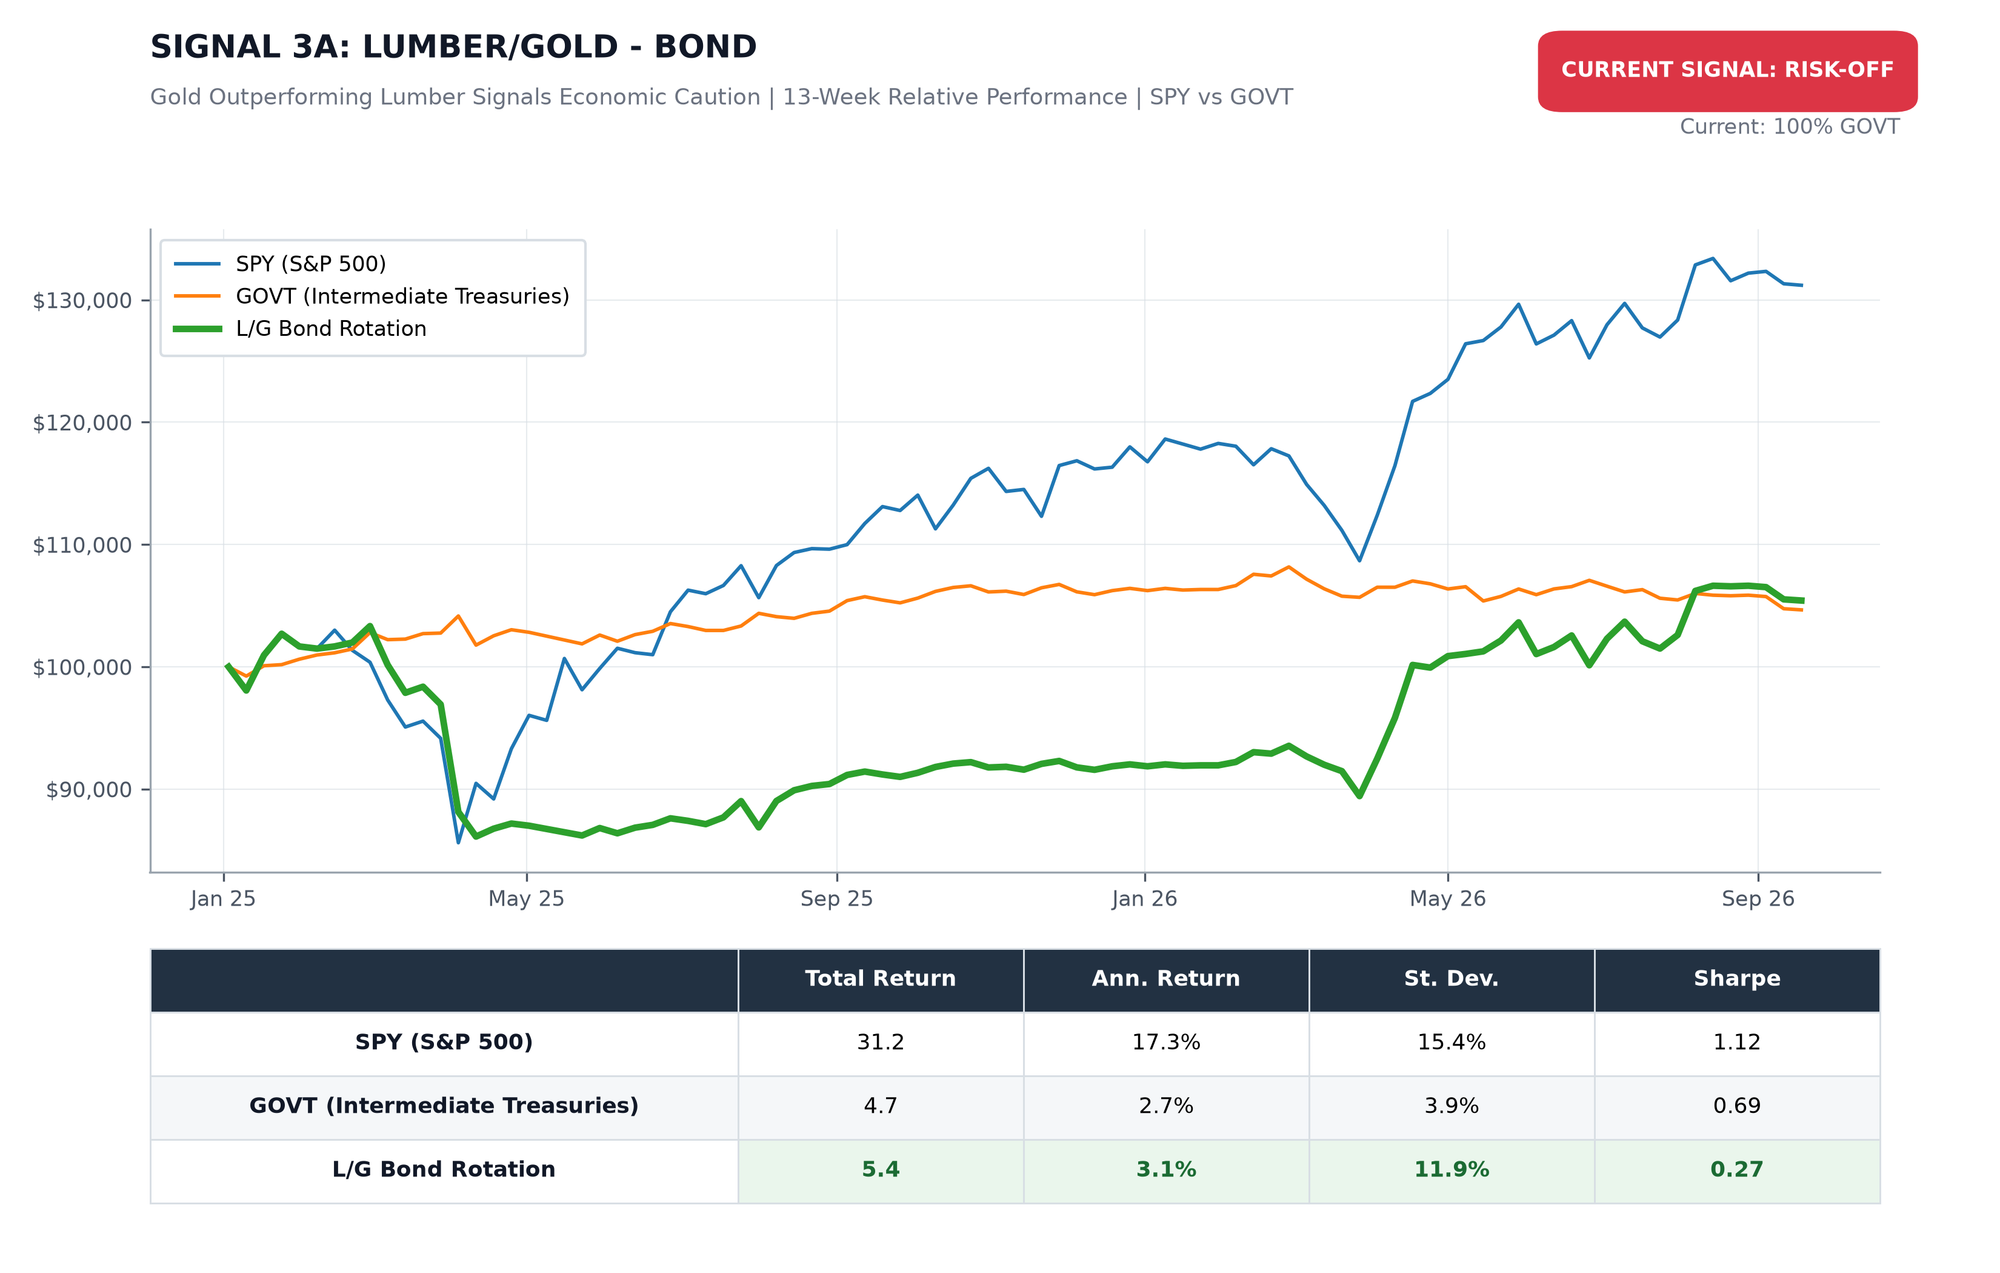
Growth of $100,000 | Since January 3, 2025 | Data: Lead-Lag Publishing, LLC
Lumber/Gold Buy-Write (SPY vs PBP)
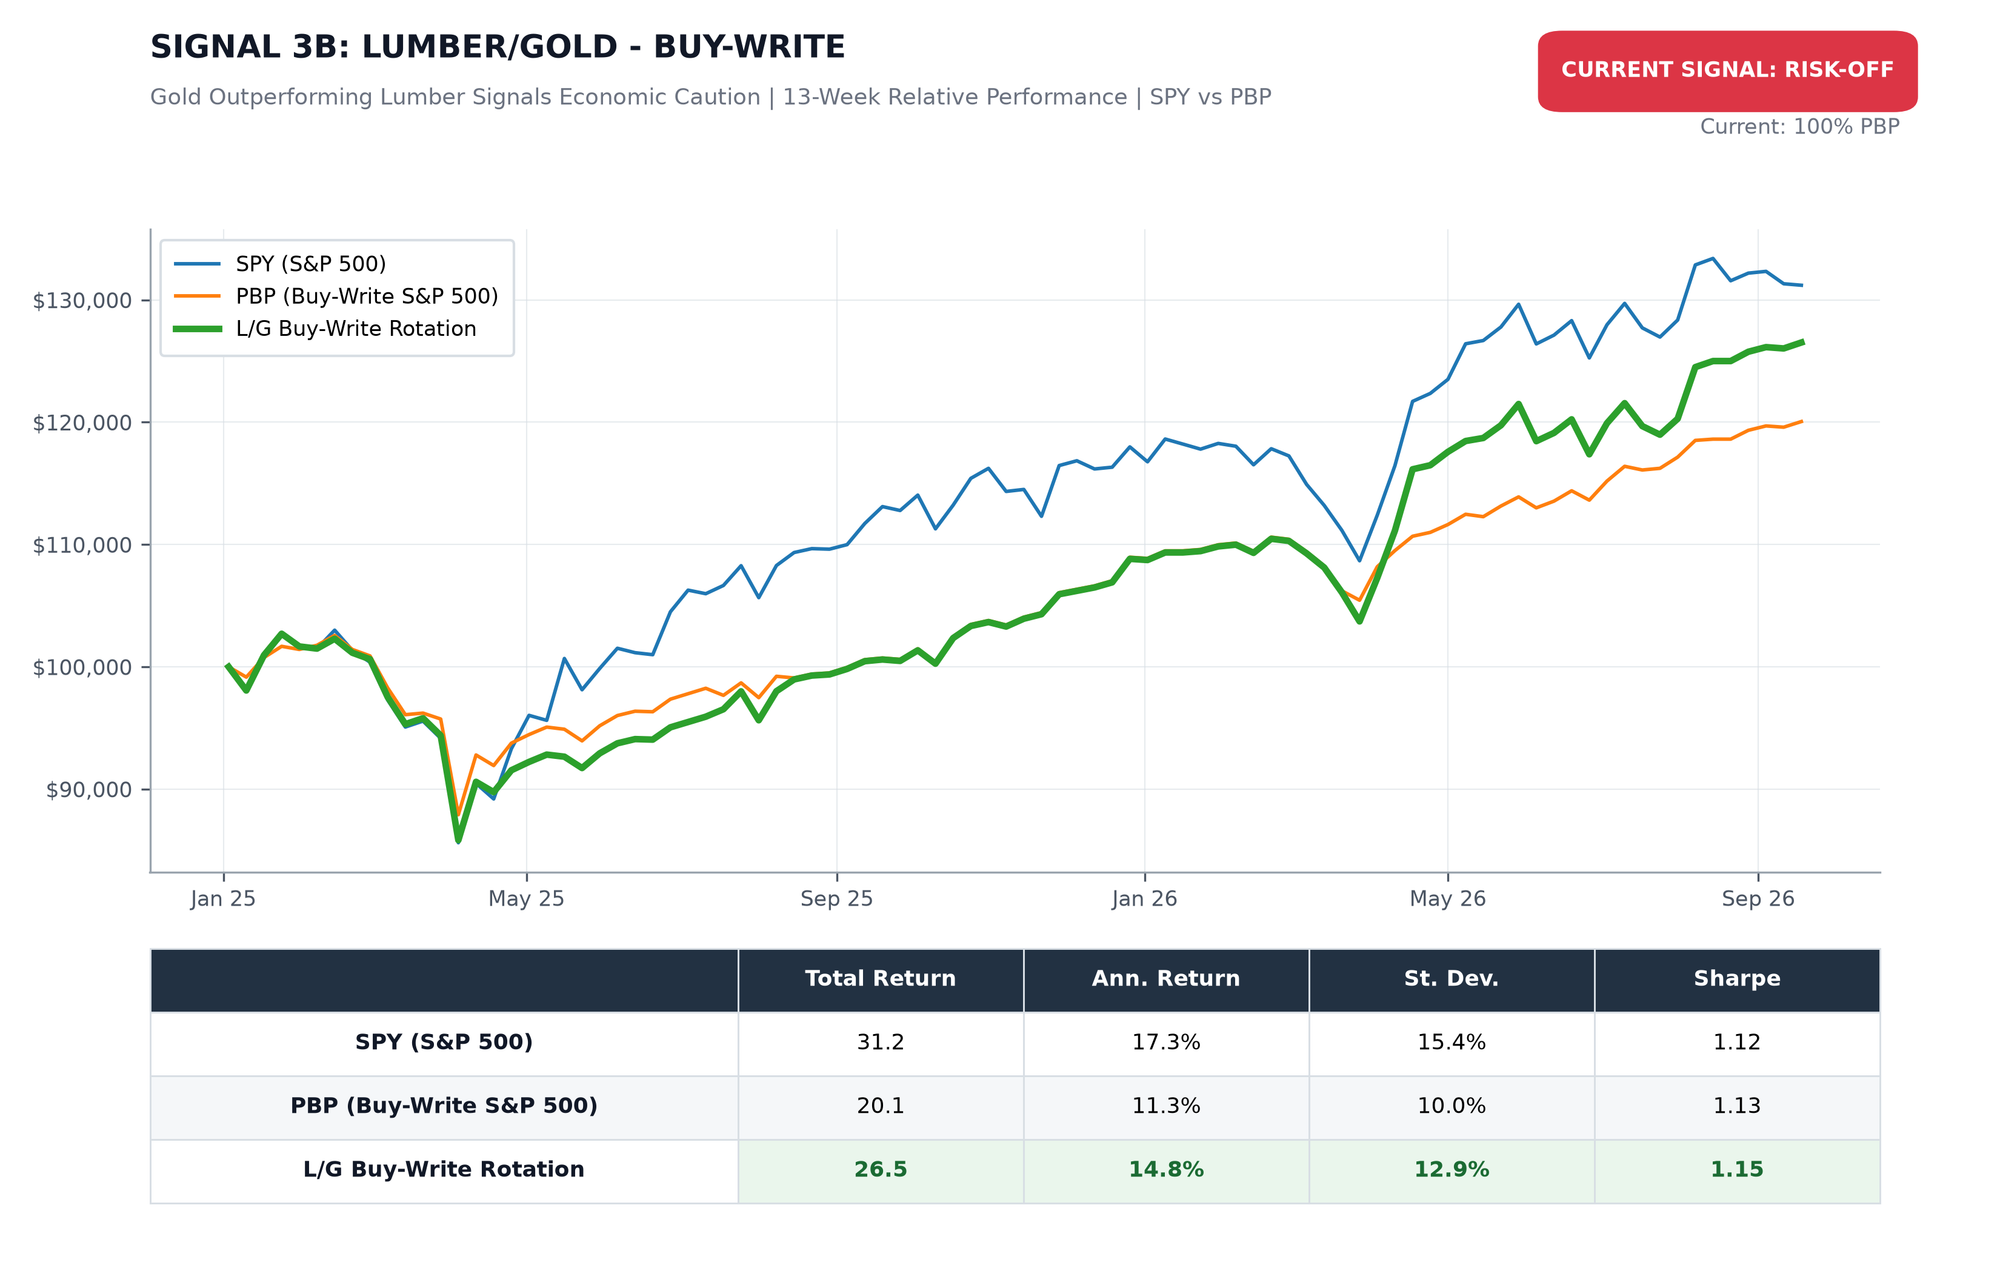
Growth of $100,000 | Since January 3, 2025 | Data: Lead-Lag Publishing, LLC
Lumber/Gold Low Volatility (SPY vs SPLV)
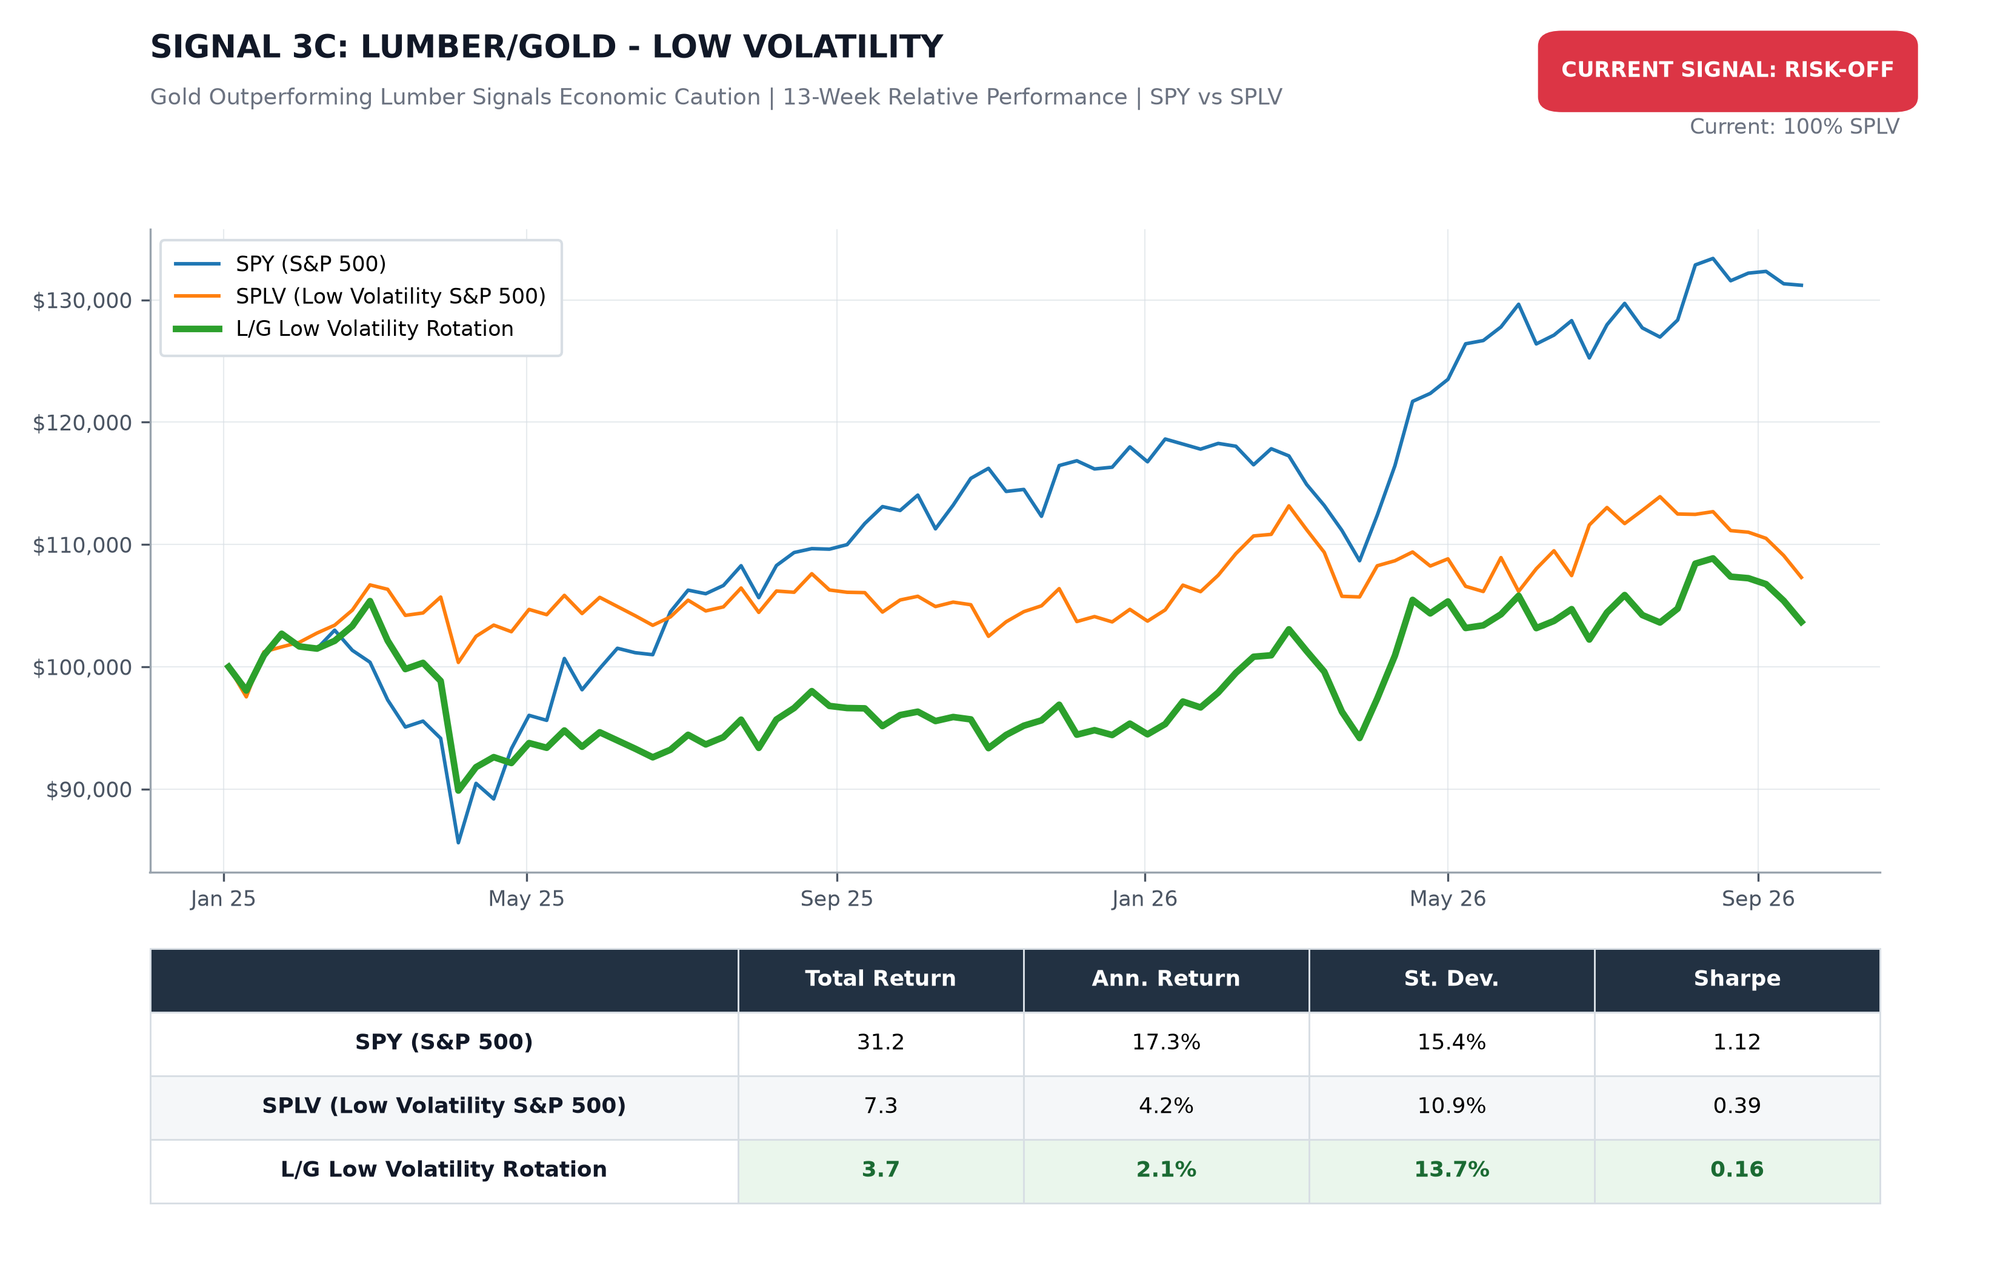
Growth of $100,000 | Since January 3, 2025 | Data: Lead-Lag Publishing, LLC
Lumber/Gold Small-Cap (SPY vs VSMAX)
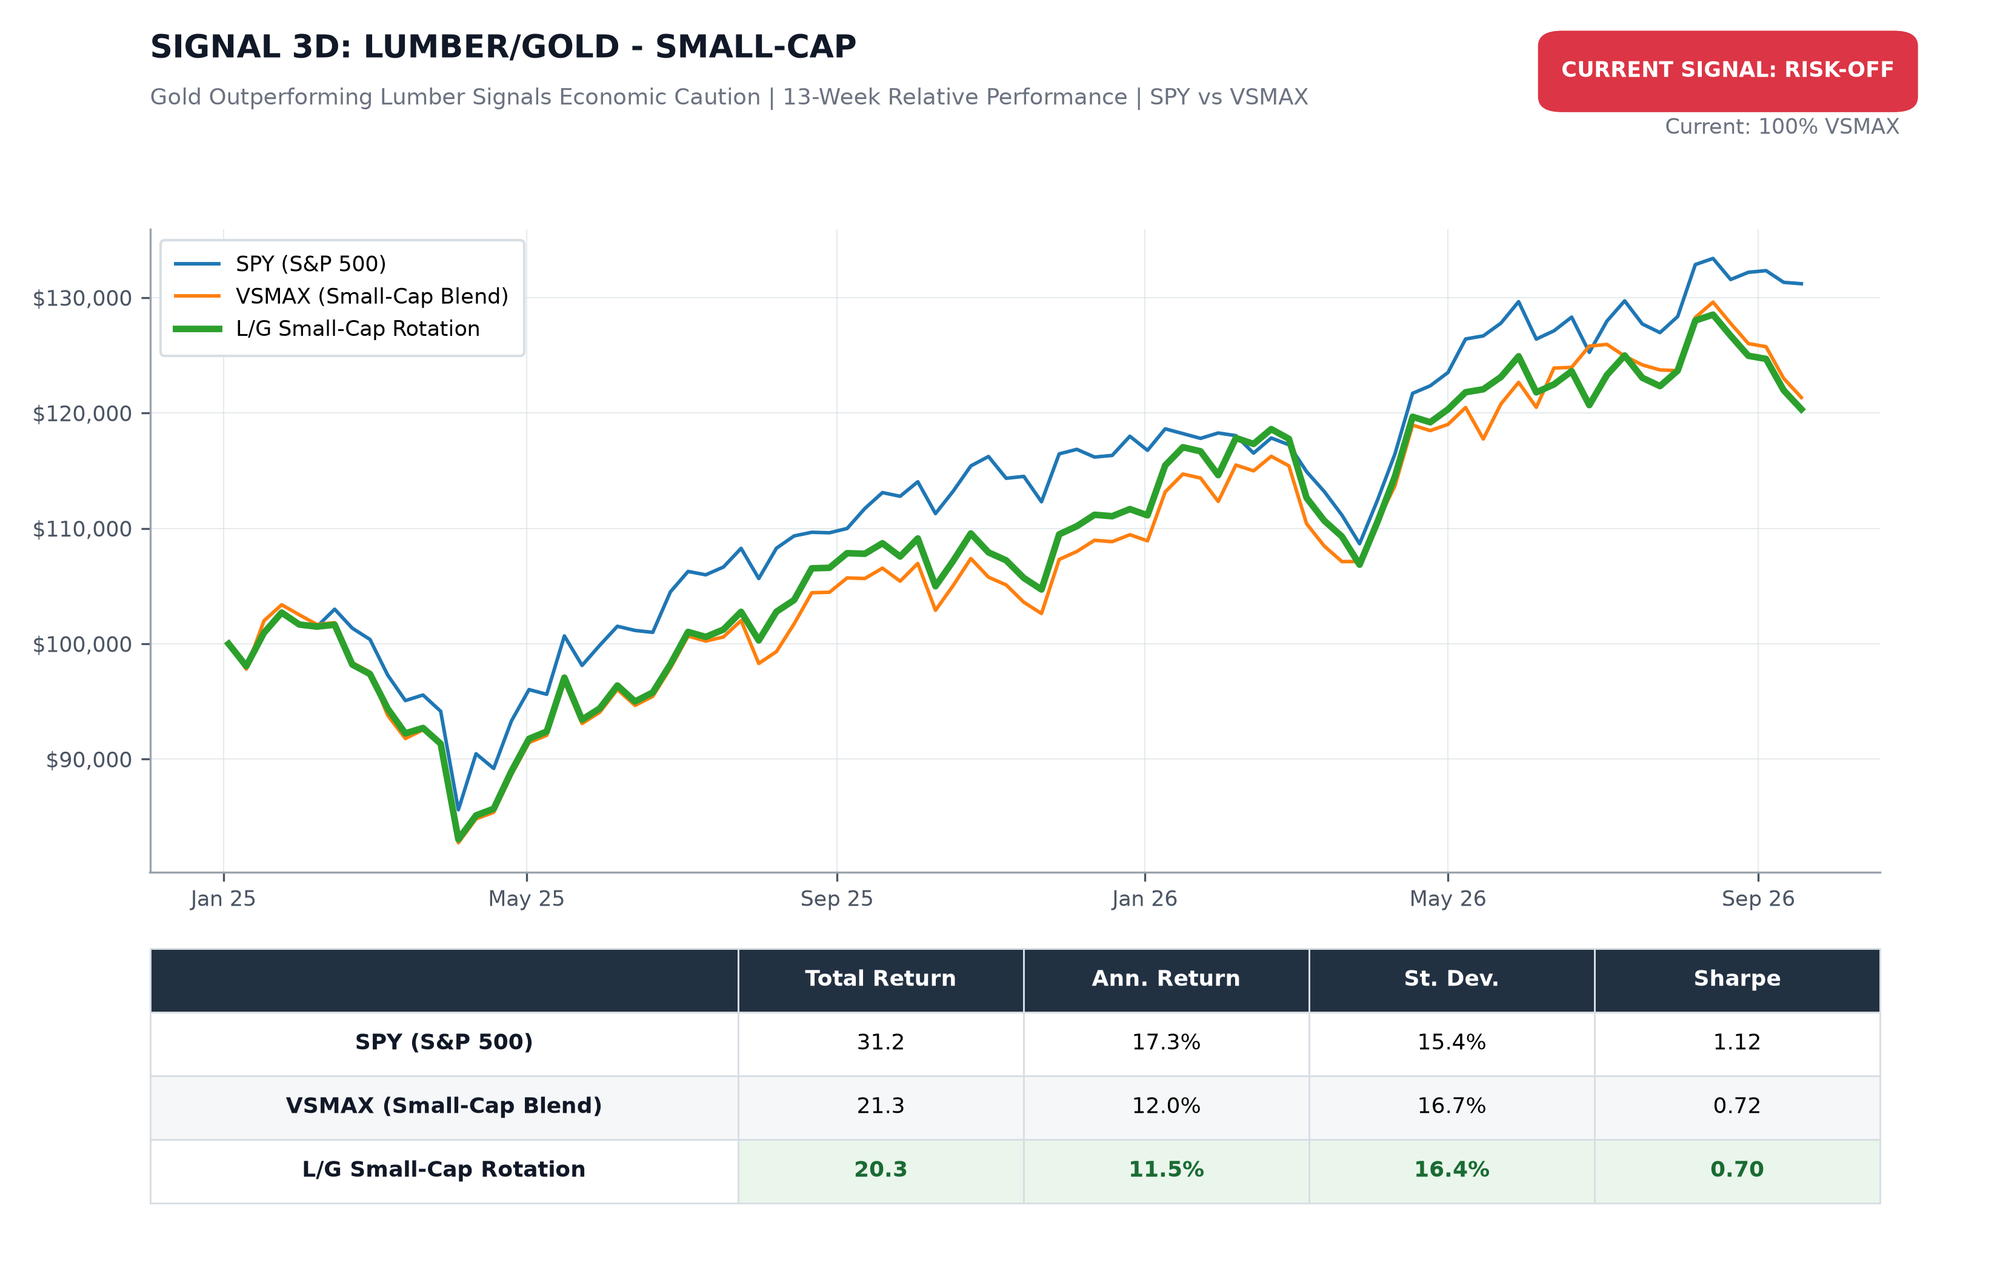
Growth of $100,000 | Since January 3, 2025 | Data: Lead-Lag Publishing, LLC
Lumber/Gold High Beta (SPY vs SPHB)
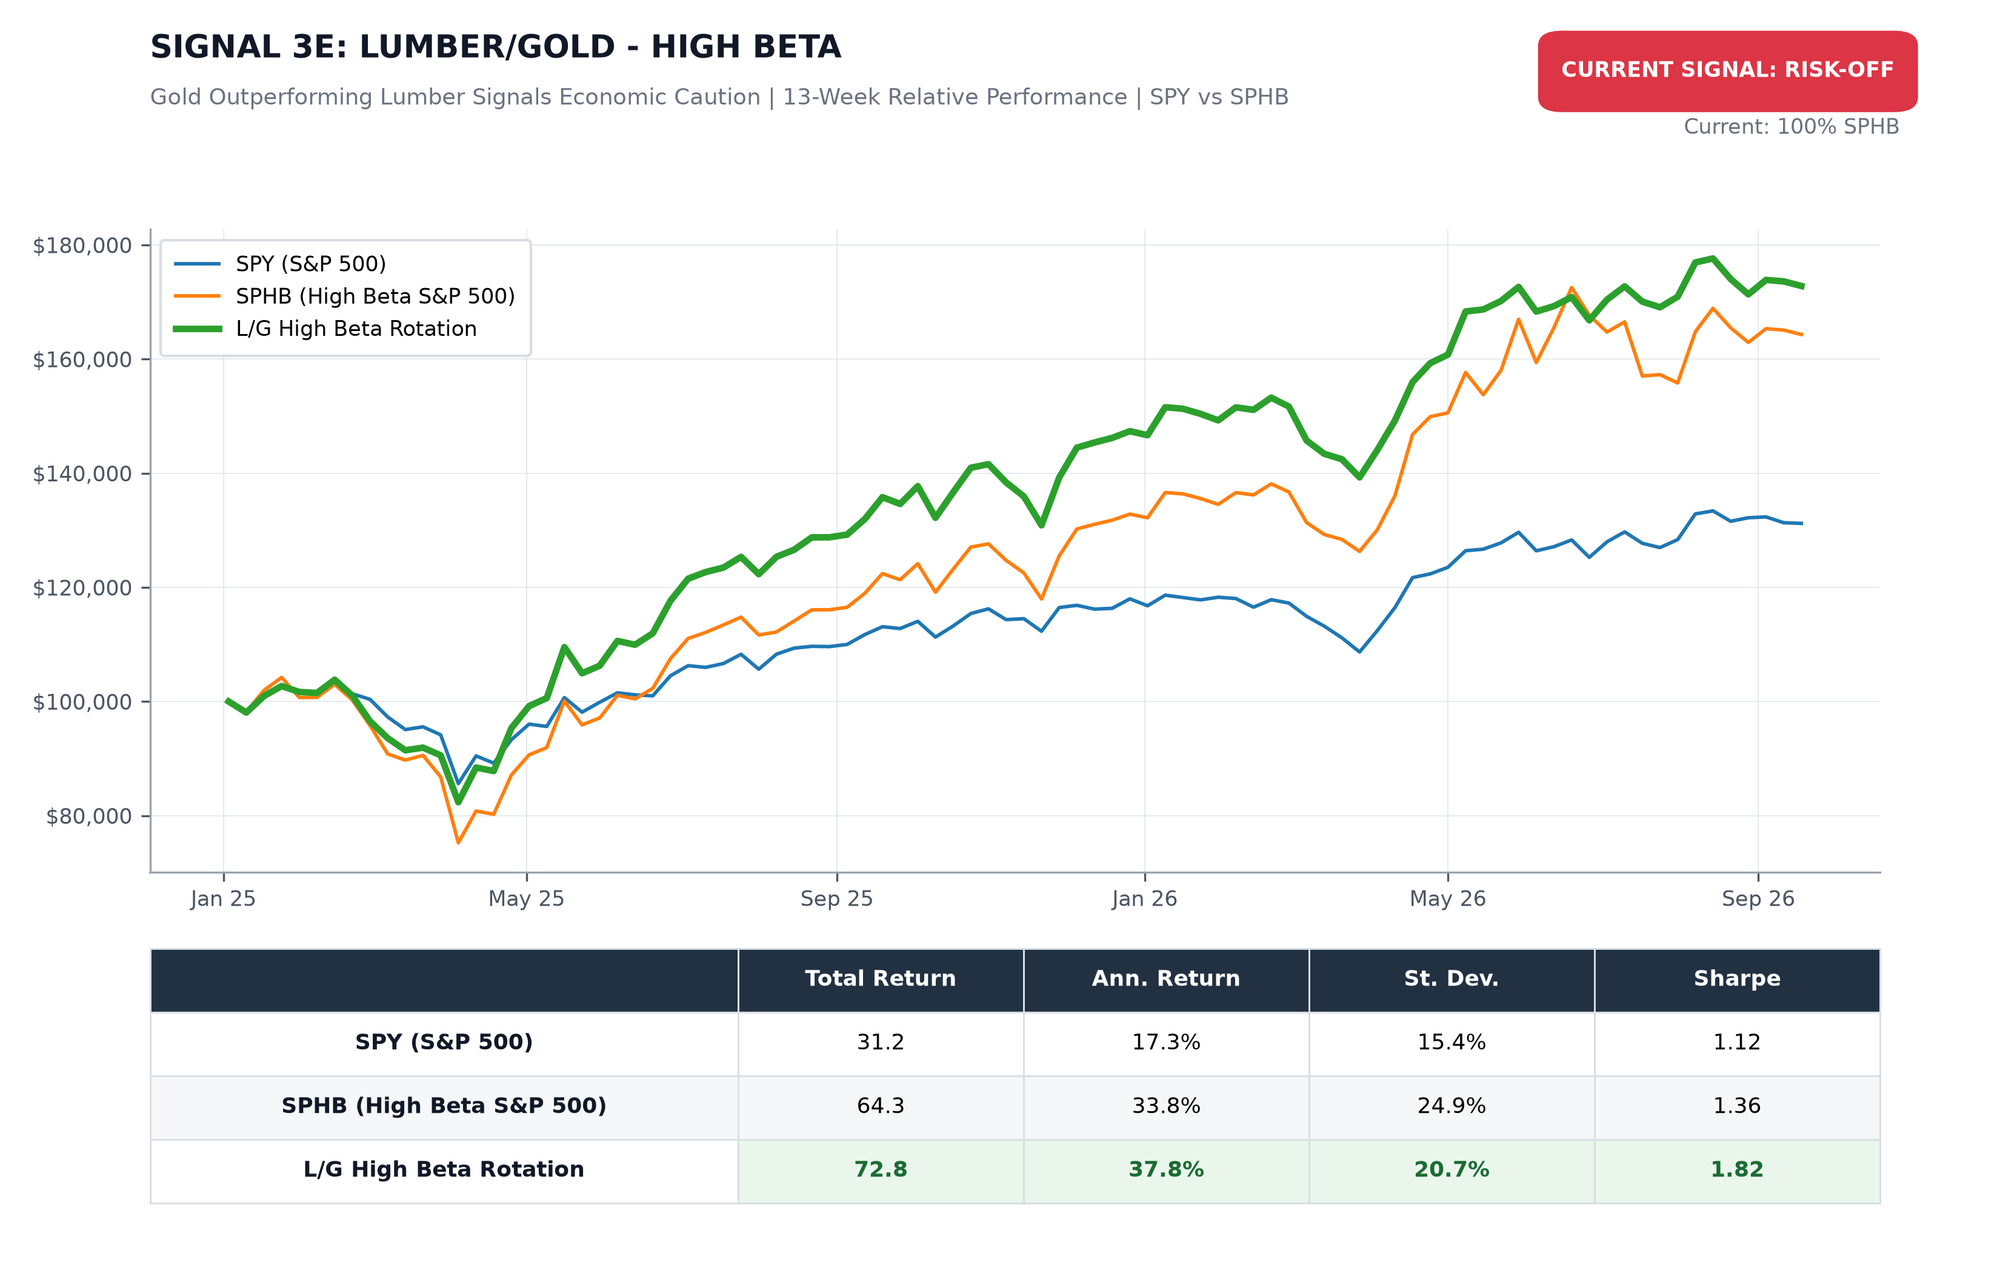
Growth of $100,000 | Since January 3, 2025 | Data: Lead-Lag Publishing, LLC
Lumber/Gold Cyclical Growth (SPY vs VUG)
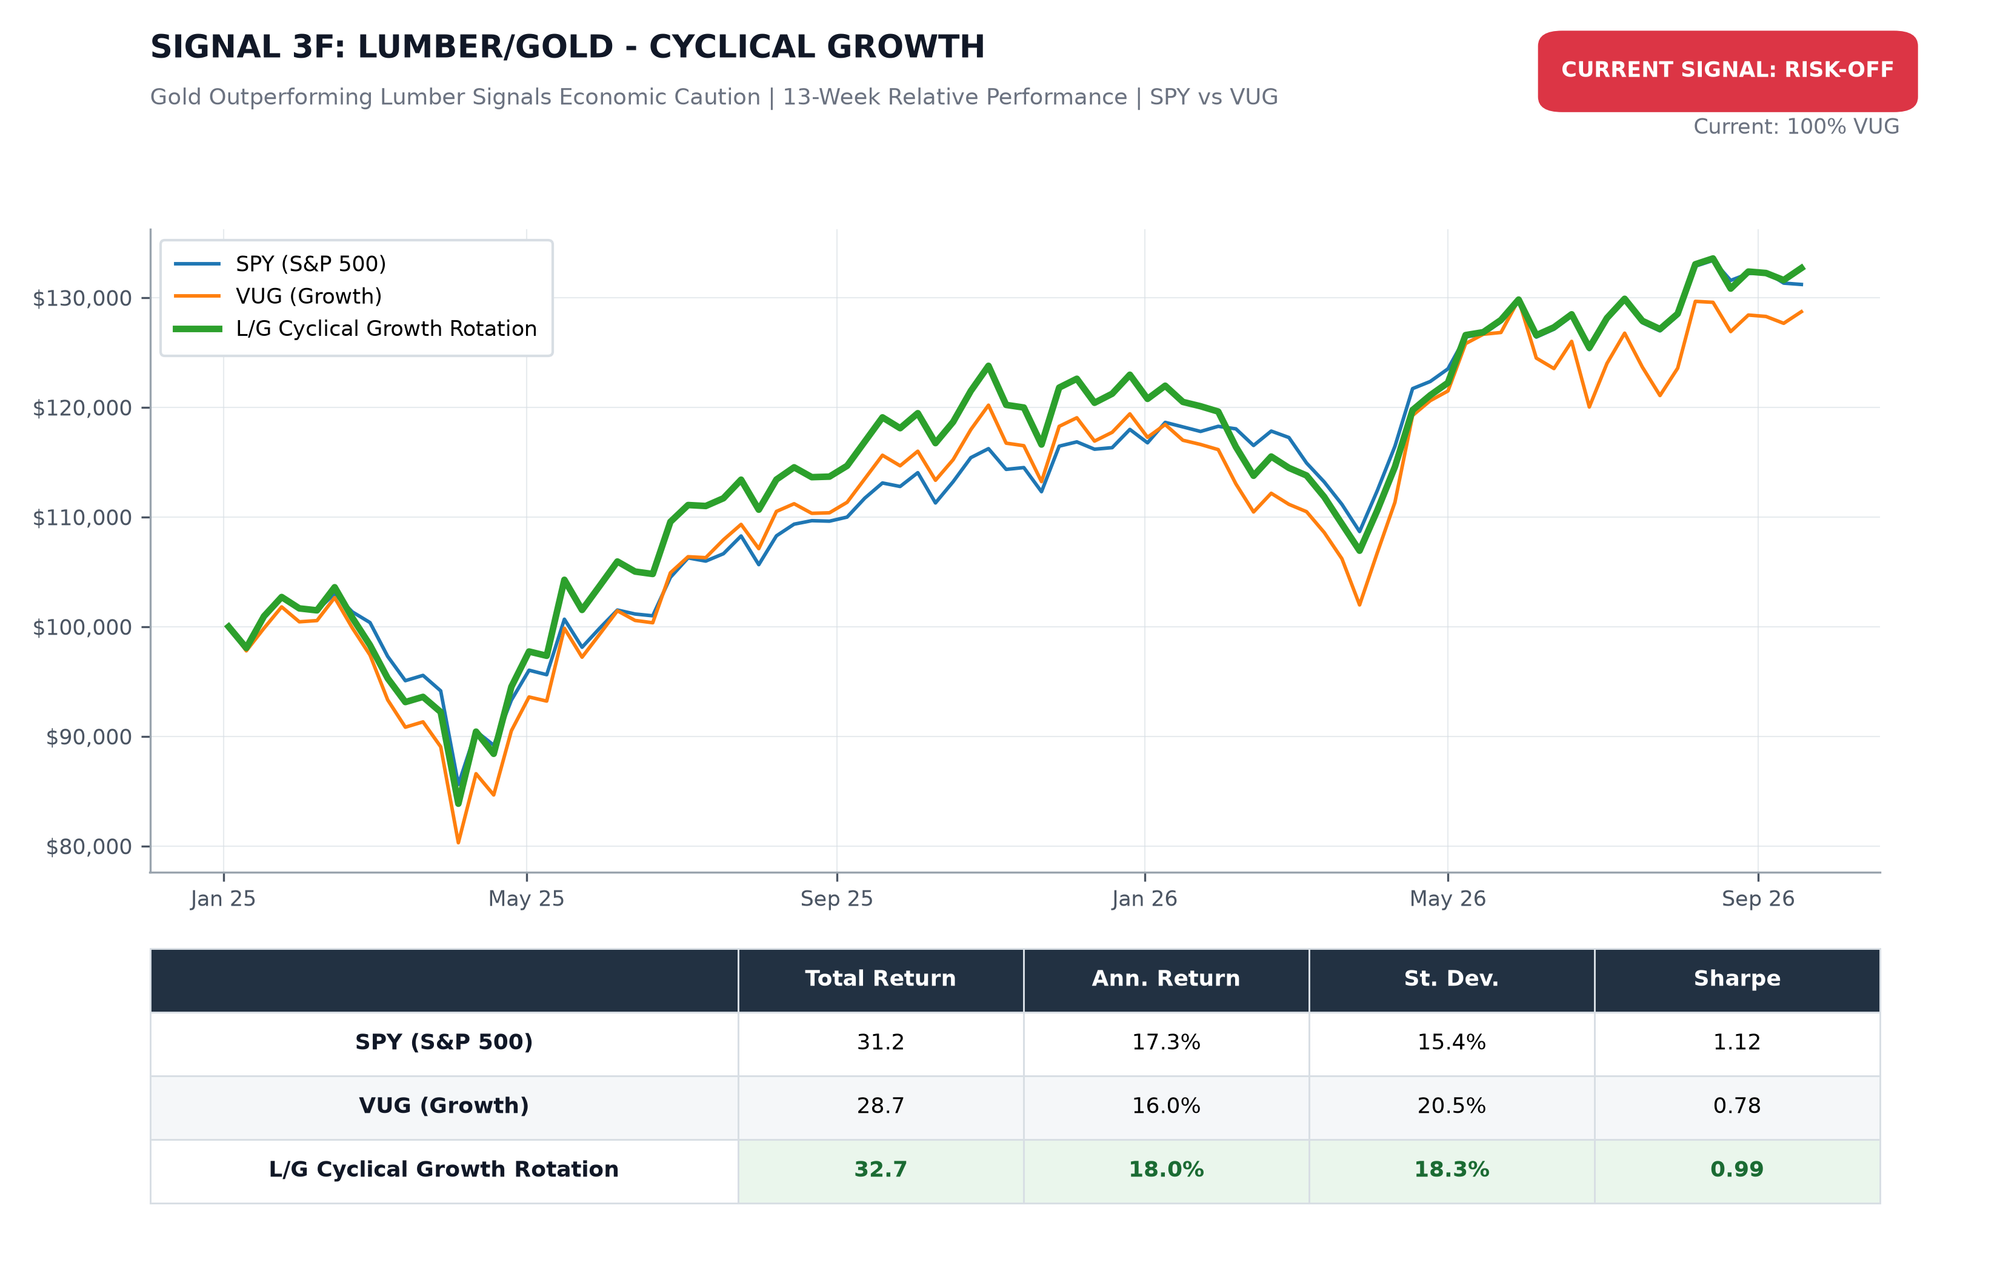
Growth of $100,000 | Since January 3, 2025 | Data: Lead-Lag Publishing, LLC
Lumber/Gold Cyclical Bond (GOVT vs VUG)
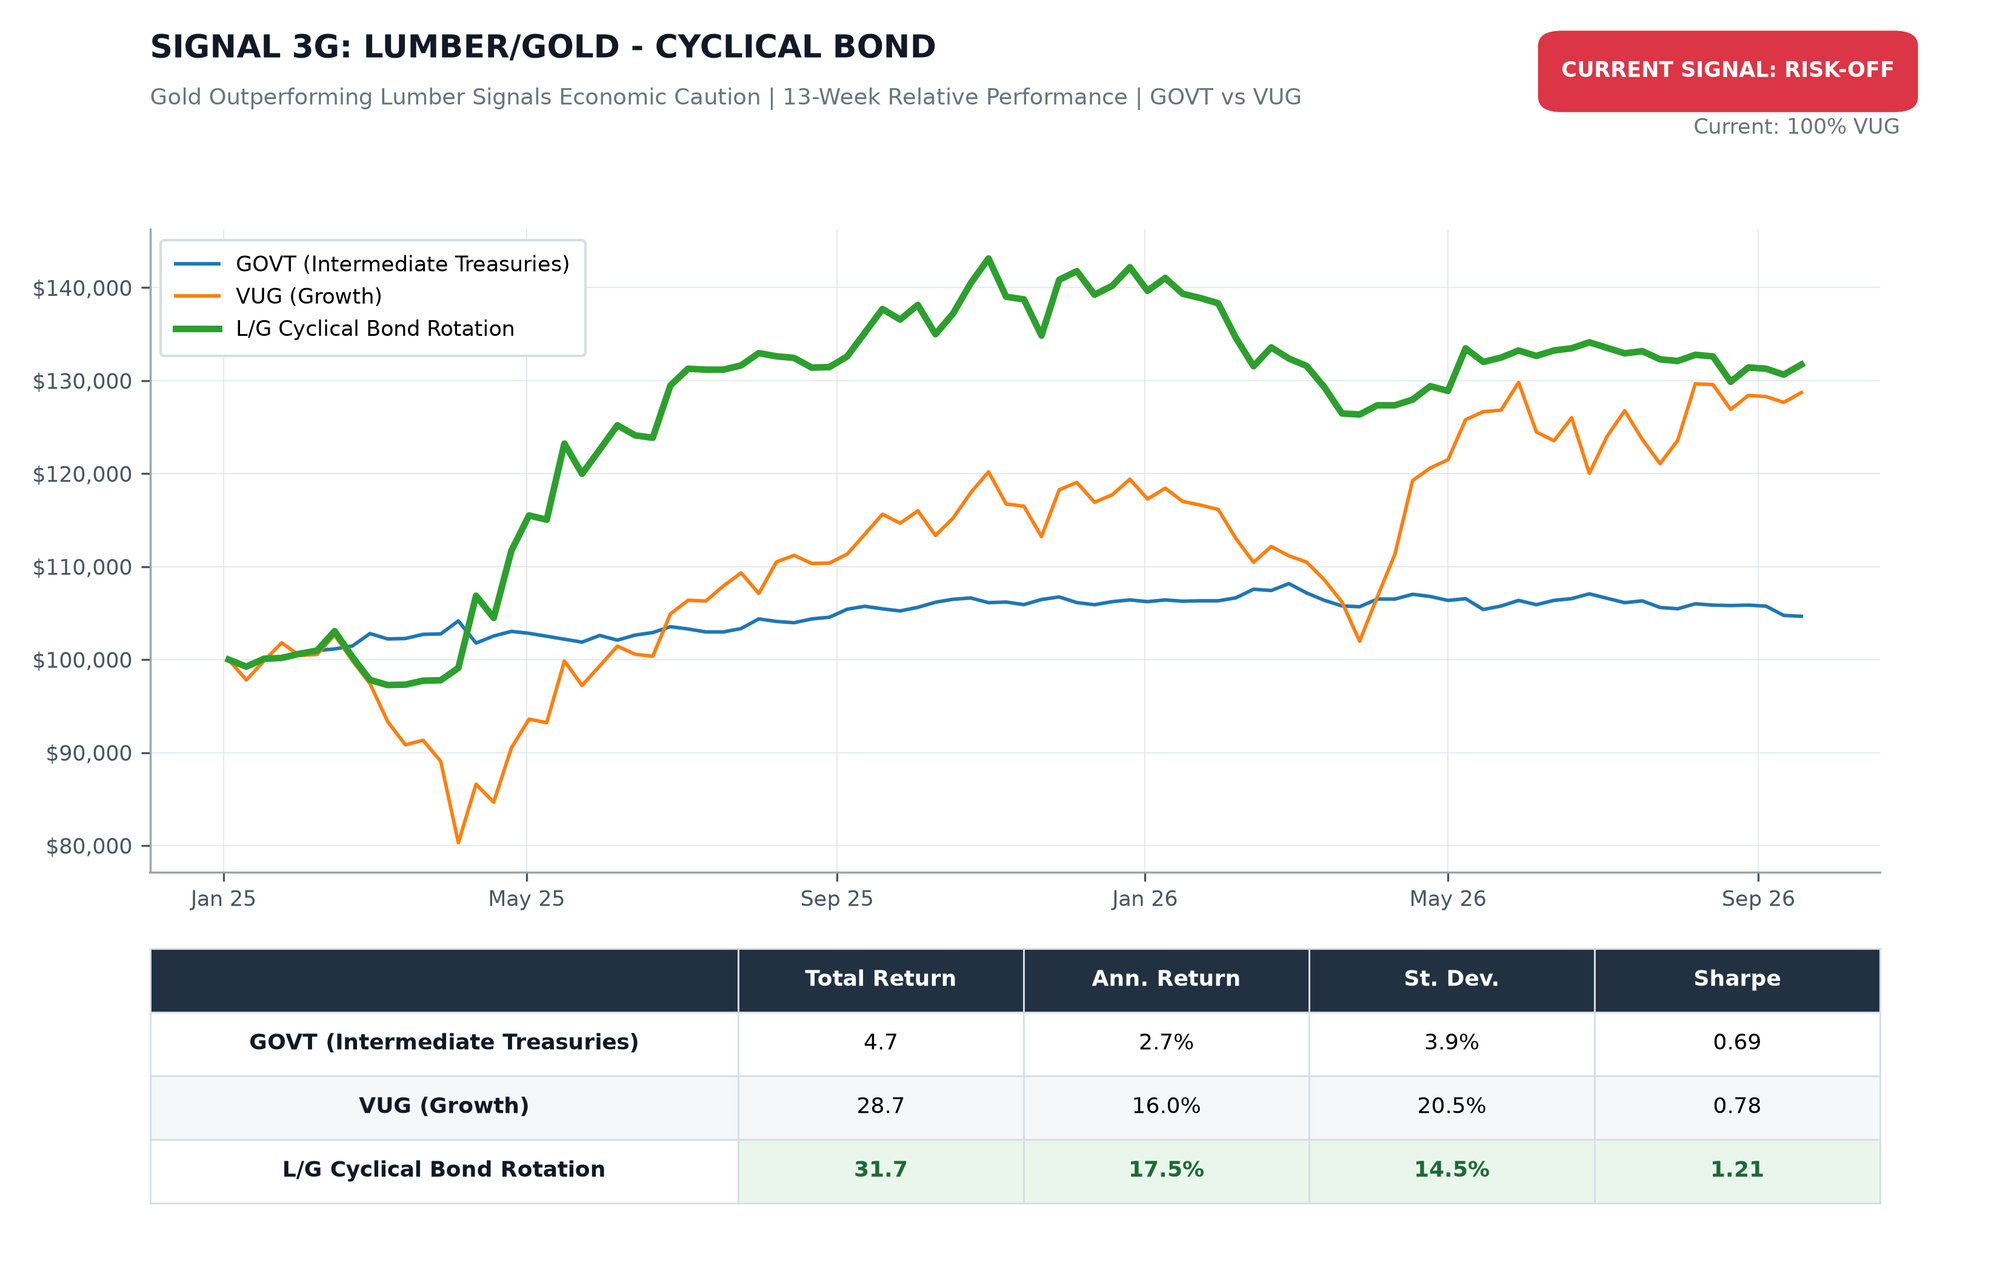
Growth of $100,000 | Since January 3, 2025 | Data: Lead-Lag Publishing, LLC
SIGNAL 4: LEVERAGE FOR THE LONG RUN
Based on: “Leverage for the Long Run” (SSRN 2741701)
Target Investor:
Aggressive investors with a long time horizon who are comfortable with leveraged equity exposure. This signal uses the S&P 500’s position relative to its 200-day simple moving average to determine whether to employ 2x leveraged exposure (SSO) or standard exposure (SPY).
CURRENT INDICATOR: RISK-ON
Conviction: 72/100 · Regime age: 24 weeks (164 days)
What would flip this signal:
Signal flips RISK-OFF when the S&P 500 closes below its 200-day SMA of 7,183 (today 7,651, +6.5%).
Prior RISK-ON regimes: Jan 2026–Mar 2026 (76d). Below-SMA episode: Mar 19–Apr 7, 2026 (20 days).
This Week’s Context:
The S&P 500 closed at 7,650.50, down 0.08% for the week, its second straight weekly decline, but the decline is orderly: the index is up 11.8% year to date and has held above its 200-day average continuously since April 8, a 164-day streak. The cushion above the average has compressed from +8.22% at the August 21 reading to +6.51% now, not because price fell hard but because the average itself kept rising while price went sideways for three weeks. That is the healthiest possible way for a cushion to shrink, and the trend regime stays risk-on until an actual close below the line. The last episode below the average, in March and April of this year, lasted just 20 days before the index reclaimed it.
Sources: morningstar.com · investopedia.com · federalreserve.gov
S&P 500 Close: 7,650.50
200-Day SMA: 7,183.05
Spread: +6.51% above the 200-day moving average
Current Allocation: 100% SSO (ProShares Ultra S&P500, 2x leveraged)
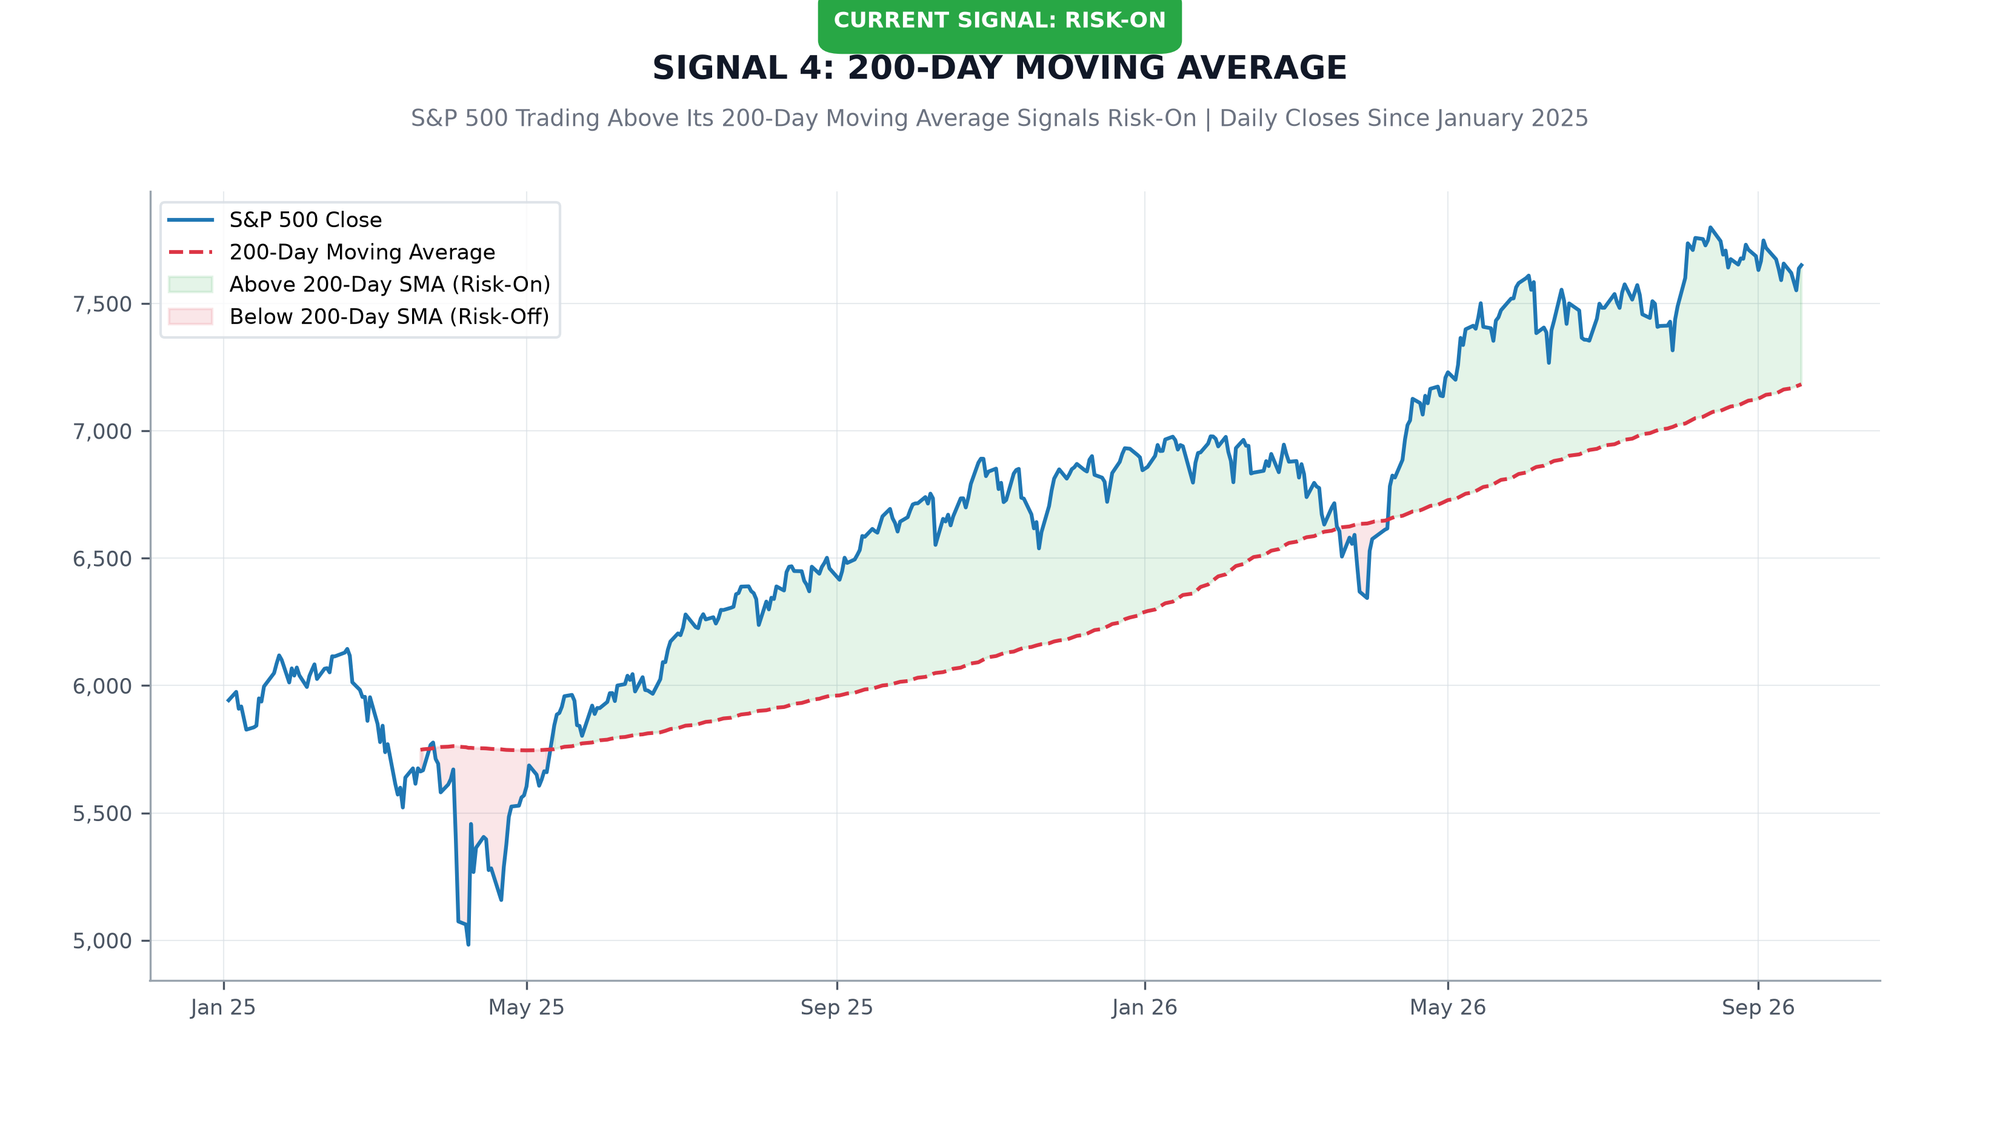
S&P 500 Index vs 200-Day Simple Moving Average | January 2025 - September 2026
Reading the chart: S&P 500 at 7,650.50. 200-day SMA at 7,183.05. Flip threshold: SPX closes below SMA. Current cushion: +6.51 percentage points.
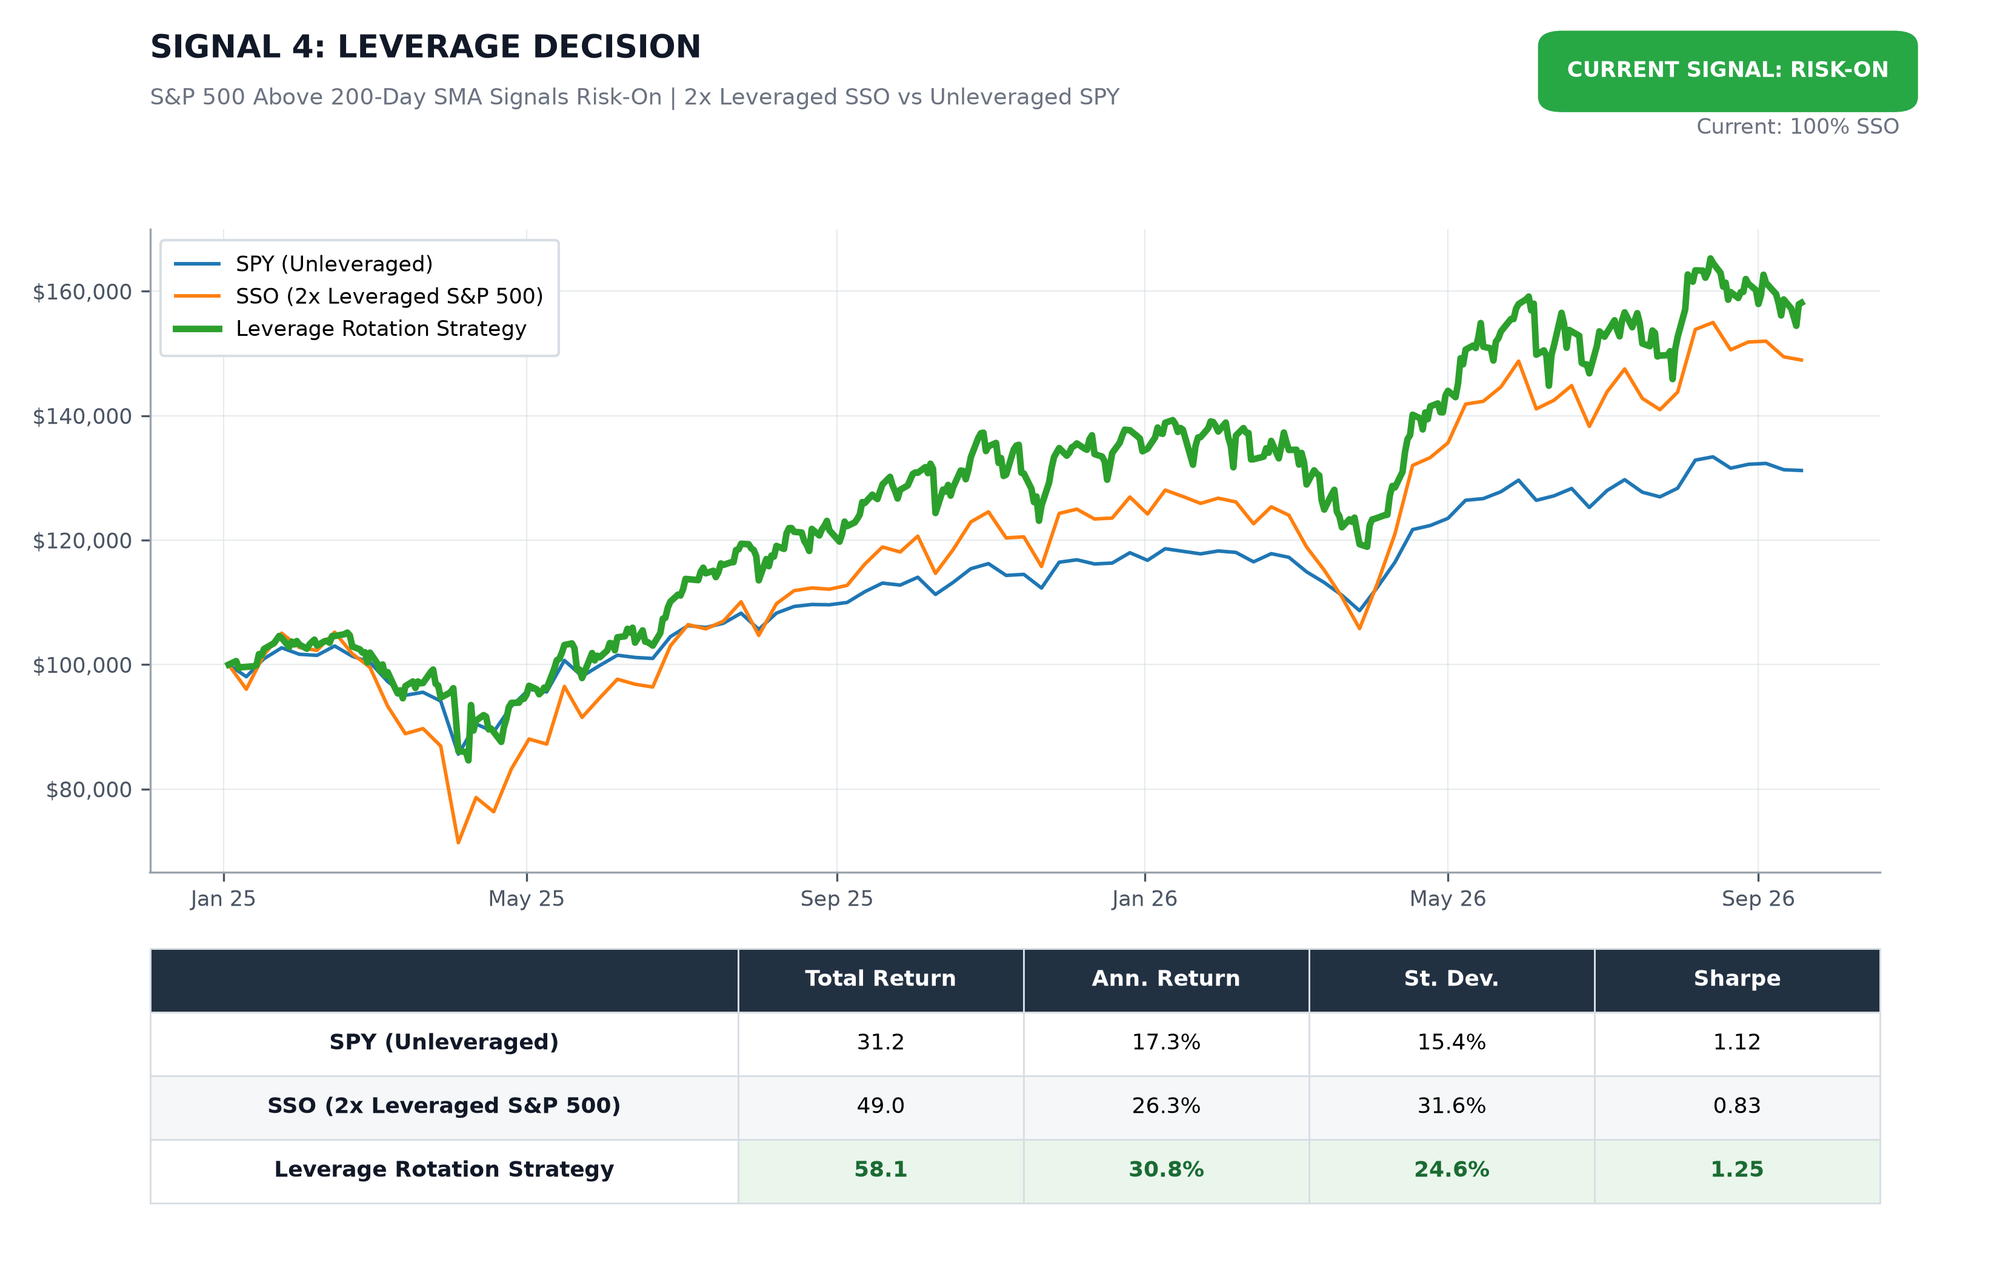
Growth of $100,000 | Since January 3, 2025 | Data: Lead-Lag Publishing, LLC
CONCLUSION & ALLOCATION GUIDANCE
The framework reads 2-2 this week. Two signals favor offensive positioning and two favor defense, with the conviction-weighted composite tilting risk-off at -18. The S&P 500 at 7,650.5 sits +6.5% above its 200-day SMA, still constructive. But the composition of this split matters more than the count: the two defensive signals are strengthening while the two offensive signals are weakening. That asymmetry is what the composite captures, and it is why the reading shifted from an offensive lean to a defensive one in a single month.
Bottom Line: Maintain the framework’s allocations as called this week. Signal 1 (RISK-ON) keeps broad equity exposure over defensive Utilities at 100% SPY, though with the weakest conviction of its regime. Signal 2 (RISK-OFF) rotates to 100% Long-Duration Treasuries (TLT) on the new August month-end reading. Signal 3 (RISK-OFF) holds defensive positioning across all seven Lumber/Gold sub-strategies with the regime’s widest spread. Signal 4 (RISK-ON) keeps the 2x leveraged SSO allocation while the index holds above its 200-day average. The 2-2 configuration demands tactical respect in both directions: respect the trend signal that is still intact, and respect the two defensive signals that are getting louder, not quieter. Risks worth watching: a fourth consecutive weekly S&P 500 decline compressing the 200-day cushion toward the flip line, utilities finishing their four-week catch-up and flipping Beta Rotation to RISK-OFF, and the September month-end Treasury reading confirming that the flight to duration was a regime and not a one-month anomaly.
Deep Dive: The Lumber/Gold Cyclical-Defensive Spread
The Lumber/Gold signal is the framework’s purest real-economy tell, and this month it is screaming. Lumber prices embed housing and construction demand, the most rate-sensitive corner of the real economy; gold embeds fear, central bank accumulation, and the desire for an asset that owes nothing to the cycle. When lumber outperforms gold over a 13-week window, the economy is building; when gold outperforms, capital is buying insurance against the very activity lumber prices depend on. The current spread of -19.38 points is the widest of this regime and among the widest of the year: lumber at a nine-month low with August housing starts down 2.6%, gold holding near four-month highs with eight straight sessions of ETF inflows. Historically, extremes in this spread cluster near inflection points in risk appetite, which is why the signal gets a Deep Dive this week. The sub-strategy rotations show what that means in practice: since the regime flipped on August 14, the defensive legs have absorbed every pairing, from Treasuries to low volatility to growth equity. Watch the spread itself for the first sign of change; it has widened every week of this regime, and a narrowing week, driven by lumber stabilizing rather than gold falling, would be the earliest evidence that the defensive tilt is peaking.
This Deep Dive rotates across all four signals on a 4-week cycle. Next week’s spotlight: The 200-Day Moving Average, Leverage and the Long Run.
The Lead-Lag Report is provided by Lead-Lag Publishing, LLC. All opinions and views mentioned in this report constitute our judgments as of the date of writing and are subject to change at any time. Information within this material is not intended to be used as a primary basis for investment decisions and should also not be construed as advice meeting the particular investment needs of any individual investor. Trading signals produced by the Lead-Lag Report are independent of other services provided by Lead-Lag Publishing, LLC or its affiliates, and positioning of accounts under their management may differ. Please remember that investing involves risk, including loss of principal, and past performance may not be indicative of future results. Lead-Lag Publishing, LLC, its members, officers, directors and employees expressly disclaim all liability in respect to actions taken based on any or all of the information on this writing.
The Lead-Lag Report is provided by Lead-Lag Publishing, LLC. All opinions and views mentioned in this report constitute our judgments as of the date of writing and are subject to change at any time. Information within this material is not intended to be used as a primary basis for investment decisions and should also not be construed as advice meeting the particular investment needs of any individual investor. Trading signals produced by the Lead-Lag Report are independent of other services provided by Lead-Lag Publishing, LLC or its affiliates, and positioning of accounts under their management may differ. Please remember that investing involves risk, including loss of principal, and past performance may not be indicative of future results. Lead-Lag Publishing, LLC, its members, officers, directors and employees expressly disclaim all liability in respect to actions taken based on any or all of the information on this writing.
About the Framework
The Weekly Signals framework aggregates four peer-reviewed intermarket signals into a single composite reading: Beta Rotation (SSRN 2417974), Tactical Risk Rotation (SSRN 2431022), Lumber/Gold Ratio (SSRN 2604248), and 200-Day Moving Average. Each signal is computed from live market data and delivered every Monday.