The Repo Whisper the Fed Doesn't Want Heard
Standing Repo Facility takeup hit $31.5 billion on December 31, 2025. SOFR traded above IORB on 31 days in Q4 alone. The relief did not come from the backstop. The Fed stopped runoff December 1 and began buying $40 billion of bills a month December 12. Read the sequence, not the label.

This Lead-Lag Report post is sponsored by Columbia Threadneedle
What if you could target only the strongest performers in an index?
Columbia Research Enhanced Core ETF (RECS) leverages the firm's quantitative research by investing in the highest-rated stocks from the Russell 1000. The result is an ETF with reduced drag and enhanced return potential at an attractive price point.
Potential benefits of RECS:
- Aims to optimize core equity exposure
- Sector-neutral to the Russell 1000
- Competitive expense ratio of 15 basis points1
1 Net and gross expense ratio. The fund's expense ratio is from the most recent prospectus.
Investors should carefully consider the investment objectives, risks, charges and expenses of the Fund before investing. To obtain a prospectus containing this and other important information, please visit columbiathreadneedleus.com/etf to view or download a prospectus. Read the prospectus carefully before investing.
Investing involves risks, including the risk of loss of principal. Market risk may affect a single issuer, sector of the economy, industry or the market as a whole. The fund is passively managed and seeks to track the performance of an index. There is no guarantee that the index and, correspondingly, the fund will achieve positive returns. Risk exists that the index provider may not follow its methodology for index construction. Errors may result in a negative fund performance. The fund's net asset value will generally decline when the market value of its targeted index declines. The fund concentrates its investments in issuers of one or more particular industries to the same extent as the underlying index. Investments in a narrowly focused sector may exhibit higher volatility than investments with a broader focus. Investments selected using quantitative methods may perform differently from the market as a whole and may not enable the fund to achieve its objective. Investment in larger companies may involve certain risks associated with their larger size and may be less able to respond quickly to new competitive challenges than smaller competitors. Investments in mid-cap companies often involve greater risks that investments in larger companies and may have less predictable earning and be less liquid than the securities in larger firms. Growth securities, at times, may not perform as well as value securities or the stock market in general and may be out of favor with investors. Value securities may be unprofitable if the market fails to recognize their intrinsic worth or the portfolio manager misgauged that worth. Although the fund's shares are listed on an exchange, there can be no assurance that an active, liquid or otherwise orderly trading market for shares will be established or maintained. The Fund may have portfolio turnover, which may cause an adverse cost impact. There may be additional portfolio turnover risk as active market trading of the fund's shares may cause more frequent creation or redemption activities that could, in certain circumstances, increase the number of portfolio transactions as well as tracking error to the Index and high levels of transactions increase brokerage and other transaction costs and may result in increased taxable capital gains.
ETF shares are bought and sold at market price (not NAV) and are not individually redeemable. Investors buy and sell shares on a secondary market. Shares may trade at a premium or discount to the NAV. Only market makers or "authorized participants" may trade directly with the Fund(s), typically in blocks of 50,000 shares.
Shares are not FDIC insured, may lose value, and have no bank guarantee.
For broker/dealer or institutional use only.
The ETFs are distributed by ALPS Distributors, Inc. Columbia Management Investment Advisers, LLC serves as the investment manager. Columbia Threadneedle Investments is the global brand name of the Columbia and Threadneedle group of companies.
DISCLAIMER – PLEASE READ: This is sponsored advertising content for which Lead-Lag Publishing, LLC has been paid a fee. The information provided in the link is solely the creation of Columbia Threadneedle. Lead-Lag Publishing, LLC does not guarantee the accuracy or completeness of the information provided in the link or make any representation as to its quality. All statements and expressions provided in the link are the sole opinion of Columbia Threadneedle and Lead-Lag Publishing, LLC expressly disclaims any responsibility for action taken in connection with the information provided in the link.
Key Highlights
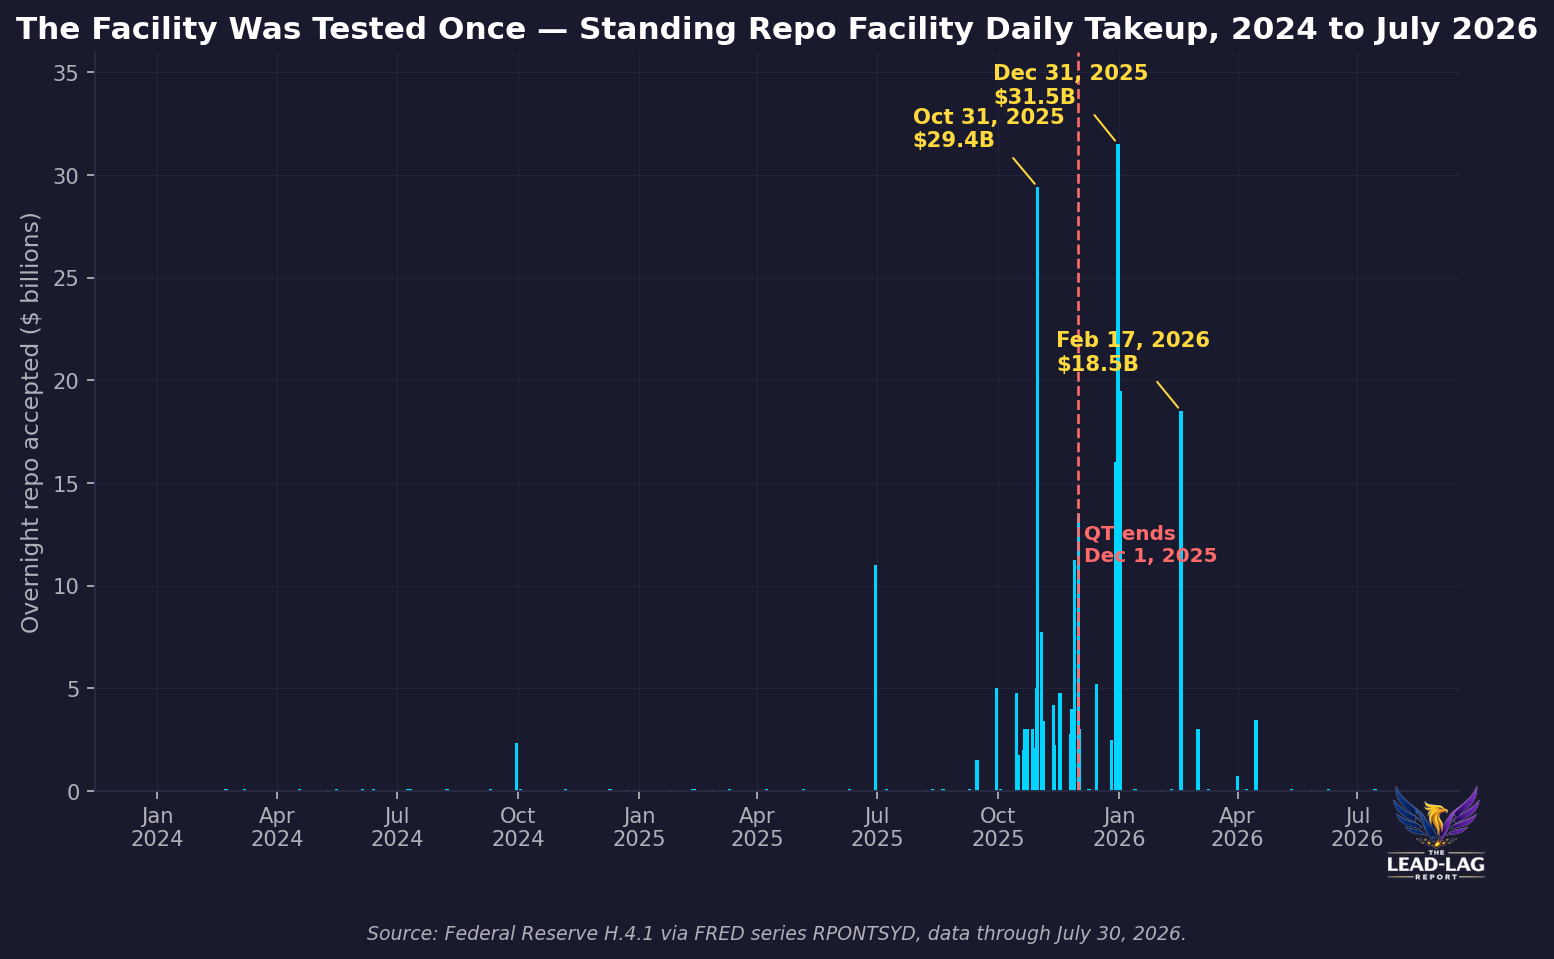
- Standing Repo Facility takeup peaked at $31.5 billion on December 31, 2025, and $29.4 billion on October 31, 2025 — 24 of the 32 days with takeup above $1 billion since January 2024 fell inside a single quarter.
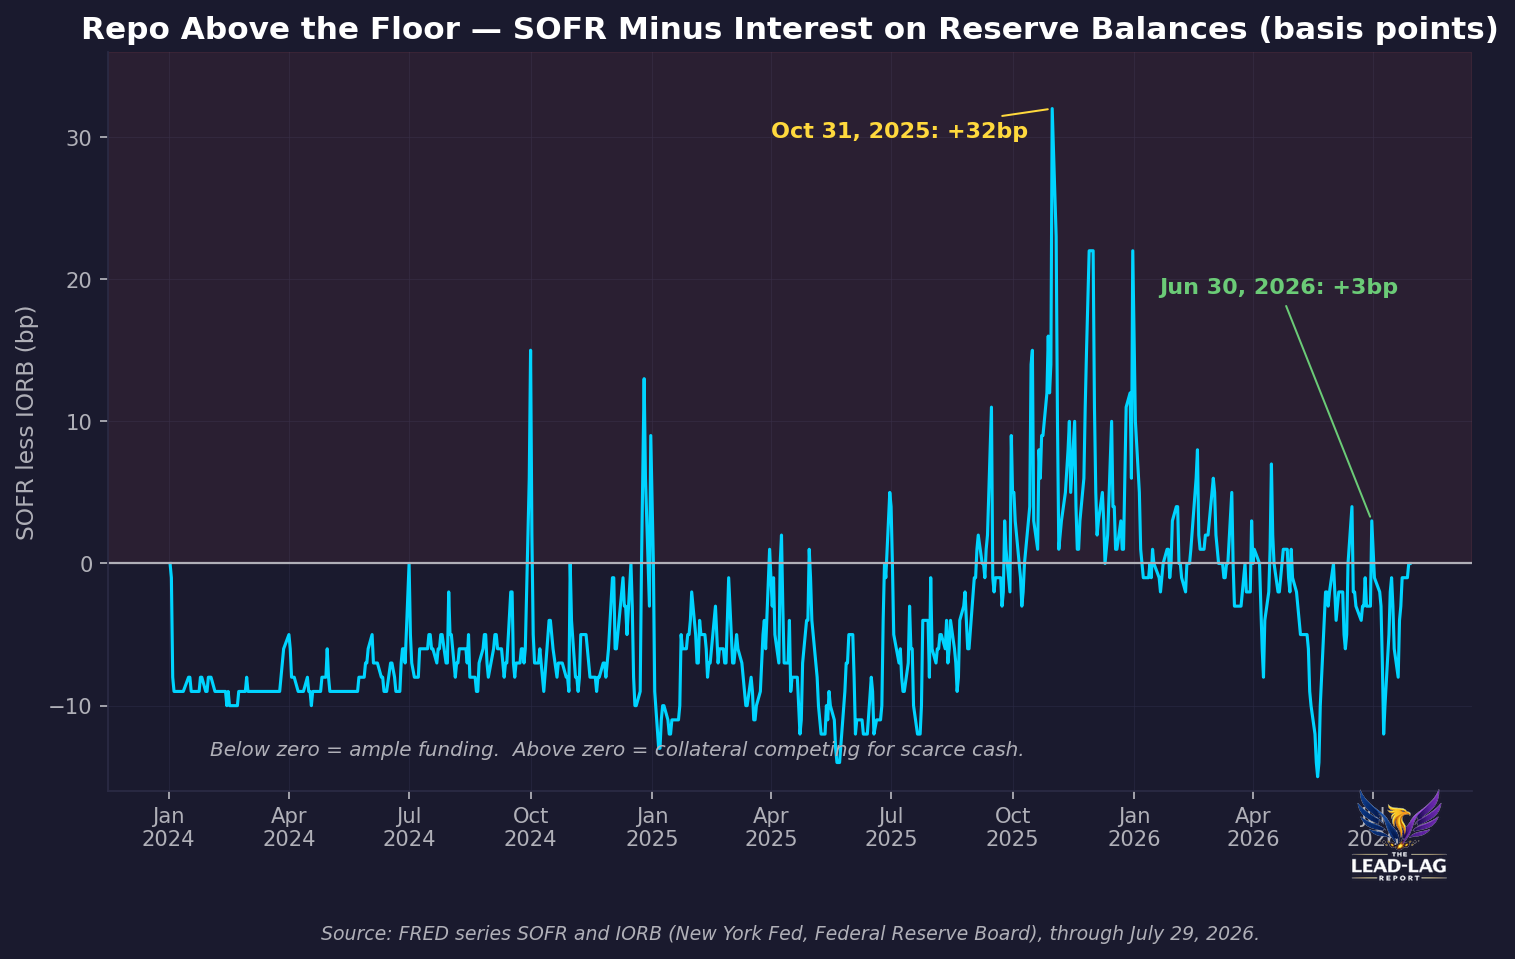
- SOFR traded above interest on reserve balances on 31 days in the fourth quarter of 2025, averaging seven basis points over the floor and reaching plus 32 basis points on October 31.
- The calm since is not evidence the backstop works. The Fed stopped runoff on December 1, 2025 and began buying $40 billion of Treasury bills a month on December 12.
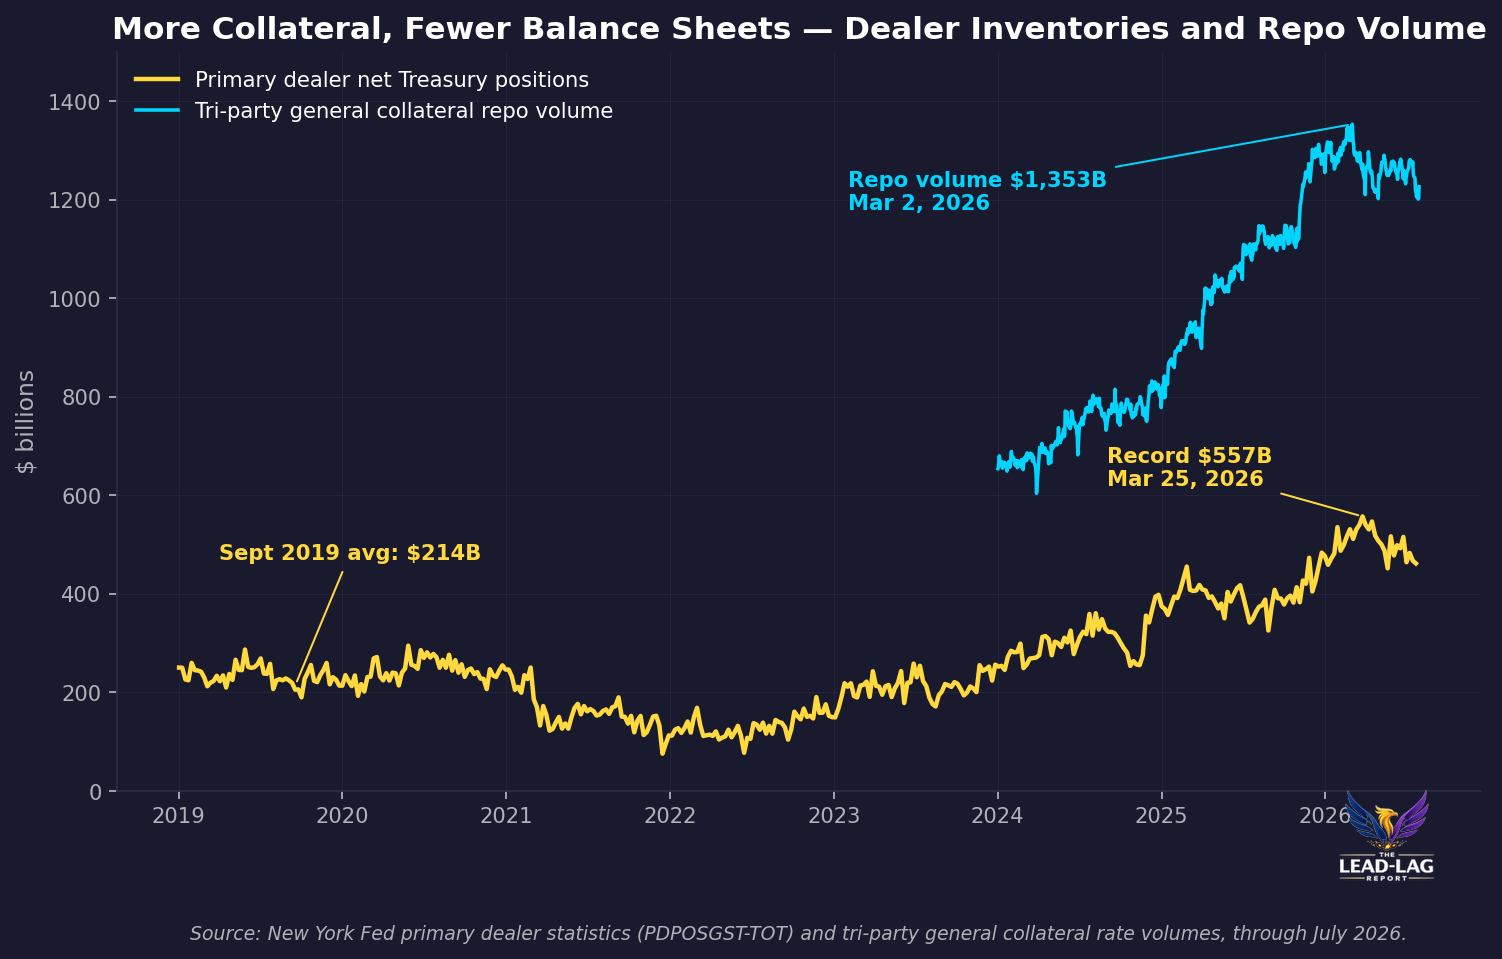
- Tri-party general collateral repo volume has gone from roughly $663 billion a day in January 2024 to $1.25 trillion, while the reverse repo buffer has been drained to nearly zero.
- Primary dealer net Treasury positions are more than double their September 2019 average. The plumbing is carrying more collateral on the same constrained balance sheets.
The consensus on repo is that the argument is over. The Standing Repo Facility exists, it is open twice a day, it has a $500 billion aggregate limit, and the September 2019 spike cannot happen again because a lender of first resort now sits underneath the market.[16] That is the story told at every funding conference since the FOMC created the facility in July 2021.[17] It is half right, and the half that is wrong is the half that matters.
Here is what actually happened. The facility got tested for the first time in its life between October 2025 and February 2026. It cleared. And within weeks of that test, the Federal Reserve quietly stopped shrinking its balance sheet and started buying Treasury bills again. The market read the outcome as proof of the backstop. The record reads as proof that the backstop was not enough on its own.
What the takeup data says
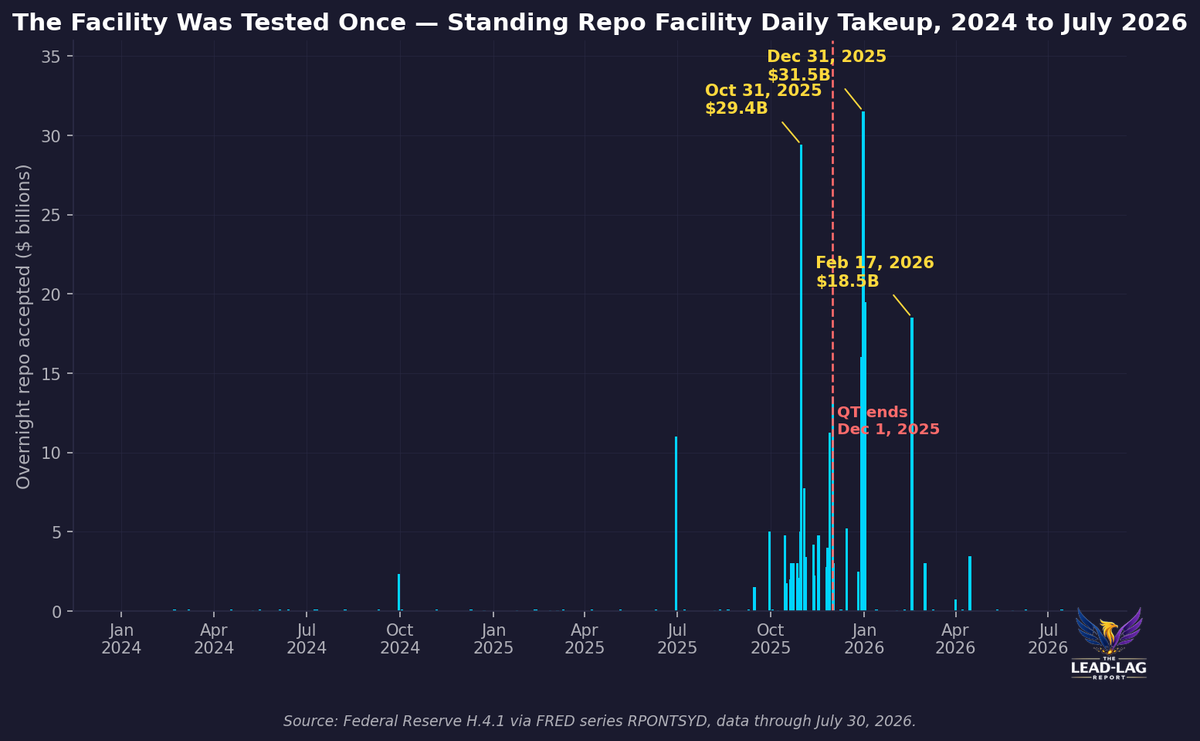
Daily overnight repo accepted by the Desk ran at literal rounding-error levels through 2024 and most of 2025 — a hundred million dollars here, a token proposition there. Then it did not. Takeup hit $11.0 billion at the June 2025 quarter-end, $29.4 billion on October 31, 2025, and $31.5 billion on December 31, 2025, with follow-on prints of $19.5 billion on January 2 and $18.5 billion on February 17, 2026.[1] Of the 32 days since January 2024 with takeup at or above $1 billion, 24 sit inside the fourth quarter of 2025.[2] That is not a facility idling in the background. That is a facility absorbing a shock.
The price data corroborates it. SOFR printed above interest on reserve balances on 31 separate days in the fourth quarter of 2025, averaged seven basis points over the administered floor for the quarter, and peaked at plus 32 basis points on October 31.[3] The tri-party general collateral rate, the cleanest read on where cash actually clears against Treasury collateral, ran 25 basis points above IORB on the same day.[4] For a system that had spent three years with repo pinned five to twelve basis points below the floor, that is a regime change compressed into ten weeks.
None of this is in dispute. The series are published daily by the New York Fed and the Board. The dispute is over what ended it.
The relief did not come from the facility
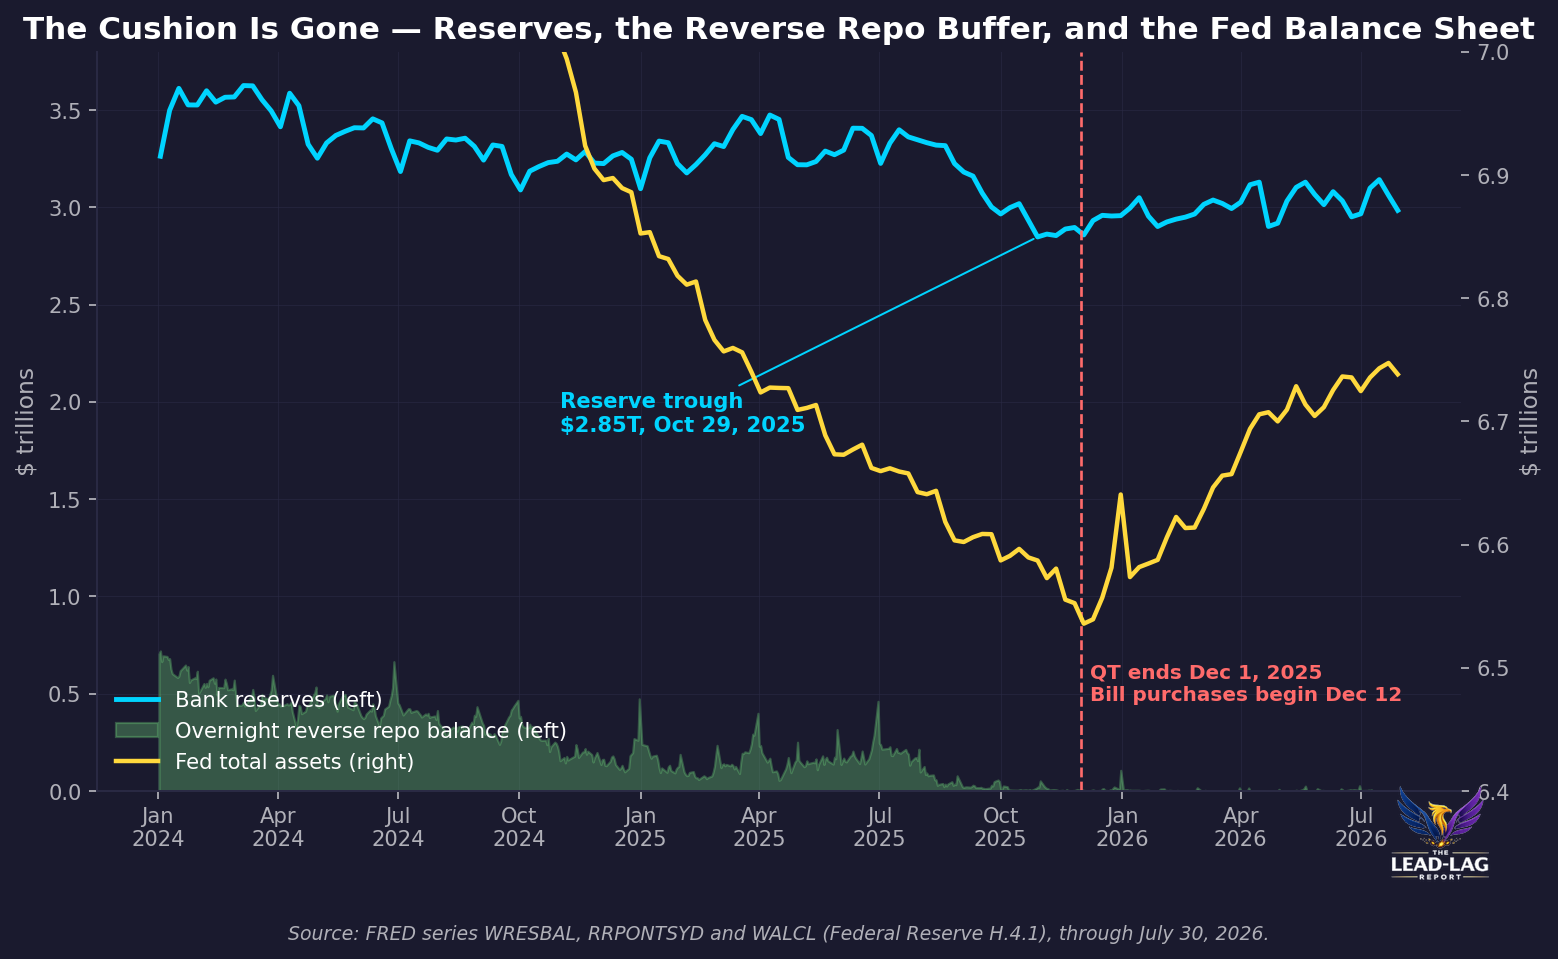
On October 29, 2025, the FOMC announced it would cease runoff of its securities holdings starting December 1, ending a program that had removed more than $2.2 trillion of securities since June 2022.[5] Eleven days after runoff stopped, the Desk began reserve management purchases of roughly $40 billion of Treasury bills per month, starting December 12.[6] Total Fed assets bottomed at $6.552 trillion on November 26, 2025 and have since climbed to $6.738 trillion — an expansion of $186 billion in eight months.[7] Reserves bottomed at $2.848 trillion on October 29, 2025 and now sit near $2.98 trillion.[8]
Look at the sequence rather than the labels. Funding pressure appeared. The central bank reversed the direction of its balance sheet. Funding pressure went away. By the June 30, 2026 quarter-end, SOFR cleared three basis points over IORB and facility takeup was effectively zero; the second quarter averaged minus three basis points and the third quarter to date is running at minus 3.4.[9] That is a healthy print. It is also a print produced by a balance sheet that is growing, not by a facility that is available.
The distinction is not academic. A backstop that clears at a penalty rate ten basis points above IORB — the offering rate was 3.75 percent against a 3.65 percent IORB this week — only gets used when the private market has already failed to clear.[10] Every dollar of takeup is a dealer telling you it could not find cash at a better price. The facility is a stress gauge that happens to also be a valve. Treating the gauge as the cure is the error.
Why 2019 is the wrong analogy and the right mechanism
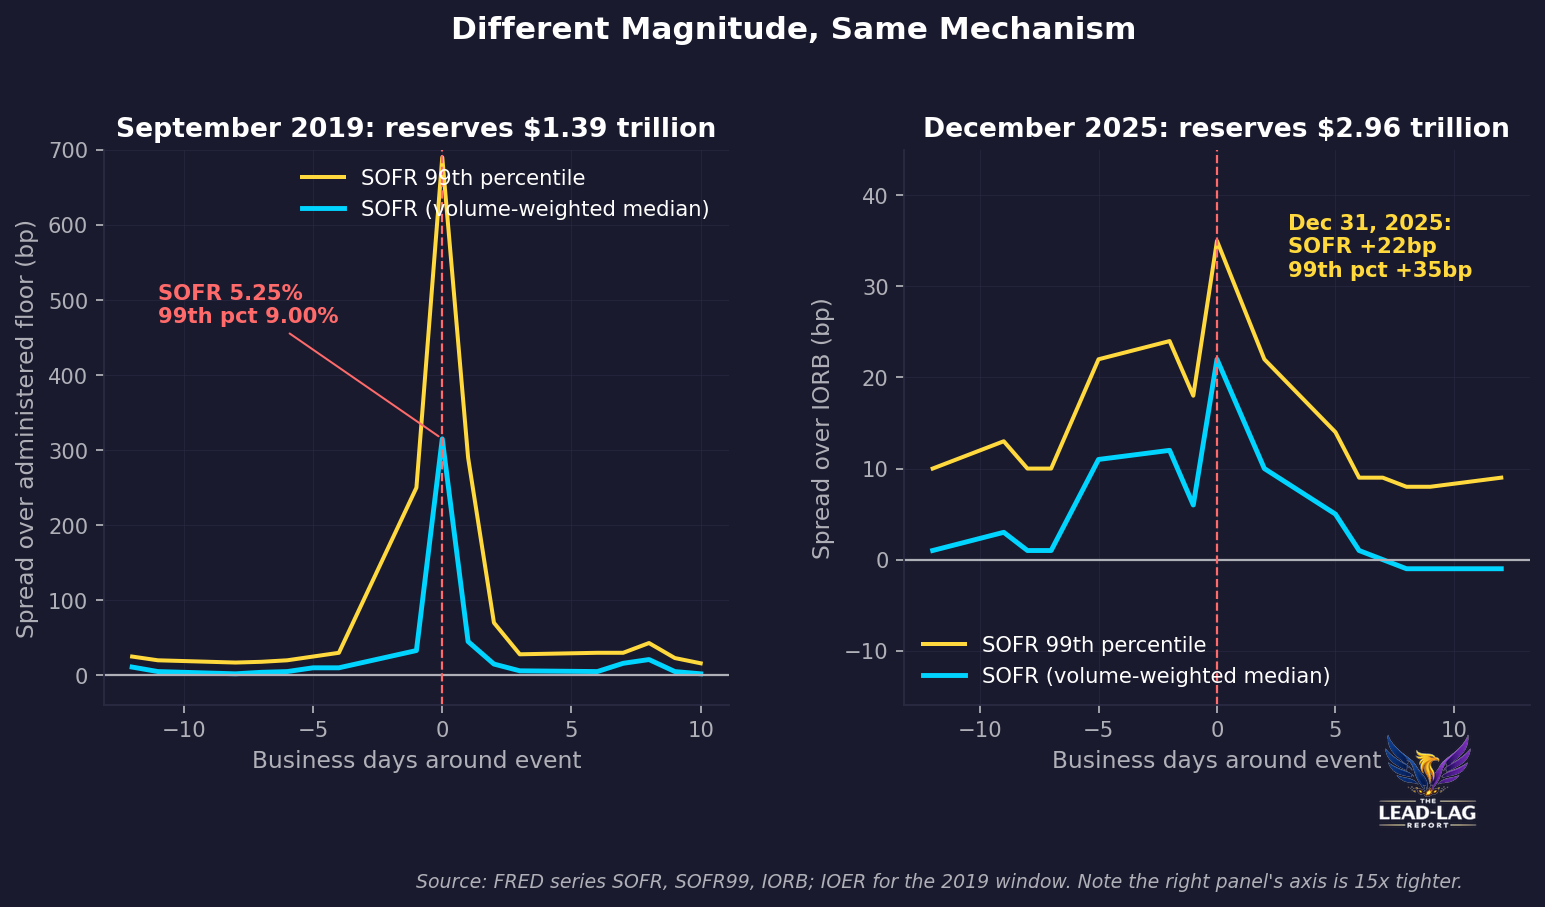
September 17, 2019 was violent. SOFR printed 5.25 percent against an administered floor near 2.10 percent, the 99th percentile of the distribution reached 9.00 percent, and the effective fed funds rate broke above the top of the target range.[11] Reserves at that point were $1.394 trillion. The Desk injected $40.9 billion in its first overnight operation and was up to $59.2 billion by September 20.[12] December 2025 was nothing like that in magnitude: 22 basis points, not 315.
The magnitudes differ. The mechanism does not. In both episodes, cash providers pulled back into quarter-end, dealers found their balance sheets binding against a growing pile of Treasury collateral, and the price of overnight money jumped through the ceiling the Fed thought it had built. The difference is that in 2019 the Fed had no facility and had to improvise; in 2025 it had a facility and still had to change the direction of the balance sheet.
What has grown in the intervening years is the collateral load. Tri-party general collateral volume averaged $663 billion a day in January 2024 and averaged $1.247 trillion in July 2026, with a record $1.353 trillion on March 2, 2026.[13] Primary dealer net Treasury positions hit a record $557 billion on March 25, 2026 and stood at $462 billion on July 22 — against a September 2019 average of $214 billion.[14] Dealers are warehousing more than twice the inventory they carried into the last funding accident, and they are doing it with the same leverage-ratio arithmetic constraining quarter-end window dressing.
The other change is that the shock absorber is gone. The overnight reverse repo facility held over $700 billion in early 2024 and functioned as a cash reservoir that money funds could drain into repo whenever rates rose. On July 30, 2026 the balance was $1.1 billion.[15] There is no longer a pool of idle cash sitting one basis point away from the repo market waiting to arbitrage a quarter-end squeeze. The next time collateral overwhelms intermediation capacity, the marginal lender has to be the Fed, at a penalty rate, in public, with the data printed the next morning.
Positioning implications
This is a regime question, not a trade. Three exposures inherit the answer.
- Front-end basis. If quarter-end repo pressure recurs while reserve growth is calibrated to currency demand rather than to dealer capacity, SOFR-versus-IORB widening flows straight into SOFR-linked floating coupons and futures-implied policy paths, independent of anything the FOMC decides.
- Funding-sensitive carry. Levered basis and relative-value books financed in tri-party are the first to be repriced when general collateral clears above the floor. October through December 2025 was a ten-week dress rehearsal for what that repricing looks like.
- Bank liquidity dispersion. Aggregate reserves of $2.98 trillion say nothing about distribution. The institutions that show up at the facility are the ones whose reserves are not where the collateral is.
The asymmetry sits in how the market prices the possibility. Repo stress is currently treated as a solved problem, which means it carries no premium. Solved problems that were solved by a policy reversal rather than by a structural fix tend to reprice quickly when the policy reversal reaches its limit. Reserve management purchases are sized to keep reserves ample as currency in circulation grows. They are not sized to absorb a Treasury issuance calendar that keeps expanding dealer inventories.
What would prove this wrong
A clean falsification test exists, and it prints on a schedule. If the September 30 and December 31, 2026 quarter-ends pass with SOFR clearing below IORB and facility takeup under $1 billion while reserves are flat or falling and dealer Treasury positions remain above $450 billion, then intermediation capacity is genuinely adequate and the 2025 episode was a one-off adjustment to the end of runoff. If instead the pattern from last October repeats — spreads through the floor, takeup in the tens of billions, relief only after the Desk increases purchases — then the facility is doing what a fire extinguisher does, which is not the same thing as fireproofing.
The Fed did not prove that the Standing Repo Facility prevents funding accidents. It proved that when funding markets strain, the balance sheet has to grow, and that the facility buys time until it does. Consensus heard the all-clear. The data recorded a rescue.
Few understand this.
— — —
Notes
[1] Federal Reserve H.4.1 overnight repurchase agreements, FRED series RPONTSYD, daily values through July 30, 2026. https://fred.stlouisfed.org/series/RPONTSYD
[2] Author's count of RPONTSYD daily observations at or above $1.0 billion, January 1, 2024 through July 30, 2026. https://fred.stlouisfed.org/series/RPONTSYD
[3] FRED series SOFR (New York Fed) less FRED series IORB (Federal Reserve Board), daily. Fourth-quarter 2025 average +7.0bp; 31 observations above +5bp; maximum +32bp on October 31, 2025. https://fred.stlouisfed.org/series/SOFR and https://fred.stlouisfed.org/series/IORB
[4] New York Fed tri-party general collateral rate, secured reference rates data, October 31, 2025 print of 25bp over IORB. https://www.newyorkfed.org/markets/reference-rates/tgcr
[5] Federal Reserve Board, Policy Normalization: the FOMC announced on October 29, 2025 that it would cease runoff of securities holdings starting December 1, 2025, after a reduction of more than $2.2 trillion since June 2022. https://www.federalreserve.gov/monetarypolicy/policy-normalization.htm
[6] Report to the Secretary of the Treasury from the Treasury Borrowing Advisory Committee, February 4, 2026: balance sheet reduction ended December 1 and reserve management purchases of $40 billion per month of Treasury bills began December 12. https://home.treasury.gov/news/press-releases/sb0385
[7] Federal Reserve total assets, FRED series WALCL: $6.552 trillion on November 26, 2025 and $6.738 trillion on July 29, 2026. https://fred.stlouisfed.org/series/WALCL
[8] Reserve balances with Federal Reserve Banks, FRED series WRESBAL: $2.848 trillion on October 29, 2025 and $2.985 trillion on July 29, 2026. https://fred.stlouisfed.org/series/WRESBAL
[9] FRED series SOFR less IORB: +3bp on June 30, 2026; second-quarter 2026 average -3.1bp; third-quarter 2026 to date -3.4bp. Facility takeup on June 30, 2026 was zero per RPONTSYD. https://fred.stlouisfed.org/series/SOFR
[10] New York Fed repo operation results, July 30, 2026 operations at an offering rate of 3.75 percent, against IORB of 3.65 percent. https://www.newyorkfed.org/markets/domestic-market-operations/monetary-policy-implementation/repo-reverse-repo-agreements and https://fred.stlouisfed.org/series/IORB
[11] FRED series SOFR and SOFR99 (99th percentile), September 17, 2019: 5.25 percent and 9.00 percent respectively; FRED series EFFR at 2.30 percent. https://fred.stlouisfed.org/series/SOFR99
[12] FRED series WRESBAL, week ending September 18, 2019: $1.394 trillion. FRED series RPONTSYD: $40.85 billion accepted September 17, 2019, rising to $59.15 billion September 20, 2019. https://fred.stlouisfed.org/series/WRESBAL
[13] New York Fed tri-party general collateral rate volumes: January 2024 daily average $663 billion; July 2026 daily average $1.247 trillion; record $1.353 trillion on March 2, 2026. https://www.newyorkfed.org/markets/reference-rates/tgcr
[14] New York Fed primary dealer statistics, series PDPOSGST-TOT (net outright Treasury positions): record $557.1 billion on March 25, 2026; $461.6 billion on July 22, 2026; September 2019 weekly average $213.8 billion. https://www.newyorkfed.org/markets/counterparties/primary-dealers-statistics
[15] Overnight reverse repurchase agreements, FRED series RRPONTSYD: $1.076 billion on July 30, 2026 versus balances above $700 billion in the first quarter of 2024. https://fred.stlouisfed.org/series/RRPONTSYD
[16] Standing Repo Facility operational parameters, New York Fed FAQ: $500 billion aggregate operation limit, $20 billion per proposition, twice-daily operations effective June 26, 2025. https://www.newyorkfed.org/markets/repo-agreement-ops-faq-250528
[17] The FOMC established the Standing Repo Facility on July 28, 2021 for primary dealers and eligible depository institutions. https://www.federalreserve.gov/newsevents/pressreleases/monetary20210728a.htm