
Volatility Cannot Price This Risk
Every gauge a portfolio owns reads calm. The exposure that already did the damage is not one of the things they measure.


Today’s Lead-Lag Report post is sponsored by TappAlpha

Income while staying fully invested in equities.
TappAlpha S&P 500 Growth & Daily Income ETF (TSPY)
TappAlpha Innovation 100 Growth & Daily Income ETF (TDAQ)
Investors have always had to choose: generate income or stay fully invested. TSPY and TDAQ do both—adding tax-efficient income potential to the S&P 500 and Nasdaq-100.
A tax-efficient alternative to traditional income strategies. Growth + Income — with the TappAlpha Growth & Daily Income ETFs.
Disclosures:
Investors should carefully consider the investment objectives, risks, charges and expenses of the ETFs identified on this site. This and other important information about the Fund are contained in the prospectus, which can be obtained by visiting tappalphafunds.com or by calling (844) 403-2888. The prospectus should be read carefully before investing.
ETFs are subject to additional risks that do not apply to conventional mutual funds, including the risks that the market price of an ETF’s shares may trade at a premium or discount to its net asset value, an active secondary trading market may not develop or be maintained, or trading may be halted by the exchange in which they trade, which may impact a Fund’s ability to sell its shares. Shares of any ETF are bought and sold at market price (not NAV) and are not individually redeemed from the Fund. Brokerage commissions will reduce returns.
The Fund invests in options contracts that are based on the value of the Index, including SPX and XSP options for TSPY and XND and NQX options for TDAQ. This subjects the Fund to certain of the same risks as if it owned shares of companies that comprised the Index, even though it does not own shares of companies in the Index. The Fund will have exposure to declines in the Index. The Fund is subject to potential losses if the Index loses value, which may not be offset by income received by the Fund. To the extent that the Fund invests in other ETFs or investment companies, the value of an investment in the Fund is based on the performance of the underlying funds in which the Fund invests and the allocation of its assets among those ETFs or investment companies. The Fund may incur high portfolio turnover to manage the Fund’s investment exposure. The Fund is classified as “non-diversified” under the 1940 Act.
As of the date of this prospectus, the Fund has no operating history and currently has fewer assets than larger funds. Like other new funds, large inflows and outflows may impact the Fund’s market exposure for limited periods of time. This impact may be positive or negative, depending on the direction of market movement during the period affected.
Due to the short time until their expiration, 0DTE options are more sensitive to sudden price movements and market volatility than options with more time until expiration. Because of this, the timing of trades utilizing 0DTE options becomes more critical. Even a slight delay in the execution of 0DTE trades can significantly impact the outcome of the trade. 0DTE options may also suffer from low liquidity, making it more difficult for the Fund to enter into its positions each morning at desired prices. The bid-ask spreads on 0DTE options can be wider than with traditional options, increasing the Fund’s transaction costs and negatively affecting its returns. These risks may negatively impact the performance of the fund.
Distributor: Foreside Fund Services, LLC
DISCLAIMER – PLEASE READ: This is sponsored advertising content for which Lead-Lag Publishing, LLC has been paid a fee. The information provided in the link is solely the creation of TappAlpha. Lead-Lag Publishing, LLC does not guarantee the accuracy or completeness of the information provided in the link or make any representation as to its quality. All statements and expressions provided in the link are the sole opinion of TappAlpha, and Lead-Lag Publishing, LLC expressly disclaims any responsibility for action taken in connection with the information provided in the link.
Volatility Cannot Price This Risk
Every gauge a portfolio owns reads calm. The exposure that already did the damage is not one of the things they measure.
MICHAEL A. GAYED, CFA
KEY HIGHLIGHTS
- The VIX ended August at 14.92, the 21st percentile of five years against a 17.87 median, while high yield leads Treasuries by 3.32% and utilities lag the S&P 500 by 14.72% over twelve months.
- Long Treasuries sit 36.71% below their December 3, 2021 peak. No volatility index or credit spread signalled that descent, because none of them measures discount-rate risk.
- The mismatch is horizon. A thirty-day implied volatility reading cannot inform a thirty-year liability, yet the liability is funded on the strength of the shorter number.
- The honest rebuttal: at a 5.249% thirty-year yield, forward expected return on duration is the best in roughly two decades. That fixes the compensation, not the instrumentation.
The VIX closed at 14.92 at the August close. That is the 21st percentile of the last five years, against a five-year median of 17.87. [1] High yield relative to Treasuries is higher by 3.32% over twelve months, which is credit leading, not credit flinching. [2] Utilities relative to the S&P 500 are lower by 14.72% over the same twelve months, which is the defensive complex being abandoned rather than accumulated. [3] The index itself set a record closing high earlier this month. [4] Read those four readings together and there is no argument to make. Risk is priced as absent.
Now the number none of those gauges contain. Long Treasuries, as of the August close, sit 36.71% below the peak they made on December 3, 2021. [5] That is an equity-sized drawdown, in the asset most portfolios hold precisely because it is supposed to appreciate when equities do not. It has already happened. It is nearly five years old. It is still not recovered. And not one volatility index, credit spread or defensive-rotation signal flagged it on the way down, because that is not what any of them measure.
The gauges are not broken. They are answering a different question.
This is the part most people get backwards. The complacency in the risk complex is not irrational and it is not a failure of the models. Every one of these measures is doing exactly the job it was built to do, and doing it accurately. The problem is the question each one was built to answer.
The VIX is thirty-day implied volatility on S&P 500 options. It is a price for near-dated equity uncertainty. When it prints 14.92 it is telling you that options markets do not expect the index to move much over the next month, and on the evidence of the past year they have been right. Credit spreads price default probability. When high yield leads Treasuries by 3.32% over a year, the market is telling you that corporate cash flows are covering corporate coupons. Also, so far, correct. The utilities ratio prices relative preference for cash-flow stability. At minus 14.72% over twelve months it is telling you nobody currently wants to pay for stability, which is a genuine risk-appetite signal.
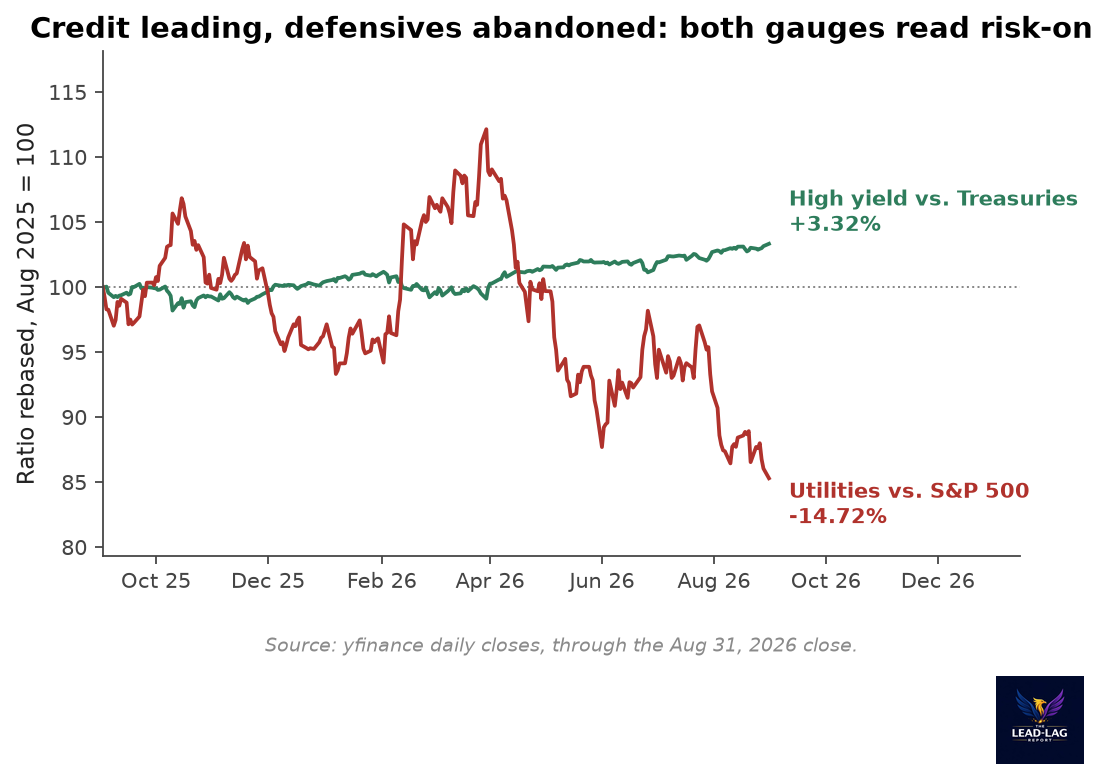
None of the three is a discount-rate instrument. Duration loss is not an equity event, so implied volatility on equity options will not carry it. It is not a default event, so credit spreads will not carry it. A Treasury paying its coupon on schedule while its price falls 36.71% has not defaulted on anything. It has been repriced. Repricing of the long end is a function of the term premium, the inflation path and the policy path, and there is no widely-held gauge in the standard risk dashboard that reads any of those directly. So a portfolio can pass every screen it owns while carrying its largest live exposure entirely unmeasured.
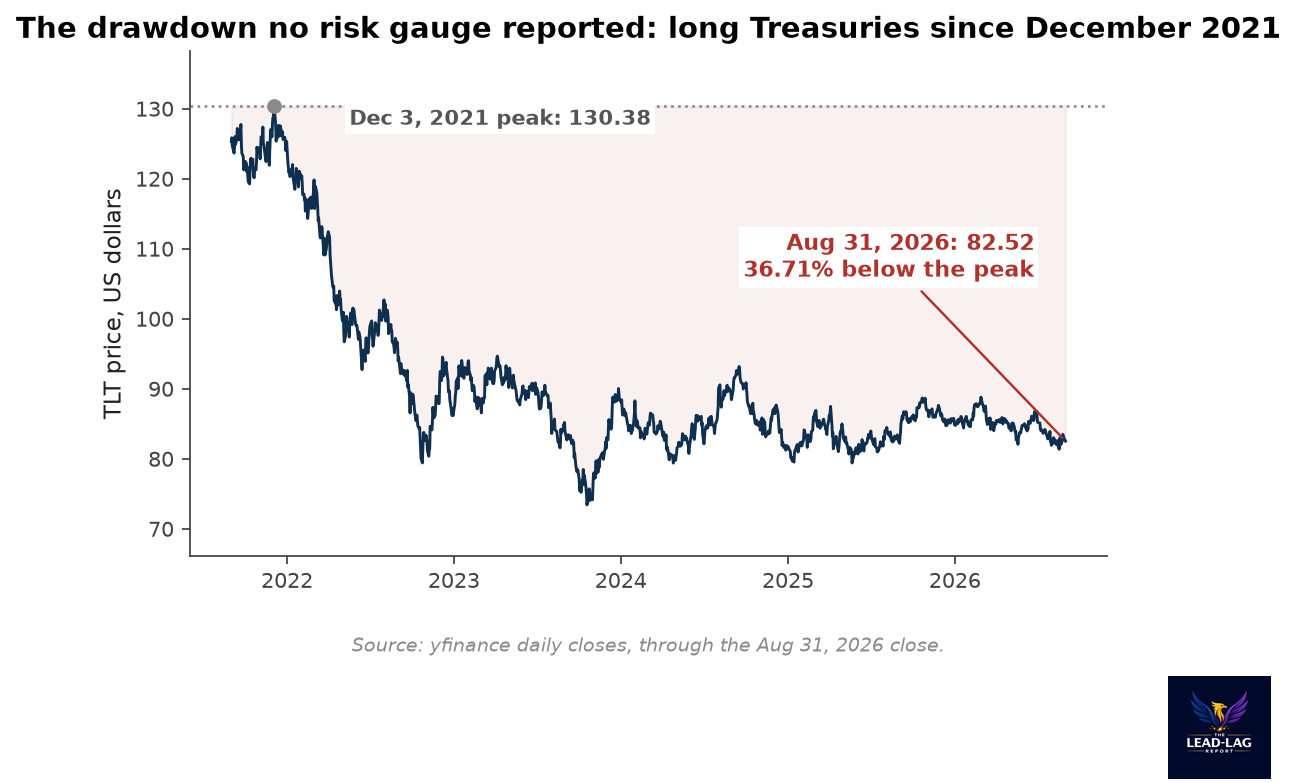
A thirty-day number cannot inform a thirty-year liability
The deeper mismatch is horizon, and it is structural rather than accidental.
Almost every risk number in common use is short-dated by construction. Thirty-day implied volatility. Trailing one-year spread changes. Rolling three-month correlations. Ninety-day drawdown attribution. The dashboard refreshes weekly and its memory is measured in months. Meanwhile the liability the portfolio actually funds is measured in decades. A pension obligation, a retirement date, an endowment spending rule, an insurance book. Those are thirty-year exposures. They are financed with instruments whose price is a discounted stream running out that far, and they are monitored with instruments whose entire field of view is one month.
Nothing in a thirty-day volatility measure is informative about a thirty-year liability. That is not a criticism of the measure. It is a statement about what a measure of that tenor can contain. The two horizons do not overlap, so the shorter one cannot rule anything in or out about the longer one. Yet the allocation decisions that determine long-horizon outcomes are routinely made with the short-horizon instrument, because the short-horizon instrument is the one that updates every day and therefore feels like information.
The policy path makes this concrete right now. Headline CPI ran 3.4% year over year in July, with core at 2.5%, and the monthly headline print turned positive again after a negative prior month. [6] As of the August close, the probability of a hike at the September 16 meeting had moved from roughly 35% to roughly 60% on the strength of official commentary, with the two-year yield at 4.36% after a thirteen basis point move. [7] Those are discount-rate inputs. They are the variables that set the price of the long end. A VIX of 14.92 does not contain them and was never asked to.
The strongest case against this, made honestly
There is a serious rebuttal here, and it is not a technicality. A drawdown is backward-looking. It tells you what an exposure did to whoever held it through the interval. It says almost nothing about what the same exposure does for whoever holds it forward from today, because the entire mechanism that produced the loss also produced the compensation.
The thirty-year Treasury yielded 1.927% at the start of this five-year window. As of the August close, it yields 5.249%. [8] That path is the drawdown. It is also the reason forward expected return on duration is now the best it has been in roughly two decades. July's monthly close of 5.28% was reported as the highest thirty-year yield since 2006. [9] An investor establishing duration exposure at these levels is not the investor who took the 36.71% loss. They are, in a real sense, the beneficiary of it. The coupon is genuine. The starting yield is the single most reliable predictor of long-horizon bond return there is, and it currently favors the asset rather than condemning it. Marking the exposure by its worst historical interval, at the precise moment its forward compensation is at a twenty-year high, is a plausible way to be wrong in both directions at once.
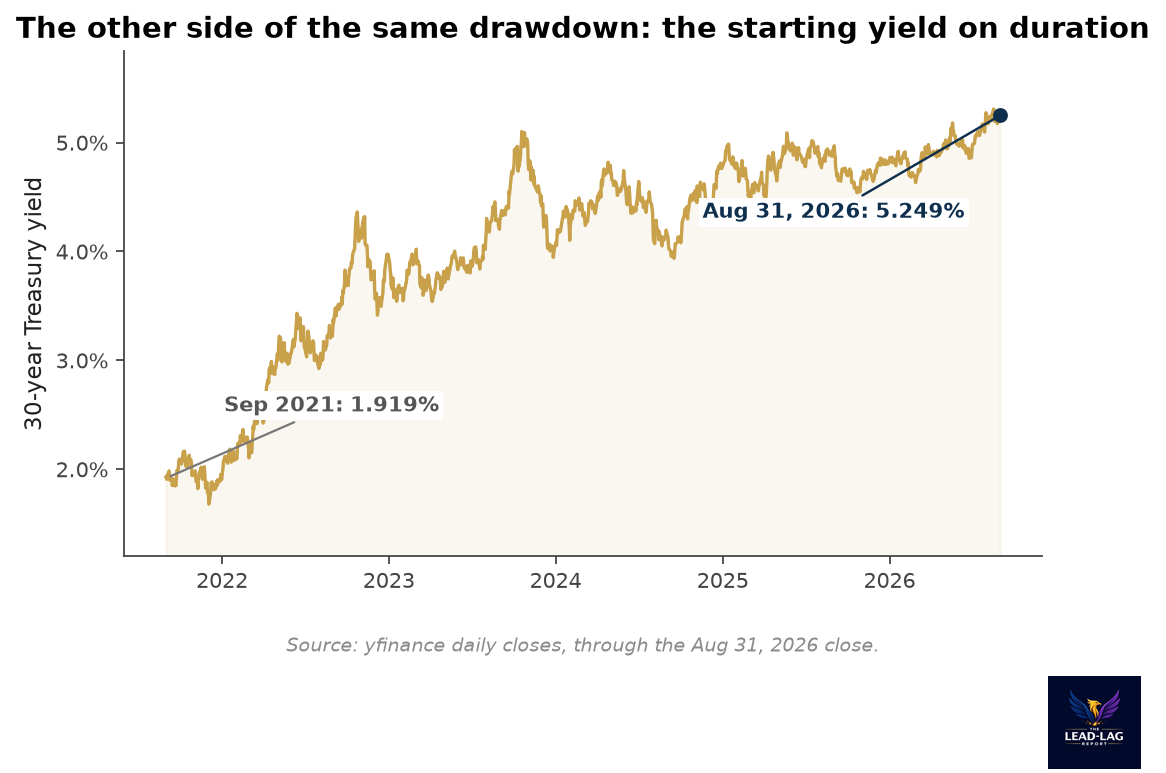
I take that argument seriously. It is probably right about return. What it does not resolve is the point of this piece, which is about measurement rather than direction. Better forward expected return does not make the exposure less volatile in price terms, and it does not put a discount-rate reading on the dashboard. A portfolio holding duration at 5.249% has a much better prospective outcome and exactly the same blind spot. The compensation improved. The instrumentation did not.
What would prove this wrong
A view without a falsifier is not a view, so here is the falsifier.
If the long end mean-reverts from here, if yields fall materially and long Treasuries recover a meaningful share of that 36.71% while equity volatility stays subdued, then the exposure resolved itself without ever needing to be measured, and the calm gauges will have been the better guide all along. That outcome would say the drawdown was a transition to a higher-yield equilibrium and nothing more, and that the risk dashboard's silence was appropriate silence. It is a live possibility. Duration is roughly flat over twelve months, [10] which is what the early part of that path would look like.
The second falsifier is harder on me. If the long end simply stays here, and the drawdown neither deepens nor heals, then nothing resolves and the exposure has been mispriced by neither side. In that world the argument becomes an argument about opportunity cost rather than about risk, and it loses most of its force.
What would confirm the thesis is narrower and specific. It would take a portfolio-level loss that arrives through the discount rate rather than through earnings or defaults, with the VIX still in its low quintile while it happens. That is the signature to watch for. Not a spike in fear, but a repricing that fear never registers.
Where that leaves positioning
The practical implication is not about direction. It is about instrumentation.
If the largest unmeasured exposure in a portfolio is discount-rate sensitivity, then the answer is a gauge that reads it, not a different opinion about the level of yields. The term premium, the shape of the curve, the thirty-year spread over the funding rate. Those are all observable and none of them appear on a standard risk report. The 30-year currently sits about 162 basis points above the fed funds midpoint and the ten-year over three-month curve is positively sloped by 1.03 percentage points. [11] Those readings tell you something the VIX structurally cannot, and they take no more effort to track.
The asymmetry that matters is between what is measured and what is held. A regime in which every gauge reads calm is not the same as a regime with no exposure. It is a regime where the exposure sits in the space the gauges do not cover. Utilities lagging by 14.72% and credit leading by 3.32% are accurate readings of equity risk appetite and corporate solvency. They are silent on the thing that took 36.71% out of the safest asset on the balance sheet, and they were silent for the whole descent.
Calm gauges are not evidence of an absent exposure. They are evidence that the exposure sits outside what the gauges were built to see.
Few understand this.
Notes
[1] VIX closing level, five-year median and percentile standing computed from daily closes for the CBOE Volatility Index (^VIX) over the five years ended August 31, 2026. Data via yfinance: https://finance.yahoo.com/quote/%5EVIX/history
[2] HYG divided by GOVT, twelve-month change in the ratio computed from daily closes through August 31, 2026. Data via yfinance: https://finance.yahoo.com/quote/HYG/history
[3] XLU divided by SPY, twelve-month change in the ratio computed from daily closes through August 31, 2026. Data via yfinance: https://finance.yahoo.com/quote/XLU/history
[4] "S&P 500 notches record high close," Reuters, August 13, 2026: https://www.reuters.com/markets/us/sp-500-notches-record-high-close-2026-08-13/
[5] TLT drawdown from its five-year closing peak of 130.38 on December 3, 2021 to 82.52 on August 31, 2026, computed from daily closes. Data via yfinance: https://finance.yahoo.com/quote/TLT/history
[6] Consumer Price Index Summary, July 2026, U.S. Bureau of Labor Statistics: https://www.bls.gov/news.release/cpi.nr0.htm
[7] Global Macro and Markets Briefing, FXCM, August 31, 2026: https://www.fxcm.com/uk/insights/global-macro-and-markets-briefing-31-august-2026/
[8] 30-year Treasury yield (^TYX), daily closes, September 1, 2021 through August 31, 2026. Data via yfinance: https://finance.yahoo.com/quote/%5ETYX/history
[9] "Six Years into Bond Bear Market, 30-Year Treasury Yield Hits 5.28%," Wolf Street, August 1, 2026: https://wolfstreet.com/2026/08/01/six-years-into-bond-bear-market-30-year-treasury-yield-hits-5-28/
[10] TLT total price change of minus 0.35% over the trailing twelve months through August 31, 2026, computed from daily closes. Data via yfinance: https://finance.yahoo.com/quote/TLT/history
[11] 30-year Treasury yield of 5.249% against a fed funds target midpoint of 3.625%, and the 10-year minus 3-month spread of 1.03 percentage points, as of the August 31, 2026 close. Yields via yfinance (^TYX, ^TNX, ^IRX): https://finance.yahoo.com/quote/%5ETYX/history



