
Lumber Is Dissenting From The Index
The most rate-sensitive corner of the real economy is in a relative bear market while the S&P prints records.

Today’s Lead-Lag Report post is sponsored by TappAlpha

Income while staying fully invested in equities.
TappAlpha S&P 500 Growth & Daily Income ETF (TSPY)
TappAlpha Innovation 100 Growth & Daily Income ETF (TDAQ)
Investors have always had to choose: generate income or stay fully invested. TSPY and TDAQ do both—adding tax-efficient income potential to the S&P 500 and Nasdaq-100.
A tax-efficient alternative to traditional income strategies. Growth + Income — with the TappAlpha Growth & Daily Income ETFs.
Disclosures:
Investors should carefully consider the investment objectives, risks, charges and expenses of the ETFs identified on this site. This and other important information about the Fund are contained in the prospectus, which can be obtained by visiting tappalphafunds.com or by calling (844) 403-2888. The prospectus should be read carefully before investing.
ETFs are subject to additional risks that do not apply to conventional mutual funds, including the risks that the market price of an ETF’s shares may trade at a premium or discount to its net asset value, an active secondary trading market may not develop or be maintained, or trading may be halted by the exchange in which they trade, which may impact a Fund’s ability to sell its shares. Shares of any ETF are bought and sold at market price (not NAV) and are not individually redeemed from the Fund. Brokerage commissions will reduce returns.
The Fund invests in options contracts that are based on the value of the Index, including SPX and XSP options for TSPY and XND and NQX options for TDAQ. This subjects the Fund to certain of the same risks as if it owned shares of companies that comprised the Index, even though it does not own shares of companies in the Index. The Fund will have exposure to declines in the Index. The Fund is subject to potential losses if the Index loses value, which may not be offset by income received by the Fund. To the extent that the Fund invests in other ETFs or investment companies, the value of an investment in the Fund is based on the performance of the underlying funds in which the Fund invests and the allocation of its assets among those ETFs or investment companies. The Fund may incur high portfolio turnover to manage the Fund’s investment exposure. The Fund is classified as “non-diversified” under the 1940 Act.
As of the date of this prospectus, the Fund has no operating history and currently has fewer assets than larger funds. Like other new funds, large inflows and outflows may impact the Fund’s market exposure for limited periods of time. This impact may be positive or negative, depending on the direction of market movement during the period affected.
Due to the short time until their expiration, 0DTE options are more sensitive to sudden price movements and market volatility than options with more time until expiration. Because of this, the timing of trades utilizing 0DTE options becomes more critical. Even a slight delay in the execution of 0DTE trades can significantly impact the outcome of the trade. 0DTE options may also suffer from low liquidity, making it more difficult for the Fund to enter into its positions each morning at desired prices. The bid-ask spreads on 0DTE options can be wider than with traditional options, increasing the Fund’s transaction costs and negatively affecting its returns. These risks may negatively impact the performance of the fund.
Distributor: Foreside Fund Services, LLC
DISCLAIMER – PLEASE READ: This is sponsored advertising content for which Lead-Lag Publishing, LLC has been paid a fee. The information provided in the link is solely the creation of TappAlpha. Lead-Lag Publishing, LLC does not guarantee the accuracy or completeness of the information provided in the link or make any representation as to its quality. All statements and expressions provided in the link are the sole opinion of TappAlpha, and Lead-Lag Publishing, LLC expressly disclaims any responsibility for action taken in connection with the information provided in the link.
Lumber Is Dissenting From The Index
The most rate-sensitive corner of the real economy is in a relative bear market while the S&P prints records.
MICHAEL A. GAYED, CFA
KEY HIGHLIGHTS
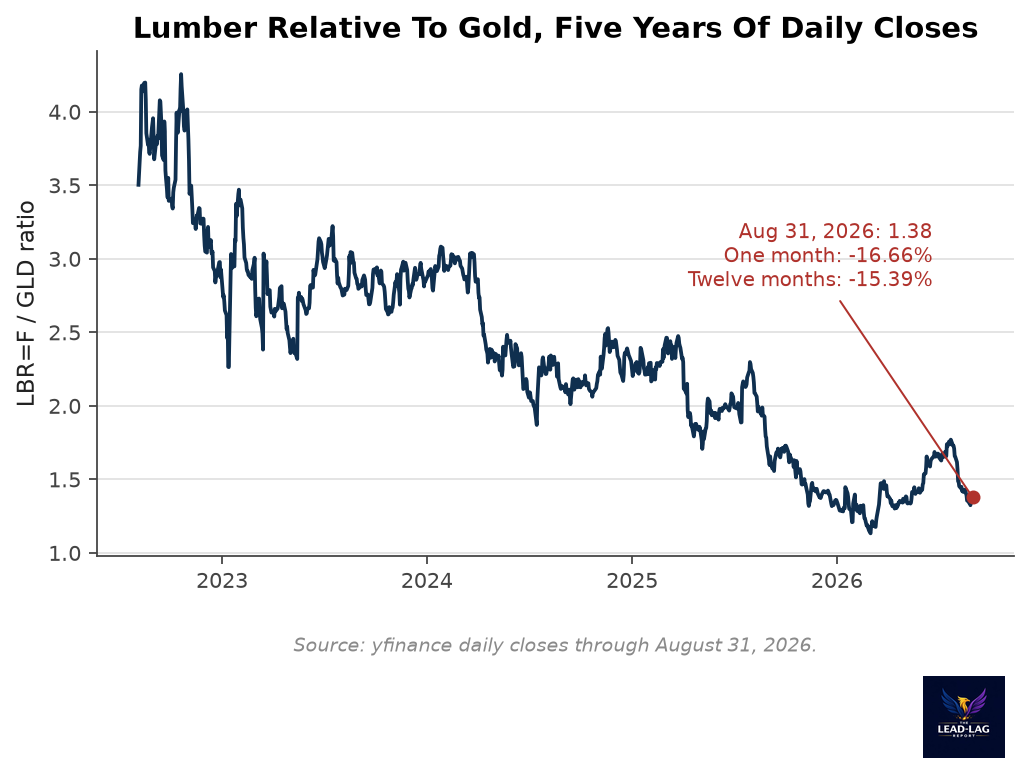
- Lumber measured against gold fell 16.66 percent in August and 15.39 percent over twelve months, leaving the ratio at 1.38 and near the bottom of its five-year range.
- Homebuilders relative to the S&P 500 fell 24.32 percent over twelve months while the index itself gained 20.23 percent and printed a record close on August 13.
- The 30-year Treasury yield ended August at 5.249 percent, 162 basis points above the fed funds midpoint, which keeps the marginal cost of housing credit elevated.
- The counter-case, that index earnings now come from firms with no rate sensitivity in a market where the top ten names are about 40 percent of the weight, is genuine and explains why the divergence can persist.
SPY ended August at 767.05, up 20.23 percent over twelve months, and the August close sits 1.39 percent below the record close it printed on August 13.[1][2] Over that same twelve months, lumber measured against gold fell 15.39 percent, and it fell 16.66 percent in the single month of August.[1] Homebuilders measured against the S&P 500 fell 24.32 percent over twelve months.[1] Those numbers describe one economy at one moment. Only one of them is being treated as the truth.
The reflex reading of lumber is running backwards right now. A generation of intermarket work taught people that firm lumber means risk appetite and soft lumber means a growth scare, and then most of them stopped checking which one the tape was actually showing. As of the August close, the lumber-to-gold ratio sits at 1.38, roughly eight percent of the way up its five-year range.[1] The signal is not flashing risk appetite. It is flashing the opposite, and it has been doing so for a year.
Lumber is a duration story in a commodity costume
Nobody frames a housing start around the price of a board in isolation. The order gets placed when a builder can finance the lot, the labor, the permits and the carry, and that calculation runs through the mortgage rate, which runs through the long end of the Treasury curve. Lumber demand is therefore the cleanest high-frequency read available on the marginal cost of housing credit. It is physical, it is local, and it cannot be smoothed by a share repurchase or an accounting policy.
Gold is the mirror image of that trade. Gold is what capital does when it wants no cash flow, no counterparty and no exposure to whether the real economy can service its debt. Divide one by the other and you get a single line that asks a single question. Can the physical economy carry the current cost of money.
The line answers no. What makes the answer credible is the composition of the move rather than its size. Lumber futures themselves are up 2.55 percent over twelve months. Gold is up 28.41 percent.[1] The ratio did not collapse because lumber cracked. It collapsed because capital paid an enormous premium for the asset with no cash flow and no rate sensitivity, while paying essentially nothing for the asset that only works when credit is cheap. A straight decline in lumber would have been easier to dismiss as a supply accident. A relative rout driven by a scramble into gold is a statement about the cost of money.
Consider what has to be true for gold to gain 28.41 percent in twelve months while the index gains 20.23 percent.[1] Metal with no earnings kept pace with an equity market in a documented bull run. That is not an inflation hedge doing its normal job at the margin. That is capital paying up for the one asset that has no exposure to the terms on which the rest of the economy borrows. The lumber side of the ratio is the control variable. The gold side is the confession.
The homebuilders sign the same statement
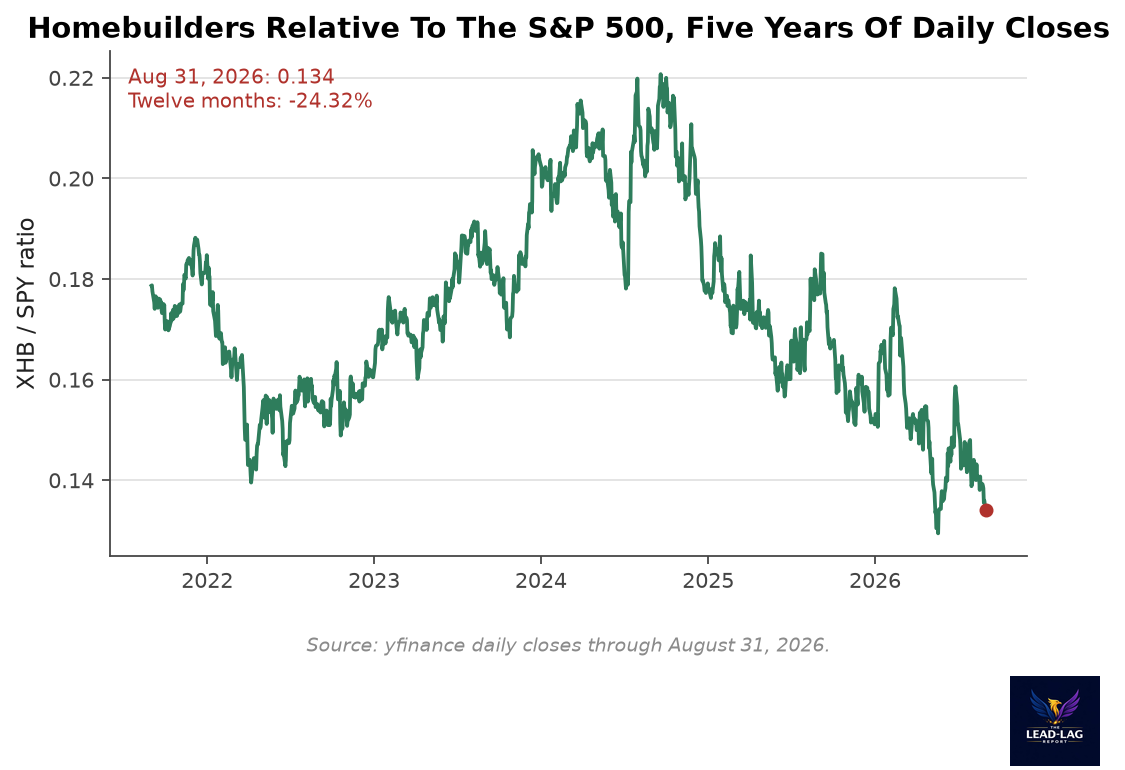
XHB against SPY ended August at 0.134, down 3.44 percent on the month and 24.32 percent over twelve months.[1] In absolute terms homebuilders lost 9.13 percent over twelve months while the index gained 20.23 percent.[1] That is a 29-point spread inside a single equity market, and it comes from an entirely different instrument than the lumber trade. One is a thin physical futures contract. The other is a liquid equity basket with earnings, guidance and analyst coverage. Two unrelated pricing mechanisms reached the same conclusion about housing credit within the same twelve months.
Cross-asset agreement is the whole test. A single ratio can be noise. Two ratios drawn from different markets, moving the same direction over the same window, are usually describing a constraint rather than a quirk. Utilities relative to the S&P are down 14.72 percent over the same twelve months, which is the sound of the same rate regime hitting the other classically rate-sensitive part of the index.[1] Nothing here is a mystery once the long end is in the frame.
Follow the long end, because it is not waiting
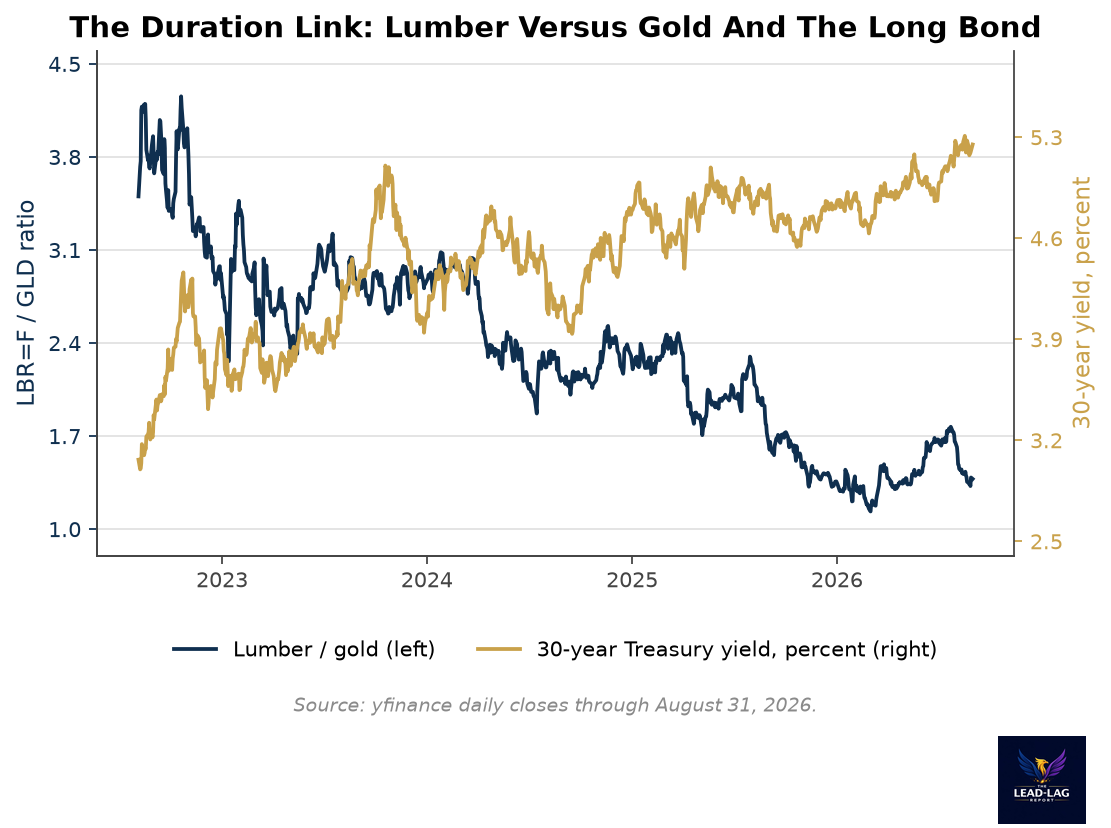
The 30-year Treasury yield ended August at 5.249 percent, which is 162 basis points above the 3.625 percent midpoint of the fed funds target, with the 30-year minus 3-month curve at 1.52 percentage points.[1][3] It is not a multi-decade high. It is below the July 2026 monthly close of 5.28 percent, which Wolf Street reported as the highest since 2006.[4] The distinction matters for accuracy and not much else. Housing does not care whether the print is a record. Housing cares that the long end has held above five percent while the policy rate sits more than a point and a half below it.
The front end offers no relief either. Odds of a hike at the September 16 meeting moved from 35 percent to 60 percent after the most recent Fed communication, with the two-year yield at 4.36 percent after a 13 basis point move.[5] July CPI ran 3.4 percent on the headline and 2.5 percent on core.[6] There is no version of that combination in which the marginal cost of housing credit falls in the next two quarters. The lumber-to-gold line is not forecasting a recession. It is reporting a price. The price of building something with borrowed money went up and stayed up.
The rebuttal is real and deserves a straight hearing
The strongest argument against this piece is that housing weakness is a supply and affordability problem with limited read-through to broad equities. Existing owners are locked into pre-2022 mortgages and will not move. Land, labor and permits are scarce in the places people want to live. That is a structural drag on volumes that has very little to do with the earnings power of the companies that dominate the index. On that view lumber is measuring a housing market with its own idiosyncratic plumbing, not the credit cycle.
The second half of that argument is stronger still. The index's earnings are increasingly generated by firms with almost no rate sensitivity in their operating model. Technology relative to the S&P is up 19.15 percent over twelve months, and technology itself returned 42.87 percent.[1] The top ten names now account for roughly 40 percent of the index, the most concentrated it has been since 1965 according to S&P Global data.[7] A ratio built on two-by-fours has a genuinely weaker claim on that index than it had in 2006.
Both points are fair. Neither is comforting. Concentration is the mechanism by which the index can ignore lumber for a long time, and it is also the mechanism by which the index becomes a narrow instrument that reflects ten balance sheets rather than an economy. Being able to explain why the divergence persists is not the same as showing that it is harmless. The 2006 to 2007 sequence had an equally coherent explanation for why housing was contained. The explanation held right up until it did not.
What would prove this wrong
State the falsifier plainly. If lumber against gold and homebuilders against the index both turn up while the 30-year holds above five percent, the thesis is dead. That combination would show housing absorbing the rate regime rather than buckling under it, and it would mean these ratios have lost their edge as a read on credit conditions. A twelve-month lumber-to-gold reading crossing back above zero with the long end unchanged is the specific number to watch.
The other honest caveat is mechanical. Lumber futures are thin. Open interest is small relative to the equity and rates markets discussed here, and the contract is prone to idiosyncratic supply noise from mill outages, trade policy and freight. A minus 16.66 percent month in that contract proves nothing on its own, and anyone who builds a macro view on one month of a thin futures market deserves the outcome. What upgrades this from noise to signal is the twelve-month confirmation at minus 15.39 percent and the independent agreement from a liquid equity basket at minus 24.32 percent.[1] Strip either of those away and there is no article here.
Timing is the last caveat and the least satisfying one. Nothing in these ratios says when. A relative bear market in housing can run for years without the index acknowledging it, and the three-month numbers make that point on their own. Lumber against gold is down only 3.59 percent over three months and homebuilders against the index only 1.62 percent, so the pressure is not accelerating right now.[1] A signal about regime is not a signal about next week, and treating it as one is how good analysis turns into bad positioning.
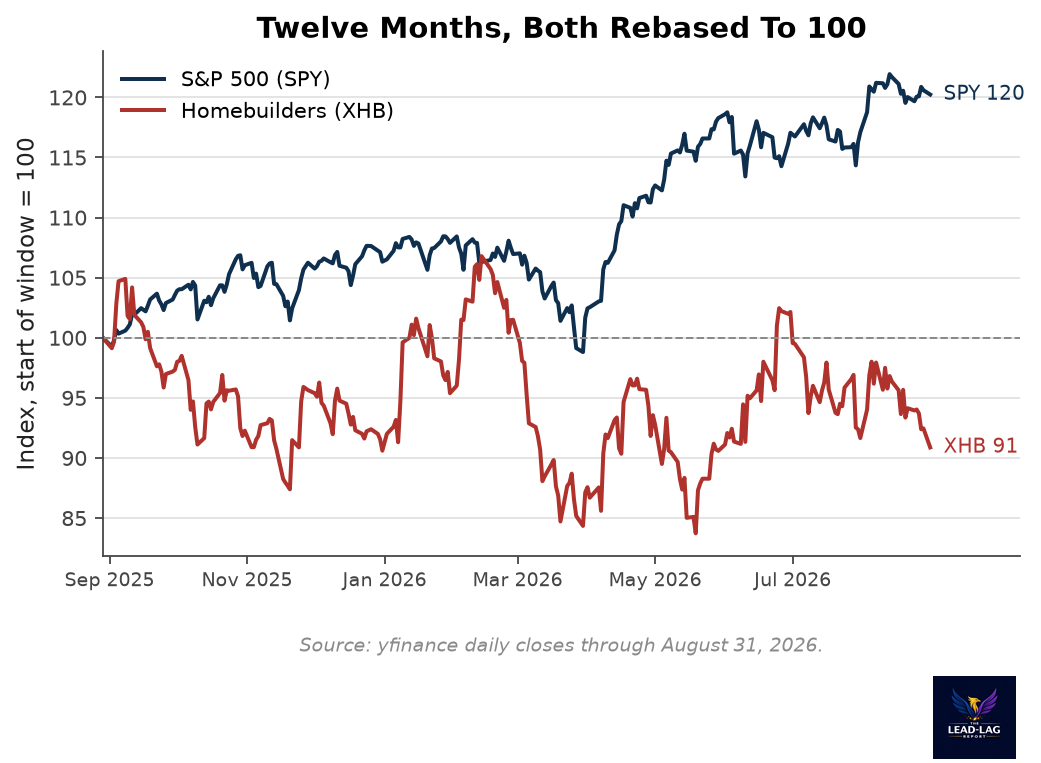
Rebase both to 100 twelve months ago and the shape of the disagreement is unmistakable. The index finishes the window at 120. Homebuilders finish at 91.[1] The gap did not open in a panic. It opened steadily, through a period in which the index made a record close, which is precisely the pattern that makes it easy to ignore.
The positioning implication is about asymmetry, not about a call on the index. Exposure concentrated in the part of the market with no rate sensitivity has been the winning stance and is now also the crowded one. The parts of the market pricing the actual cost of money are already trading as though the regime is binding. If the long end matters, one of those two groups is mispriced, and the one that has been right about credit for twelve straight months is not the one that has been ignoring it.
The index is under no obligation to agree with lumber, and it can stay in disagreement for longer than most positioning can tolerate, but the burden of proof sits with the side that has spent twelve months ignoring the cost of money.
Few understand this.
Notes
[1] Ratio and return figures computed from daily closes as of the August 31, 2026 close (lumber futures, GLD, SPY, XHB, XLU, XLK, ^TYX), Lead-Lag Report calculations. Underlying quotes: https://finance.yahoo.com/quote/LBR%3DF/ and https://finance.yahoo.com/quote/XHB/
[2] S&P 500 record-high close context: Reuters, 13 August 2026. https://www.reuters.com/markets/us/sp-500-notches-record-high-close-2026-08-13/
[3] 30-year Treasury yield and curve levels as of the August 31, 2026 close. https://finance.yahoo.com/quote/%5ETYX/
[4] 30-year Treasury yield at 5.28 percent on 31 July 2026, 165 basis points over the effective fed funds rate, described as the highest since 2006: Wolf Street, 1 August 2026. https://wolfstreet.com/2026/08/01/six-years-into-bond-bear-market-30-year-treasury-yield-hits-5-28/
[5] September 2026 rate-hike odds moving from 35 percent to 60 percent and the two-year yield at 4.36 percent: FXCM Global Macro and Markets Briefing, 31 August 2026. https://www.fxcm.com/uk/insights/global-macro-and-markets-briefing-31-august-2026/
[6] July 2026 CPI, headline 3.4 percent year over year and core 2.5 percent: Bureau of Labor Statistics Consumer Price Index Summary. https://www.bls.gov/news.release/cpi.nr0.htm
[7] Top ten weight near 40 percent of the index, the most concentrated since 1965, per S&P Global data cited by The Motley Fool, 26 August 2026. https://www.fool.com/investing/2026/08/26/the-stock-market-is-repeating-a-dangerous-pattern/



