The Passive Trap: Why Index Concentration Is a Liquidity Time Bomb
Mechanical inflows made the largest weights the market. The same mechanics run in reverse, and no one is standing on the other side.

Today’s Lead-Lag Report post is sponsored by Evoke

The future is highly uncertain, with potential challenges in growth, inflation, and geopolitics, making diversification crucial.
Most investors are unknowingly underdiversified. A traditional 60/40 portfolio is 98% correlated to the stock market, potentially exposing investors to more risk than they realize. The S&P 500 historically experienced extended periods of underperformance, including:
1. Underperforming cash from 1966 to 1982 during inflationary times
2. A 0% average return from 1929 to 1949
3. A lost decade prior to the recent 15-year bull market
Historical bear markets often started with high valuations. Given current high valuations, we may be on the verge of another challenging period for U.S. equities.
Risk parity seeks to offer a more diversified allocation than conventional mixes. By spreading risk across global equities, Treasuries, TIPS, and commodity producers and gold, investors can maintain a low-cost, tax-efficient passive mix seeking:
1. Equity-like long-term expected returns
2. Lower risk than stocks
3. Reduced risk of a lost decade
To learn more about the RPAR Risk Parity ETF, visit rparetf.com.
Before investing you should carefully consider the Fund’s investment objectives, risks, charges, and expenses. This and other information is in the prospectus. A prospectus may be obtained by clicking here. Please read the prospectus carefully before you invest.
Investing involves risk. Principal loss is possible.
Distributed by Foreside Fund Services, LLC.
Data source: Bloomberg.
DISCLAIMER – PLEASE READ: This is sponsored advertising content for which Lead-Lag Publishing, LLC has been paid a fee. The information provided in the link is solely the creation of Evoke Advisors. Lead-Lag Publishing, LLC does not guarantee the accuracy or completeness of the information provided in the link or make any representation as to its quality. All statements and expressions provided in the link are the sole opinion of Evoke Advisors and Lead-Lag Publishing, LLC expressly disclaims any responsibility for action taken in connection with the information provided in the link.
The Passive Trap: Why Index Concentration Is a Liquidity Time Bomb
Mechanical inflows made the largest weights the market. The same mechanics run in reverse, and no one is standing on the other side.
MICHAEL A. GAYED, CFA
AUG 27, 2026
KEY HIGHLIGHTS
- The ten largest S&P 500 companies still carry roughly 37 to 40 percent of index weight depending on methodology, down modestly from the 40.7 percent year-end peak but still historically extreme.
- Vanguard's VOO has taken in roughly 70 to 80 billion dollars so far in 2026, about half its record 2025 pace, even as US-listed ETFs overall crossed 1 trillion dollars in first-half inflows for the first time.
- Active large-cap managers remain 723 basis points underweight the Magnificent Seven as of the first quarter of 2026, a gap that has widened rather than closed since late 2025.
- This is not a valuation call. It is a market-structure observation about who sets the price and who is left when flows reverse.
August 27, 2026 Update
The concentration held. The composition rotated. The mechanics did not change.
the concentration story has evolved along the lines the piece described. VOO crossed $1 trillion in assets under management earlier in July and has now attracted roughly $69 billion of net inflows year to date through late August — well behind its record 2025 pace but still leading every other product on the tape.[19] No competing fund is close. The single-product dominance the piece flagged has, if anything, tightened.
Composition of the top ten has continued to shift within the mega-cap cohort. As of end-July, VOO's top-ten weights read: Nvidia 7.55 percent, Apple 7.04 percent, Microsoft 5.36 percent, Amazon 4.13 percent, Alphabet Class A 3.24 percent, Broadcom 2.86 percent, Alphabet Class C 2.62 percent, Meta 1.90 percent, JPMorgan 1.46 percent, Berkshire Hathaway Class B 1.46 percent.[20] Nvidia and Apple have both crossed 7 percent individually. Broadcom has moved into the top ten. That is exactly the rotation-within-crowding pattern the piece described.
The BofA August fund manager survey confirmed the same. Long semiconductors remained the most crowded trade at 53 percent, down from a record 82 percent in July but still comfortably ahead of long Magnificent Seven at 11 percent and short Japanese yen at 12 percent.[21] An AI bubble remained the top-cited tail risk. Disorderly bond yields entered as a new tail risk at 27 percent — the exact linkage between concentration and financing conditions this piece was structured around.[21]
The three falsification conditions this piece stated remain untriggered. Active large-blend equity funds have not put four consecutive quarters of net inflows into the mega-cap top ten. The active-manager Magnificent Seven underweight has not closed to within 100 basis points for four consecutive quarters. And passive equity flows have not turned net negative for two consecutive quarters without a corresponding concentration decline. None of the three has moved in the direction that would invalidate the thesis. The mechanics of the mirror remain intact.
There is a comfortable story that investors tell themselves about index funds. The story says that buying the whole market is humble, diversified, and efficient. You are not betting on any single company. You are simply renting the wisdom of the crowd at the lowest possible cost. For most of the history of indexing that story was close enough to true. It is no longer.
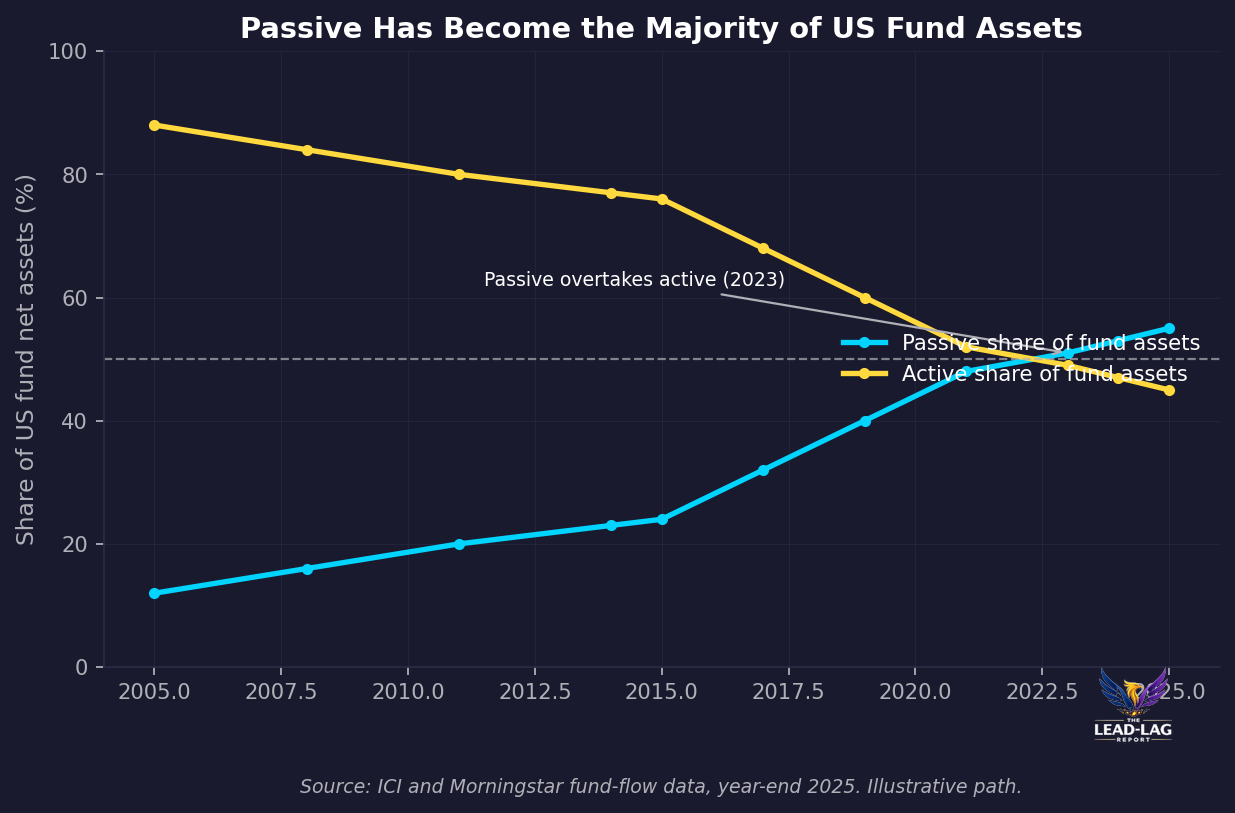
What has changed is not the philosophy but the plumbing. Passively managed funds now make up over fifty-five percent of US fund net assets, having crossed active in total assets back in 2023 and continued to pull away since. [1]
When a majority of the marginal dollar is mechanical, price-insensitive, and rules-bound, the character of the market itself changes. The index stops being a passive mirror of the economy and starts being an active force that moves the very prices it claims only to observe. That is the observation this piece is about, and it is a market-structure observation, not a valuation forecast.
The concentration is not an accident. It is the design working as intended.
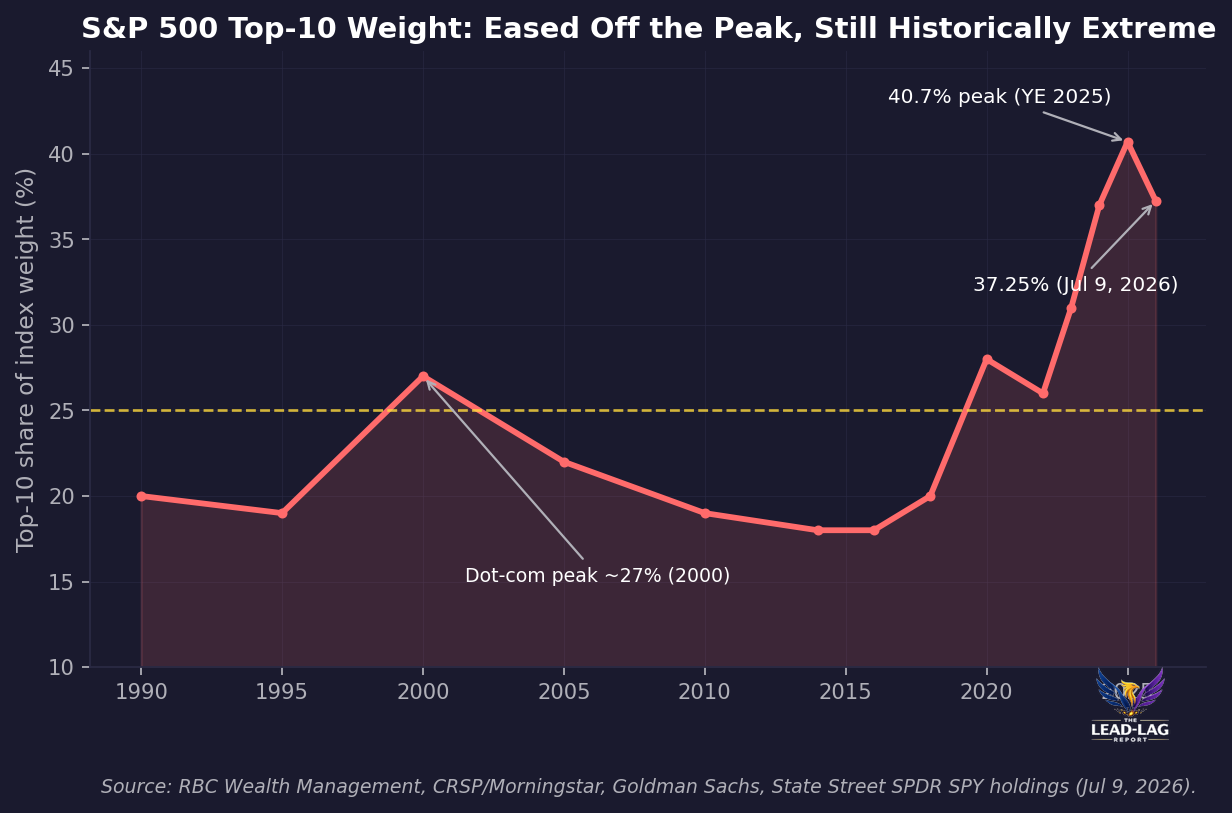
Start with the fact that everyone now cites and few people sit with. By the end of 2025 the ten largest companies in the S&P 500 accounted for nearly forty-one percent of the index by weight, more than doubling in a single decade. That figure has since cooled, but only modestly. State Street's own SPY holdings, the cleanest real-time read on the actual index, put the top ten at 37.25 percent of weight as of July 9, 2026, with the full Magnificent Seven, including both Alphabet share classes, at 32.6 percent. A separate State Street snapshot one week earlier showed the top ten at 36.4 percent and the top twenty-five at just over half the index, a level strategists have not seen in roughly two decades. [2]
Not every source agrees on the exact number, and that disagreement is itself informative. S&P Dow Jones Indices data cited in mid-July put the top ten closer to forty percent of total index value, the most concentrated reading since the mid-1960s, with Nvidia, Apple, and Alphabet each now carrying market capitalizations above four trillion dollars. The gap between the thirty-seven and forty percent readings comes down to methodology, index weight versus raw market value, but the conclusion is identical either way: concentration eased slightly off its year-end peak without coming close to normalizing. [3]
Goldman Sachs frames it against a longer arc: the top ten are running around thirty-six to thirty-seven percent of market cap against a long-run average near twenty percent, and the dot-com peak in 2000 reached only about twenty-five. On one of their metrics, concentration is the highest since 1932. [4] [5]
The point is not that concentration is high. Everyone knows it is high. The point is why it is high, and the mechanical answer is uncomfortable. A cap-weighted index buys stocks in proportion to their size. When a dollar enters an S&P 500 fund, roughly thirty-seven cents of it is deployed into the ten largest names regardless of their valuation, their earnings quality, or their forward prospects. The buying is not a judgment. It is an arithmetic identity. Larger weights attract more of each incoming dollar, which lifts those weights further, which pulls in the next dollar on the same terms. The concentration eased a few points this year not because the mechanism broke, but because a handful of the largest names, Microsoft chief among them, actually underperformed even as the passive bid kept arriving. The design is still compounding. It is just compounding on a slightly reshuffled set of winners.