
The Divergence Broke: Gold Gave It All Back and Copper Held
Two of the Aug 26 thesis's three legs broke and one held. Gold gave it all back, WTI ripped, and copper stayed flat — the arbiter I flagged last week is the one that mattered.

The Divergence Broke: Gold Gave It All Back and Copper Held
Gold's recovery evaporated, crude's collapse fully reversed, and copper stayed flat — the arbiter I flagged last week held.
By Michael A. Gayed, CFA · September 2, 2026
Key Highlights
- Gold slid from $4,716.80 on August 25 to $4,348.00 on September 1, giving back essentially the entire recovery last week's letter called macro-durable.
- WTI settled at $90.22 on September 1, up 11.2% from August 25's $81.10, validating the thesis that crude's collapse was geopolitical and reversible.
- Copper closed at $6.51, down roughly 3% and essentially flat beside gold and crude — the arbiter held, and it reads inflation, not growth.
Let me lead with the contradiction that defines this week. Six sessions ago this letter made three claims: that gold's 6.98% recovery was macro-durable, that Brent's collapse was a reversible geopolitical unwind, and that copper was the arbiter — and that copper said the growth scare was fake. Two of those three legs broke. Gold's front-month COMEX contract, which settled at $4,716.80 on Tuesday, August 25, closed at $4,348.00 on Tuesday, September 1 — a 7.8% give-back that erased essentially the entire recovery I called durable, leaving bullion up just 1.2% year-to-date. That call was wrong on the timeframe that mattered. The oil leg was right: WTI settled at $90.22 on September 1, up 11.2% from the $81.10 August 25 settle, while Brent settled at $94.65 — both moves attributed by Reuters to renewed U.S.-Iran fighting and tankers struck leaving the Strait of Hormuz, now in its 186th day of closure. And the third leg, the arbiter, held. High-grade copper closed September 1 at $6.51 a pound against $6.71 on August 25, still up 17.6% year-to-date. Gold broke. Crude confirmed. Copper did not move. In my view that is not ambiguous: it is an inflation shock, not a growth scare — which is why the Fed is now priced to hike.
The Treasury curve did the actual repricing, and it moved before Kevin Warsh finished speaking. Fed H.15 data show the 2-year at 4.17% on August 25 and 4.34% on August 31, a 17-basis-point rise, with the 5-year up 14 to 4.49%, the 10-year up 11 to 4.75% and the 30-year up 8 to 5.25%. That is a bear flattener: 2s10s computed off those constant maturities compressed from roughly 47 to about 41 basis points, consistent with Morgan Stanley's desk describing bear flattening after Jackson Hole. The cause was not subtle. Warsh's August 28 keynote, "In Our Time," warned that summer inflation prints "do not tell me that underlying trends have meaningfully improved" and that the Fed "has work to do" if price pressures persist. CME FedWatch's September hike probability jumped roughly 20 points on the day, to 55.7% by Friday per CNBC and 66.4% by September 1 per Investing.com's Fed Rate Monitor — call it a 66% area probability, for a meeting the Fed's own calendar puts on September 15-16. Governor Michael Barr added on September 1 that "if inflation appears not to be moderating sufficiently, then I think we should act decisively to raise rates."
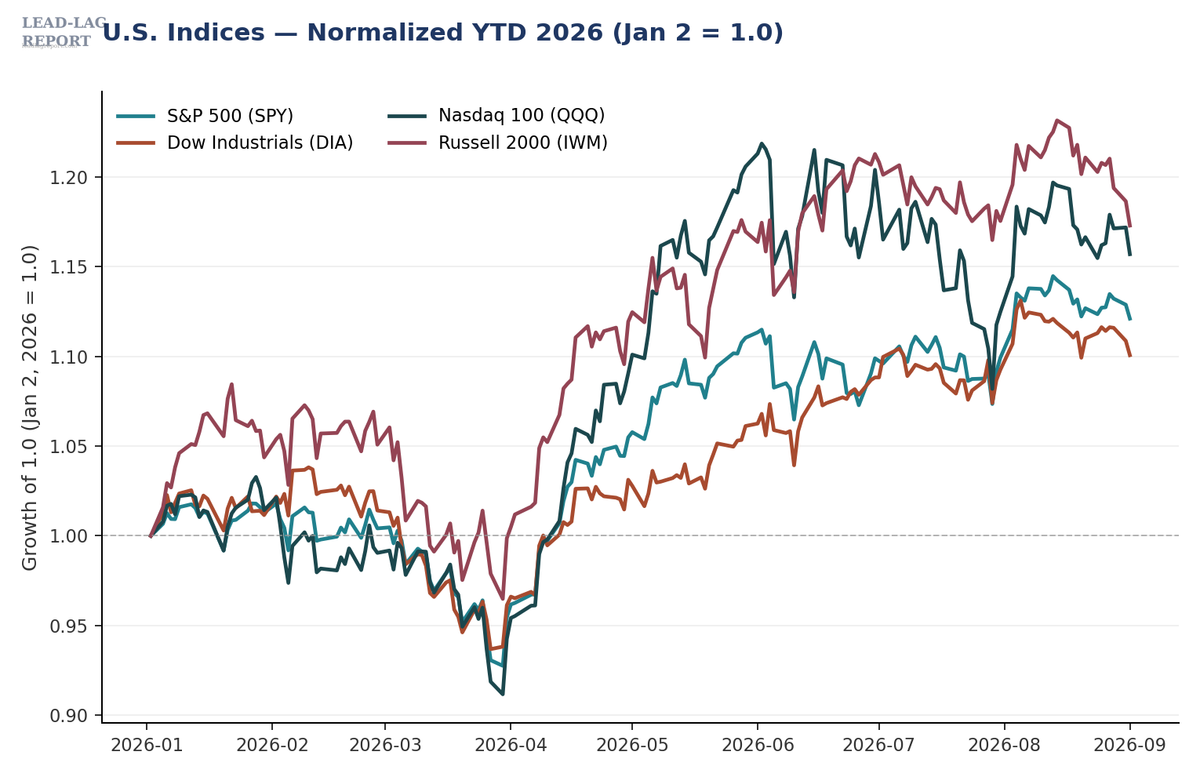
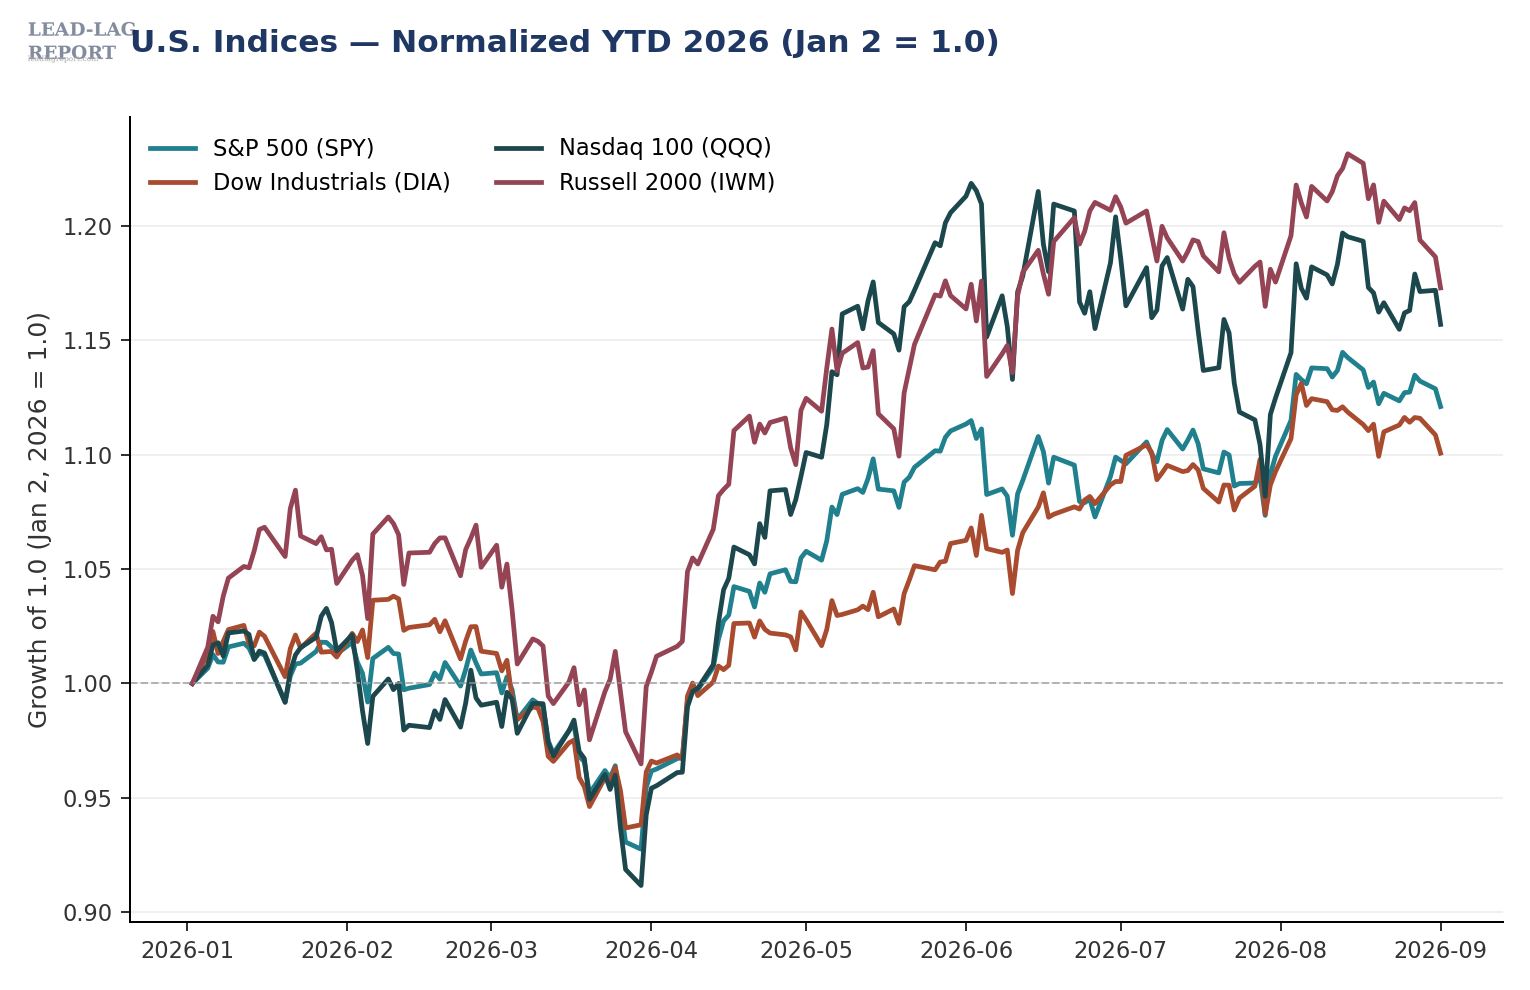
Equities absorbed the repricing unevenly, and the internals were rotation, not broad risk-off. The S&P 500 closed September 1 at 7,631.47, down 0.58% on the week but up 11.5% year-to-date; the Nasdaq Composite at 26,099.77, down 0.12%; the Dow at 52,766.88, down 1.30%; the Russell 2000 at 2,920.13, down 2.85% on the week and 1.23% on the session — small caps taking the duration hit hardest while still leading the year at up 17.7%. VIX at 16.34 rose 12.6% and is still not priced for anything. Nvidia's fiscal Q2 print after the August 26 bell was the loudest datapoint: revenue of $96.2 billion, up 106% year-over-year against roughly $92.2 billion consensus, and a third-quarter guide near $108 billion. The stock closed up 8.7% on Thursday, August 27, adding roughly $440 billion in market value per CNBC. It did not hold. VanEck's SMH fell 3.47% on August 28 to $553.11 as the 10-year broke past 4.75%, then slid to $545.22 by September 1 — a beat that bought one session. Sector leadership agrees: energy led all sectors at up 6.88% over one month per Investing.com, and utilities was the only sector negative. The prints gave Warsh room — July PCE held at 3.7% headline and 3.3% core, both a tenth above consensus. Duration is being re-rated, not recession priced.
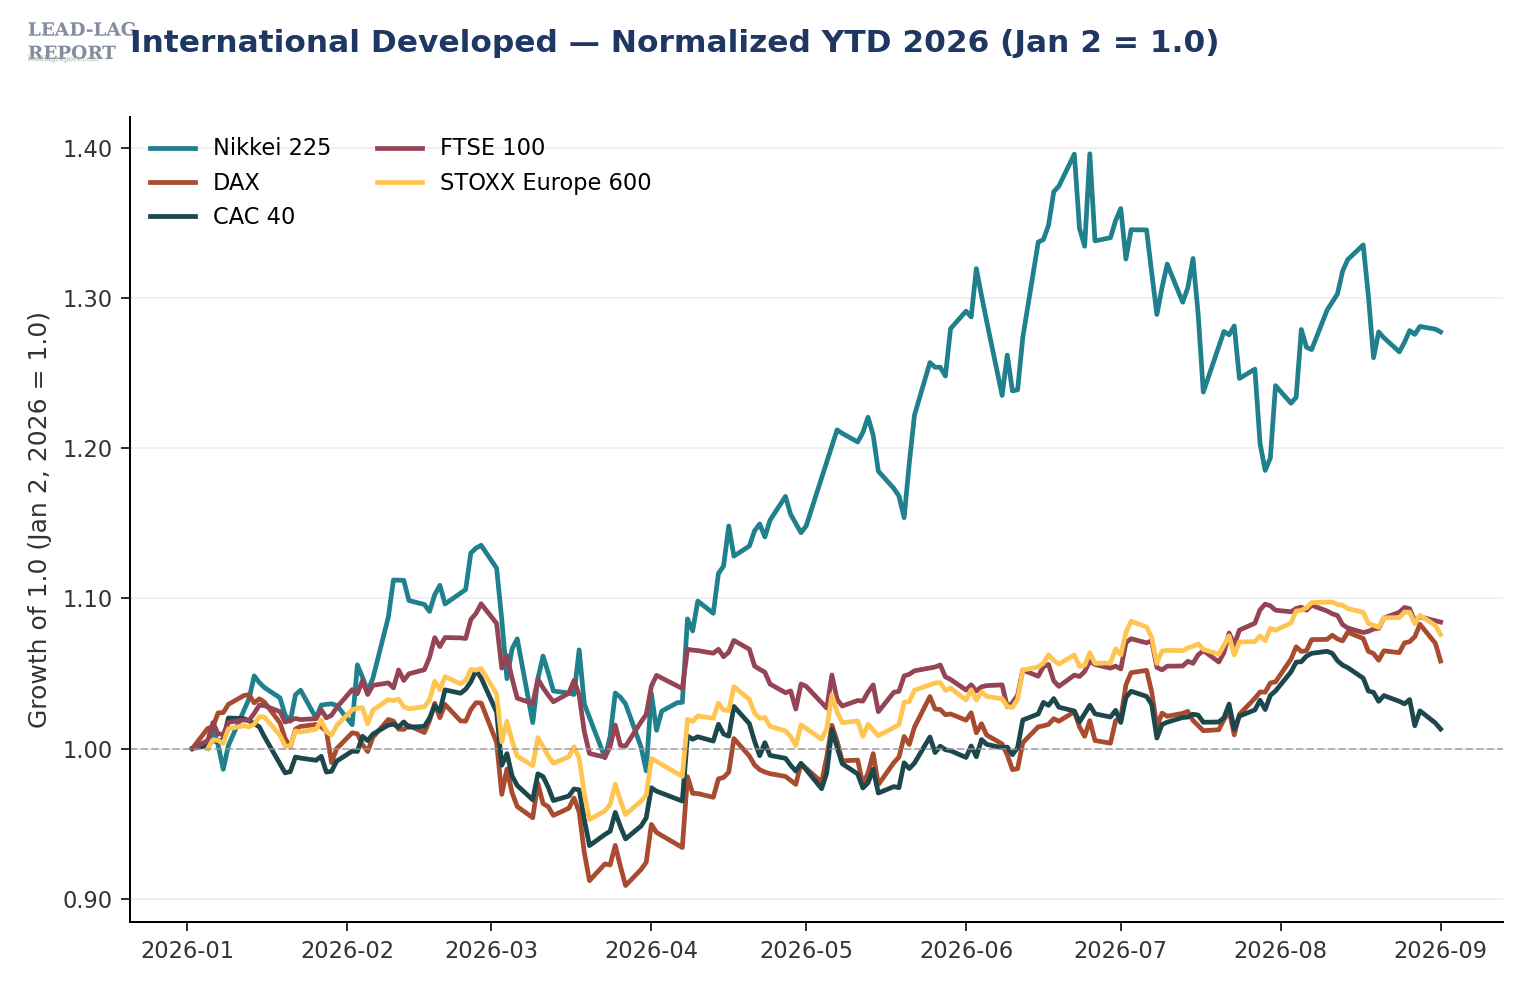
Developed markets outside the U.S. made the mechanism visible, because the shock hit sovereign curves and energy equities at once. European energy majors rebounded between the August 27 and September 1 closes — Repsol up 6.1%, TotalEnergies up 4.6%, BP up 4.5% — the mirror image of last week's Brent-driven selloff in the same names. Japan's 10-year JGB reached 3.00% on September 1, a level Reuters reports had not been seen in three decades. Germany's 10-year Bund pushed to 3.36% and the UK 10-year gilt to 5.26% as Euronews described European yields surging to 15-year highs. Equities gave ground: the Nikkei 225 closed September 1 at 66,215.34 before dropping 2.85% Wednesday to 64,325.64, the DAX slid to 25,829.06, the CAC 40 to 8,279.31 and the FTSE 100 to 10,750.91. Week-over-week that is the Nikkei down 2.73%, the DAX down 2.04%, the FTSE down 1.17% and the CAC down 0.49%.
The policy commentary is what makes those yields dangerous rather than merely high. BOJ Deputy Governor Ryozo Himino called on August 27 for "timely" rate hikes to avoid falling behind the curve on inflation, which leaves a September move live. ECB speakers Dimitar Radev and Olaf Sleijpen emphasized the possibility of a September hike, and the Bank of England faces an August 20 CPI print that held at 2.9% year-over-year. The growth data are not cooperating with the dovish case either: August flash composite PMIs came in at 53.4 for Japan, 52.1 for the euro area and 52.5 for the UK, all expansionary per S&P Global. Here is what the market is missing. A crude spike into economies with expansionary PMIs and sticky services inflation is not a stagflation shock — it is a plain inflation shock, and every developed-market central bank that spent the summer arguing about timing just had its hand forced in the same direction at once. That is why the long end sold off globally across the same two sessions rather than country by country. Last week cheap energy bought the hawks time. This week it stopped.
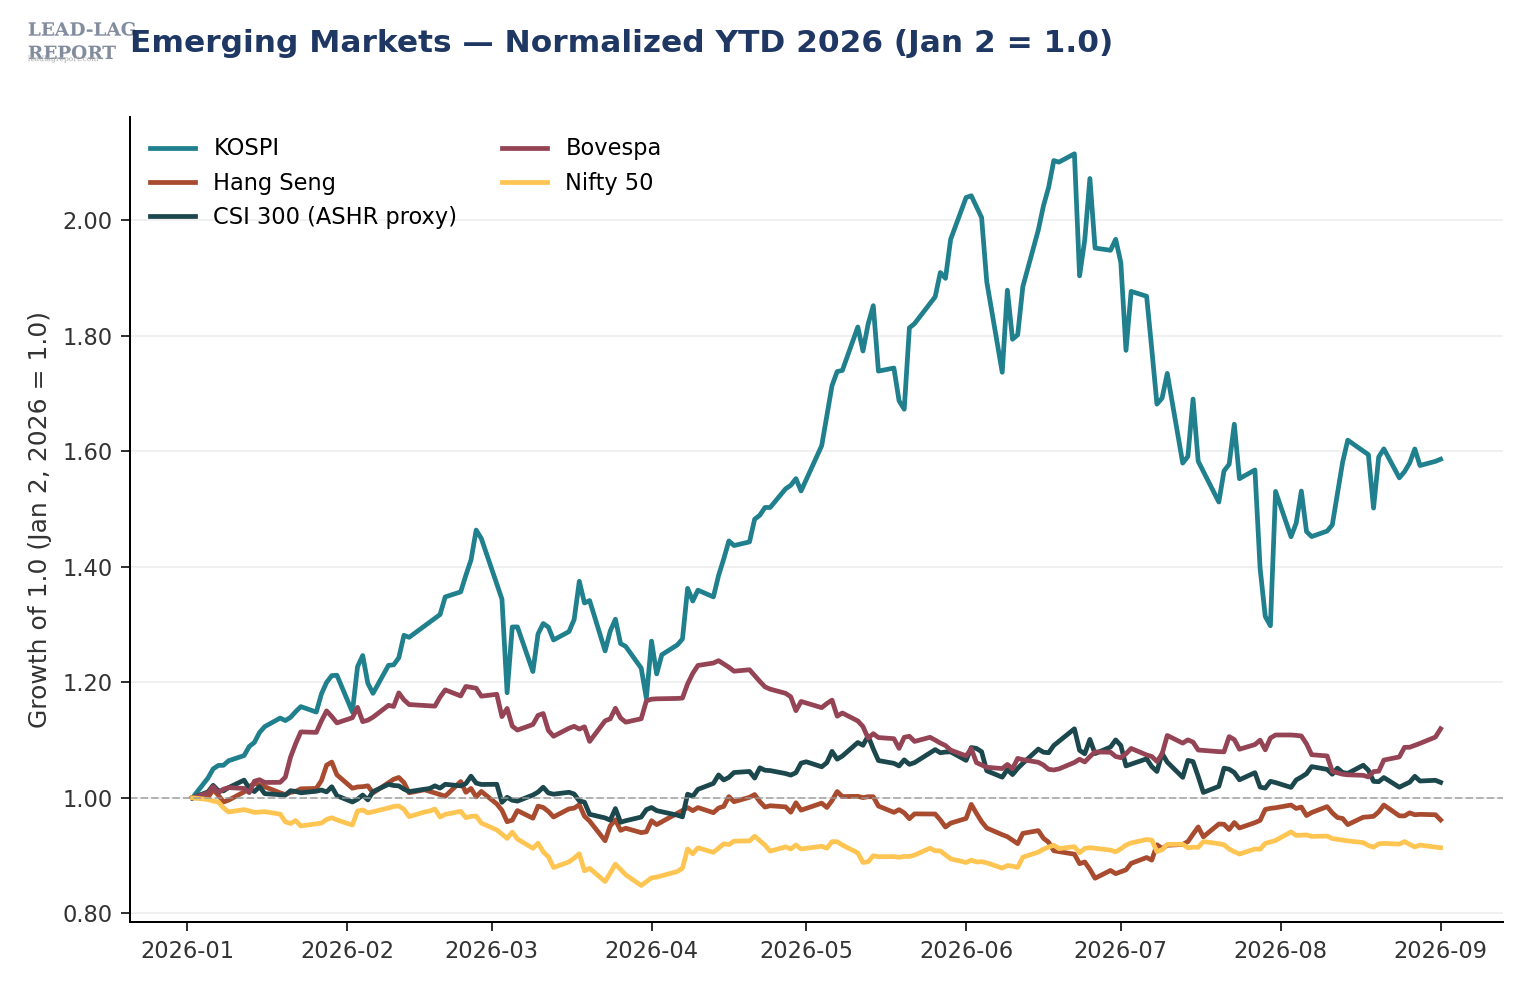
Emerging markets sorted themselves by commodity mix, the cleanest confirmation that this was a barrels-and-real-rates week. Brazil was the standout: the Bovespa closed September 1 at 179,723, up 2.94% on the week, with Petrobras ADRs up 12.7% to $20.02 since August 26 and the real near 5.18 per dollar with the Selic pinned at 14.00%. In the Gulf, the Tadawul slipped 0.2% to 11,101 while Saudi Aramco firmed to 26.18 riyals — the crude-sensitive heavyweight outperforming the broad index. Reuters sources still point to OPEC+ pausing output hikes after the scheduled September rollback. India ran the metals leg in reverse: domestic gold discounts flipped to a marginal premium in late August per the World Gold Council — physical buyers met the price break with demand rather than liquidation. The Nifty 50 consolidated at 24,055.80 and the Sensex at 76,944.28 on September 1.
Asia's problem was not the commodity complex — it was AI capex anxiety, and it worsened after the U.S. close. Korea's KOSPI finished September 1 at 6,835.80, up 0.4% on the week, then fell 4.0% on September 2 to 6,562.72, taking the weekly move to down 5.06% and making Korea the worst major market in this letter's universe despite still being up 55.7% year-to-date. The trigger was not demand — Nvidia had just guided up. It was supply discipline: SK Hynix's plan to lift 2026 capex to $31 billion read locally as overinvestment rather than confidence. China stayed inert for its own reasons: the Hang Seng slipped to 25,311.21 by September 2 and the CSI 300 to 4,611, with the property overhang unresolved and the PBOC still fixing the yuan on the strong side of consensus to slow appreciation. Taiwan's TAIEX at 46,164.72 is still up 59.4% year-to-date. The AI trade is being repriced on the cost of capital, not on end demand.
Now the fulcrum, and why my gold call broke. This was a real-rate event amplified by positioning. Nominal 10-year yields spiked while the 10-year TIPS breakeven compressed to 2.31% per FRED, which means the entire move landed on the real leg — the most reliable headwind for a non-yielding asset. Into that, managed money carried a net long of 144,747 COMEX gold contracts into August 25 per the CFTC. Crowded positioning plus a real-rate shock produces exactly what happened: $4,716.80 to $4,348.00 (front-month COMEX) in four sessions, with silver worse, down 6.0% to $64.62. The dollar did its part without doing much — the dollar index closed September 1 at 99.67, up only about 1.5% year-to-date. What is interesting is what refused to participate. Bitcoin closed September 1 at $77,403.63, down 2.0% on the week and 12.4% year-to-date, even as U.S. spot bitcoin ETFs continued to take in material net inflows. Institutional money keeps buying an asset that will not rally, and gold sold off anyway.
Which brings it back to the arbiter. Copper is the one honest cyclical in the complex, and copper did not blink: $6.51 on September 1 against $6.71 on August 25, up 17.6% year-to-date — and it held even with confirmation that China's refined copper net imports fell 13% year-over-year in the first half of 2026. The base complex held with it, LME aluminum near $3,266 and nickel at $16,628. That is not the tape of a global economy rolling over, and it is why I am not reading a $90 barrel as a demand signal. The barrel move is supply: a projectile disabled a tanker nine nautical miles off Ash Shishah, Oman on August 24; Iran blacklisted 45 tankers, pushing weekend crossings through the Strait of Hormuz below 20; Treasury Secretary Scott Bessent answered with the "toughest sanctions in history." A WTI-Brent spread of $4.43 on the September 1 settlements fits that read — a waterborne-supply premium, not a U.S. demand surge. Gold's durability was wrong. Crude's reversibility was right. Copper's flatness tells you which of the two matters: with the cyclical anchor unmoved, a crude spike is an inflation impulse the Fed has to answer.
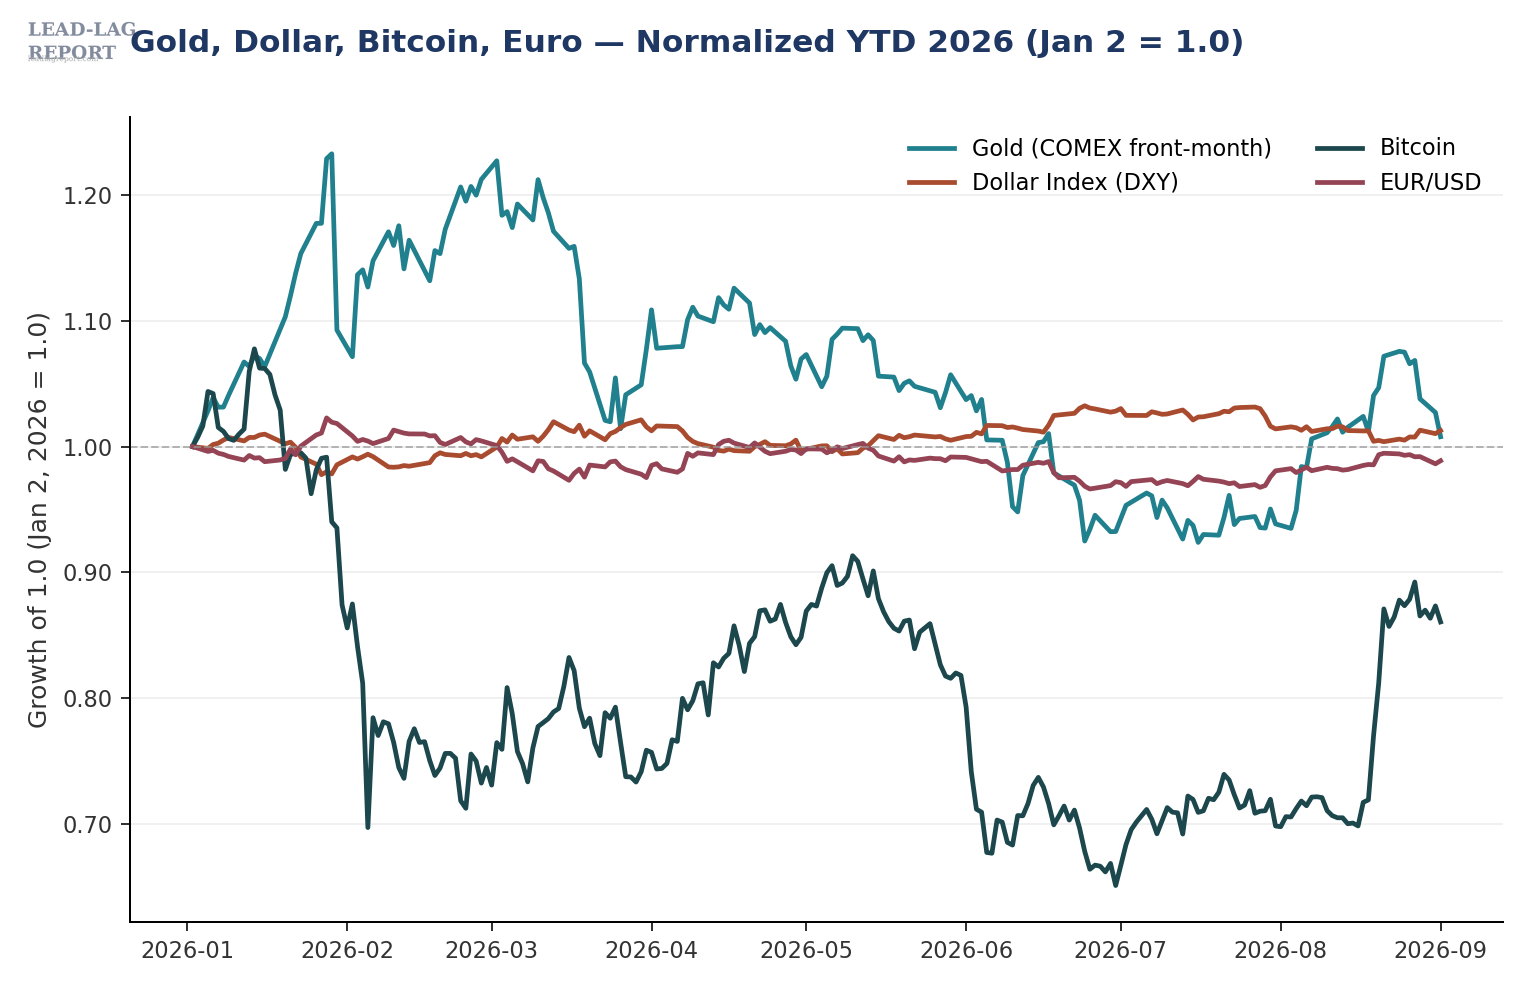
What I'm watching next week. First, the September 15-16 FOMC, with roughly a 66% hike probability priced as of September 1 — whether the CPI, PPI and payrolls prints between now and then break that pricing is the most contested policy call of the year. Second, copper: if it joins the metals selloff the read above changes to a genuine growth scare. Third, the Iran and Hormuz aftermath — another tanker strike puts $95 WTI in play, while a credible Bessent de-escalation takes the premium out as fast as it came in. Fourth, the long end: the 30-year at 5.25% on H.15 is the level that broke the semiconductor tape this month. Fifth, Asia AI capex, where the KOSPI's 4.0% Wednesday drop says the trade is being repriced on the cost of capital rather than demand. And keep the scorecard honest: I was wrong on gold's durability, right on crude's reversibility, and the leg that held is the one the whole thesis rested on.
The Lead-Lag Report is provided by Lead-Lag Publishing, LLC. All opinions and views mentioned in this report constitute our judgments as of the date of writing and are subject to change at any time. Information within this material is not intended to be used as a primary basis for investment decisions and should also not be construed as advice meeting the particular investment needs of any individual investor. Trading signals produced by the Lead-Lag Report are independent of other services provided by Lead-Lag Publishing, LLC or its affiliates, and positioning of accounts under their management may differ. Please remember that investing involves risk, including loss of principal, and past performance may not be indicative of future results. Lead-Lag Publishing, LLC, its members, officers, directors and employees expressly disclaim all liability in respect to actions taken based on any or all of the information on this writing.



