
What Commercial Paper Is Quietly Telling You
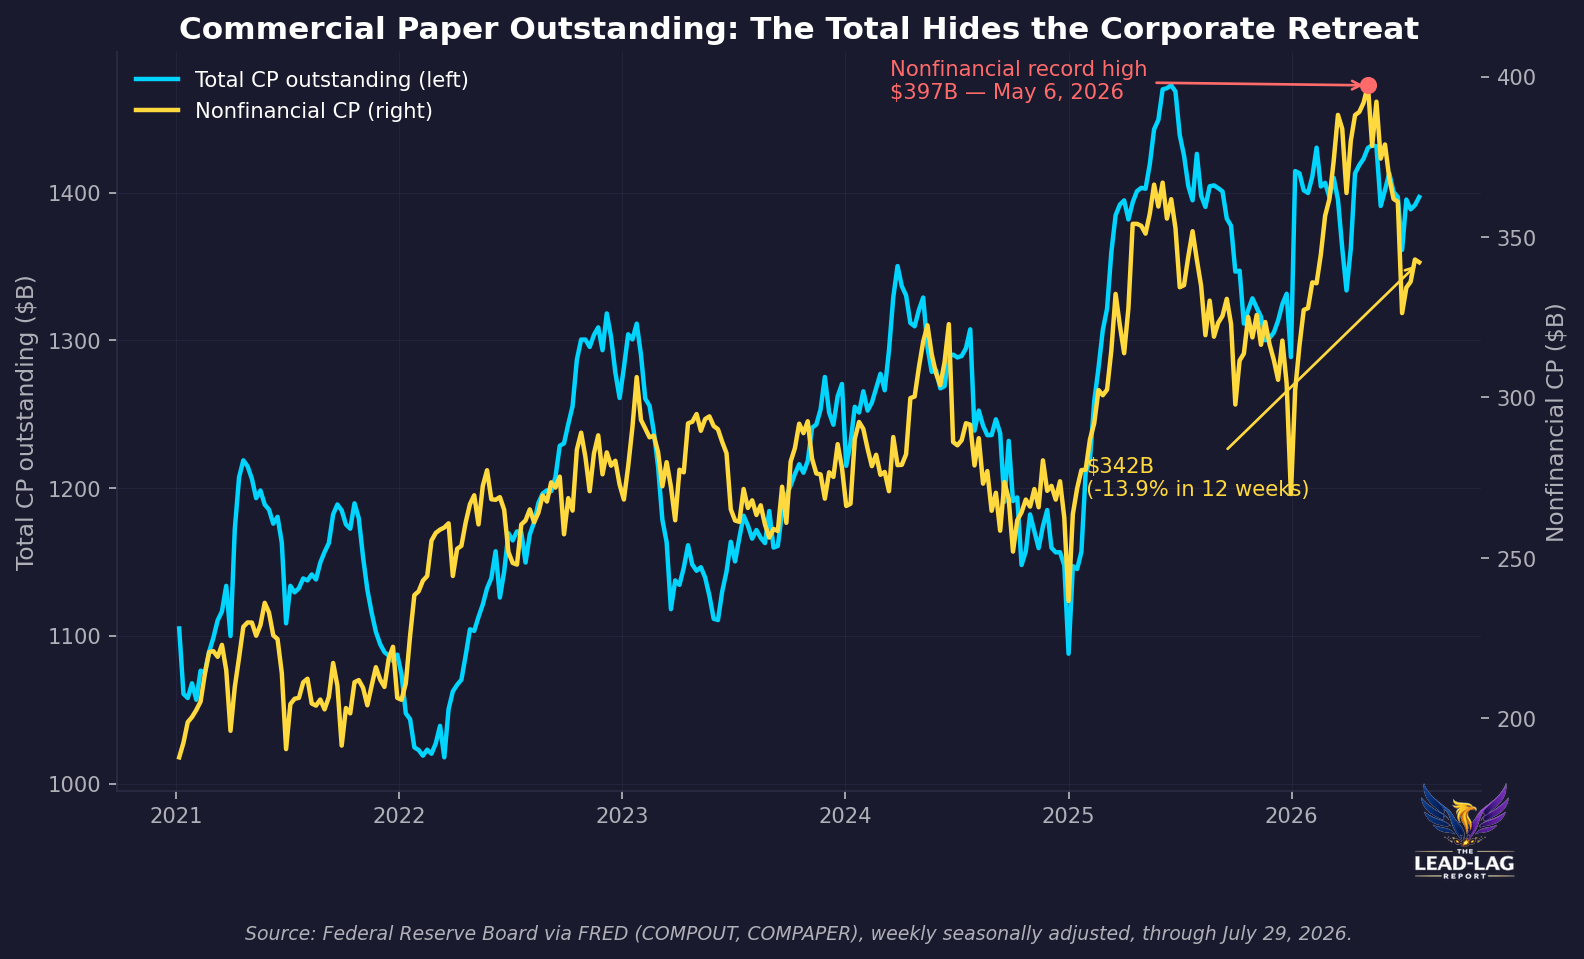
Nonfinancial commercial paper hit a record $397.2 billion on May 6, 2026, then fell to $342.1 billion by July 29. A 13.9 percent 12-week contraction, in the 7th percentile since 2001. Last two times CP moved this way: 2007 and 2019. Corporate treasurers were already gone.

Today’s Lead-Lag Report post is sponsored by Airthium

WE BUY POWER LOW AND SELL INDUSTRIAL HEAT.
Airthium is building a high-temperature heat pumps designed to turn volatile electricity prices into lower-cost factory heat.
We raised $6.5M+ from Y Combinator, DCVC, Daphni VC, Polytechnique Ventures, and 2,000+ retail investors. Help fund IP + key hires for the next machine.
DISCLAIMER — PLEASE READ: This is sponsored advertising content for which Lead-Lag Publishing, LLC has been paid a fee. The information provided in the link is solely the creation of Airthium. Lead-Lag Publishing, LLC does not guarantee the accuracy or completeness of the information provided in the link or make any representation as to its quality. All statements and expressions provided in the link are the sole opinion of Airthium and Lead-Lag Publishing, LLC expressly disclaims any responsibility for action taken in connection with the information provided in the link.
Key Highlights
- Nonfinancial commercial paper outstanding set an all-time record of $397.2 billion on May 6, 2026, then fell to $342.1 billion by July 29 — a 13.9 percent contraction in twelve weeks, in the bottom decile of all thirteen-week changes since 2001.
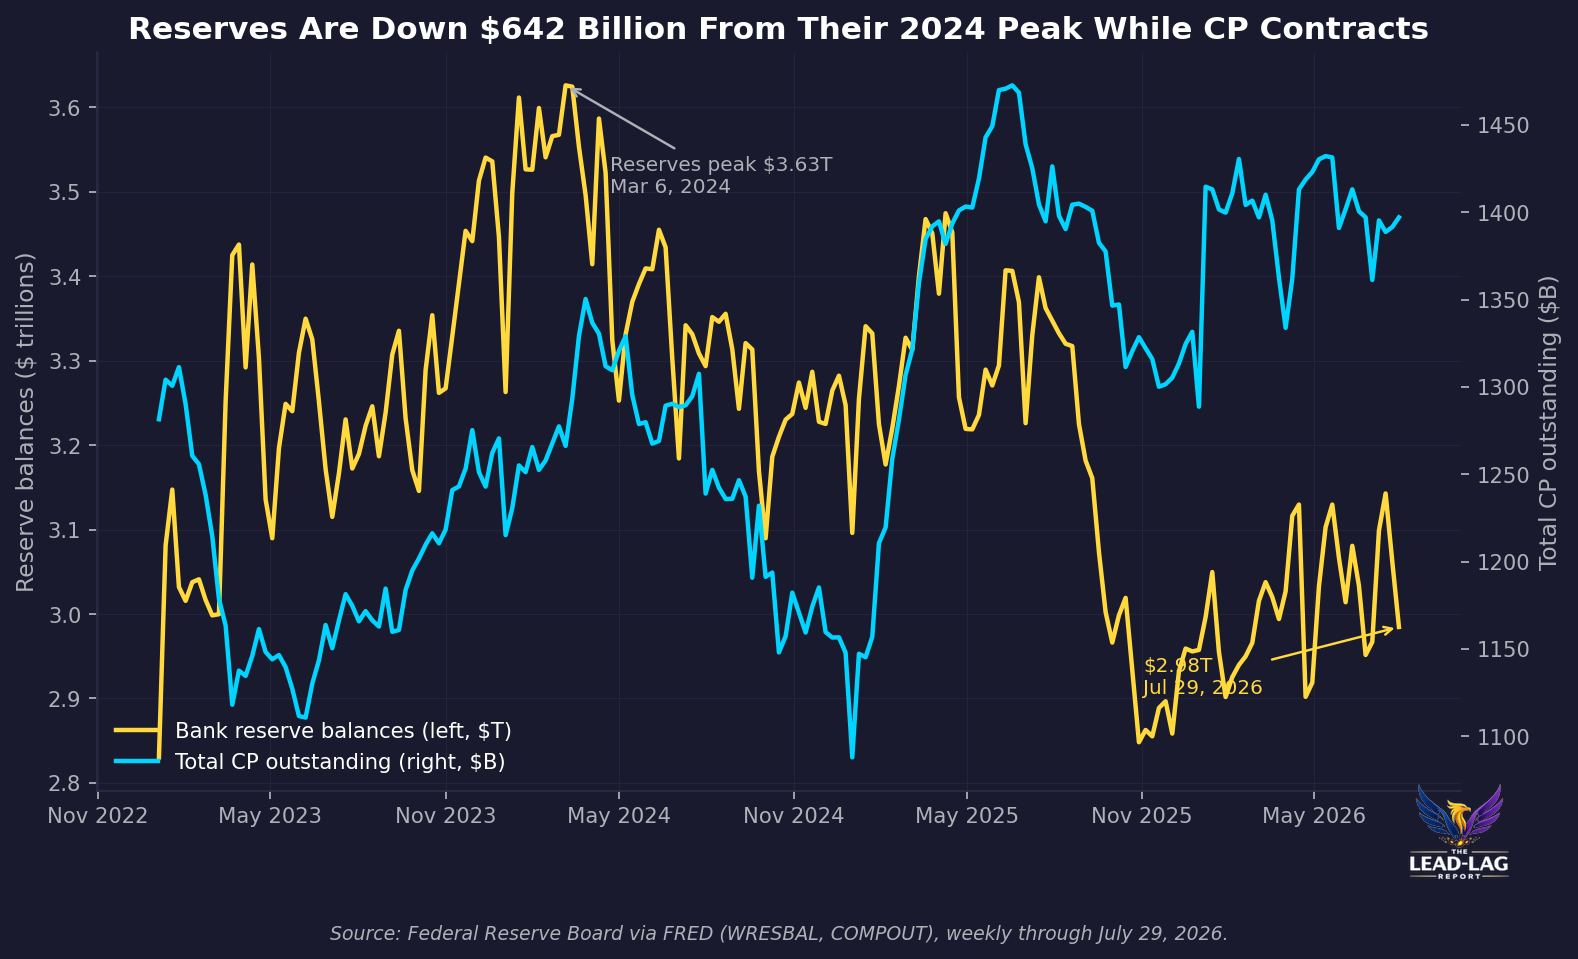
- Total commercial paper outstanding is $1,397.1 billion, down 2.0 percent year over year and 5.1 percent below the June 2025 cycle peak, with the headline propped up almost entirely by asset-backed paper at its highest level since December 2009.
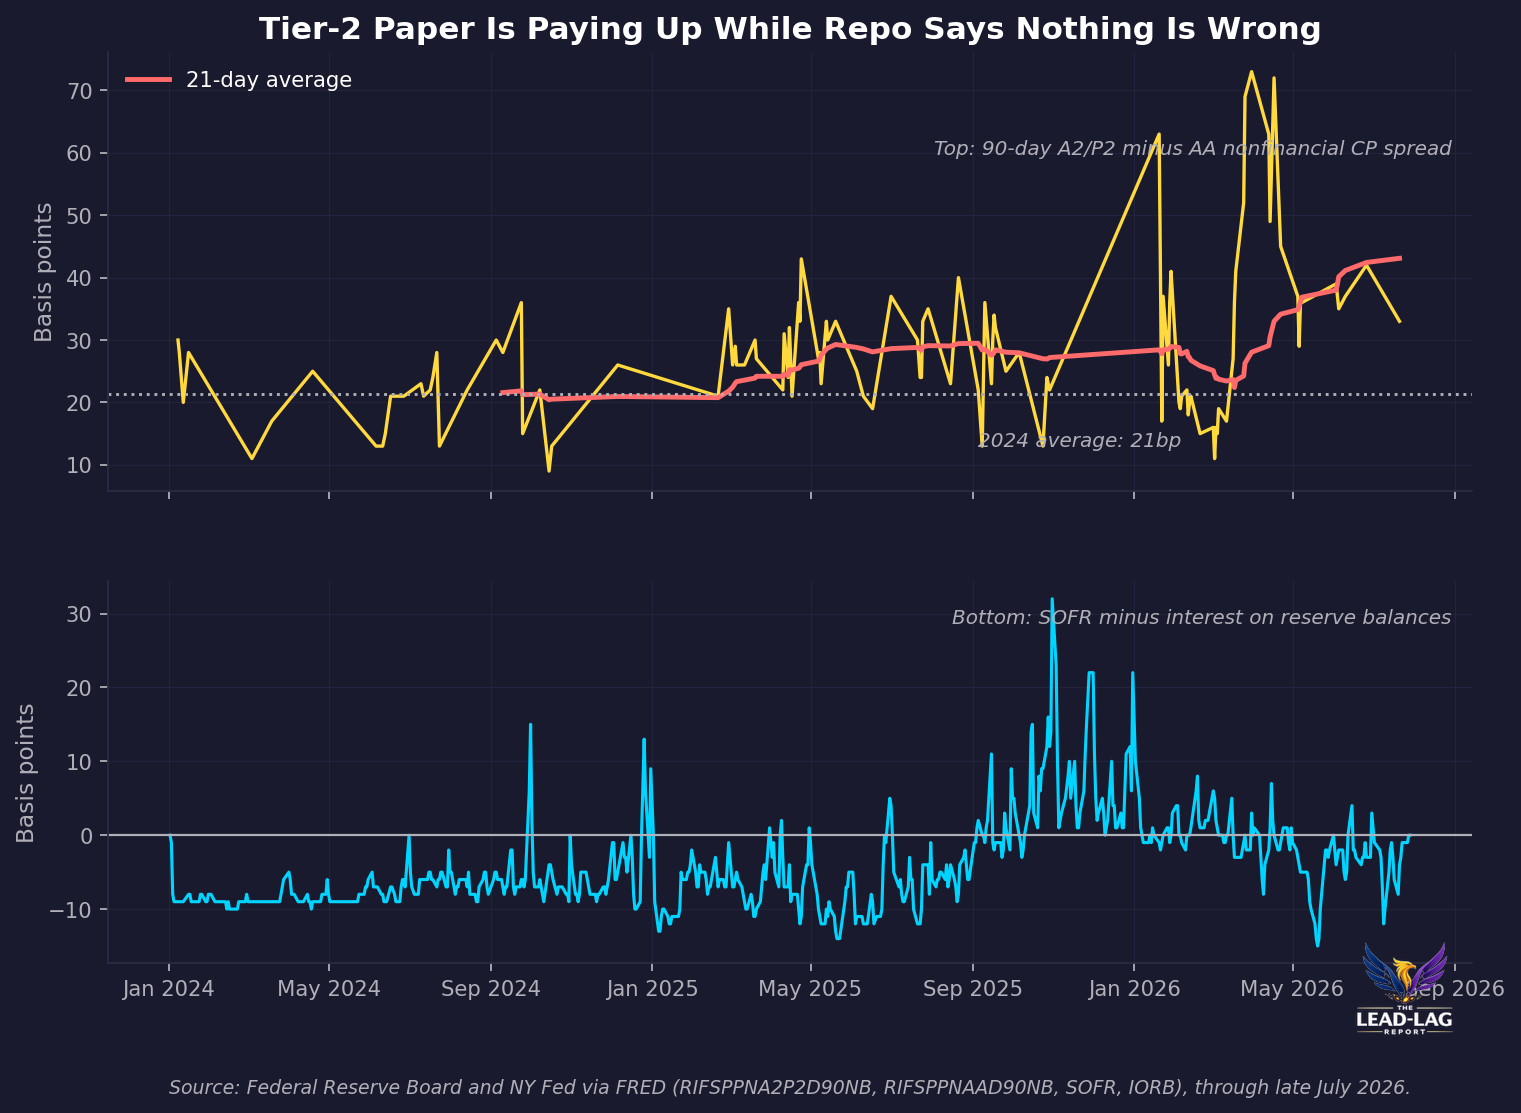
- The 90-day A2/P2 minus AA nonfinancial spread averaged 57 basis points in April and 38 in June, against a 21 basis point average through 2024 — tier-2 issuers are paying up while SOFR trades flat to interest on reserves.
- Both the 2007 and 2019 cycles began with exactly this configuration: a commercial paper peak, a quiet corporate step-back, and unbothered overnight funding markets.
The Series Nobody Quotes
Consensus on funding markets in the summer of 2026 is that there is nothing to discuss. Overnight repo prints where it is supposed to print, the standing repo facility is barely used, bill auctions clear, and the phrase “ample reserves” still appears in almost every desk note. That read is defensible on the plumbing itself. It is also looking at the wrong instrument.
Commercial paper is the part of the funding stack that responds to corporate intent rather than dealer mechanics. It is unsecured, short-dated, and entirely discretionary: a treasurer rolls paper because rolling paper is cheaper and more convenient than the alternatives, and stops rolling it the moment that judgment changes. Total commercial paper outstanding was $1,397.1 billion in the week ending July 29, 2026, down 2.0 percent from $1,426.3 billion a year earlier and 5.1 percent below the June 18, 2025 cycle peak of $1,472.7 billion.[1] That is a soft number, easy to wave away as noise.
The component underneath it is not soft. Nonfinancial commercial paper — paper issued by operating companies, the cleanest available read on what corporate treasurers are actually doing — hit an all-time high of $397.2 billion on May 6, 2026. Twelve weeks later it stands at $342.1 billion.[2] That is a 13.9 percent drawdown, roughly $55 billion of paper simply not rolled, and the thirteen-week rate of change sits in the seventh percentile of every thirteen-week window since the series began in 2001. The only comparable stretches are the 2020 collapse, the 2003 year-end distortion, and early 2006.
Nothing about this is a crisis print. That is precisely why it is worth reading. Corporate treasurers do not withdraw from the paper market in the middle of a panic; they withdraw before one, when the cost of carrying an unsecured rollover no longer looks worth the convenience.
——— PAID SUBSCRIBERS CONTINUE BELOW ———
The Composition Is the Message
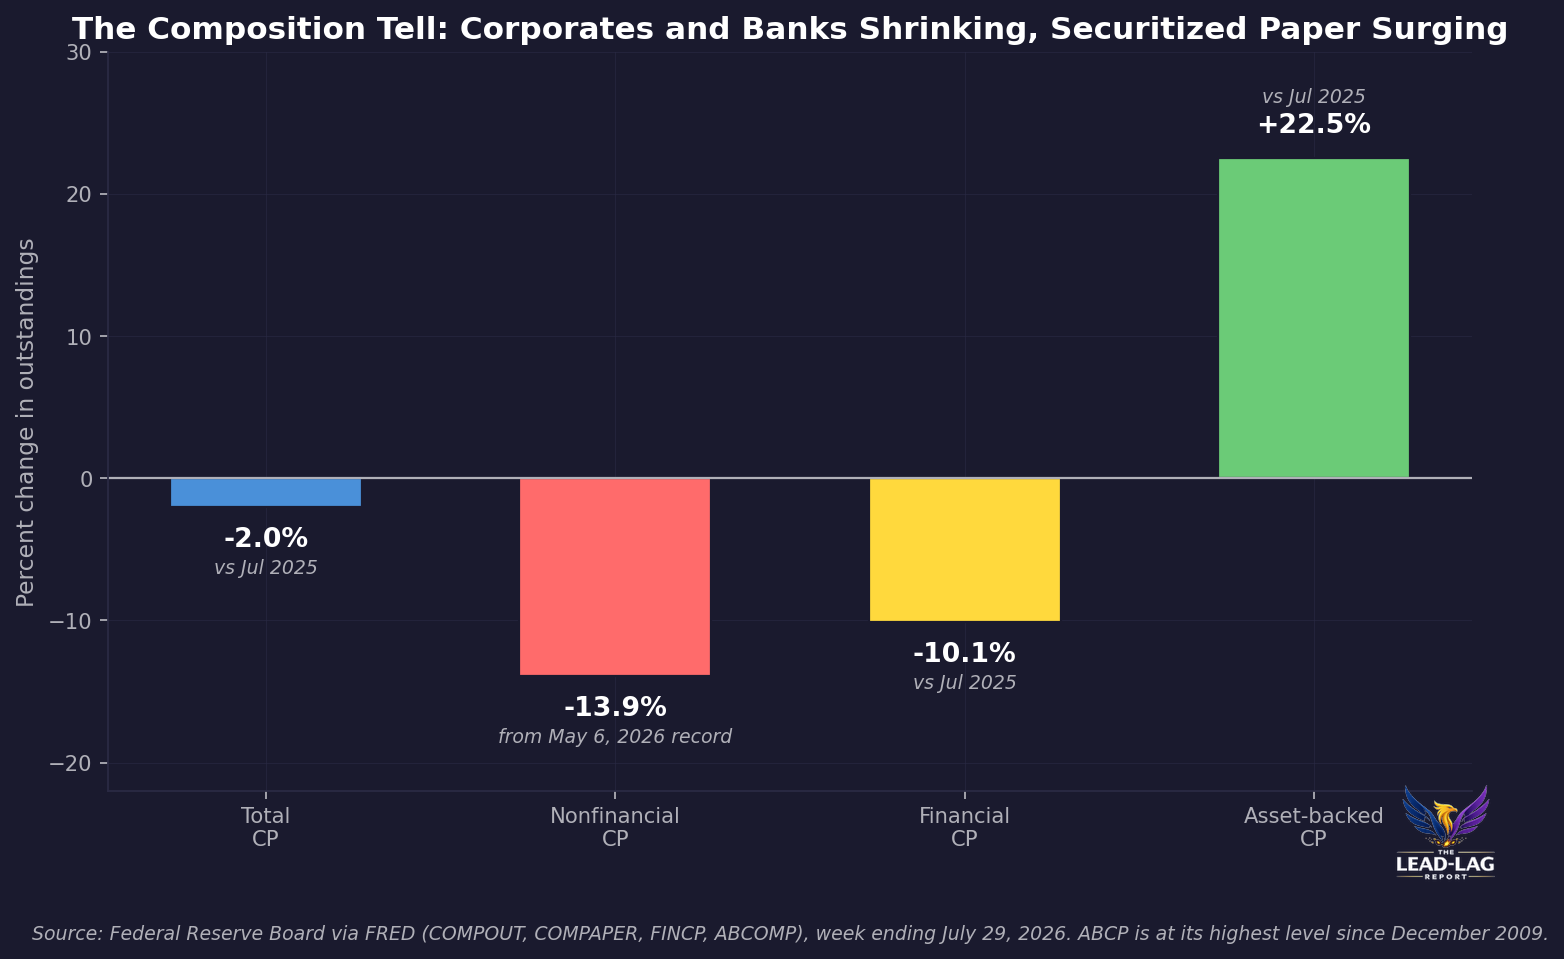
Aggregates lie by construction when the components are moving in opposite directions. Financial commercial paper is $602.6 billion, down 10.1 percent year over year.[3] Asset-backed commercial paper is $482.5 billion, up 22.5 percent year over year and at its highest level since December 2009.[4] So the total looks merely soft because securitized conduit paper is expanding fast enough to mask a simultaneous retreat by operating companies and by financial issuers. Strip out the asset-backed growth and the unsecured corporate funding market is contracting at a double-digit pace.
The rate stack tells the same story from the price side. Ninety-day AA nonfinancial paper yields 3.74 percent, about eight basis points through the 3.82 percent three-month bill — high-grade corporate paper is scarce enough that investors accept less than Treasury yield to hold it.[5] Meanwhile 90-day AA financial paper prints at 3.88 percent and AA asset-backed paper at 3.92 percent, against interest on reserve balances at 3.65 percent.[6] Scarce corporate paper, abundant conduit paper, and a widening premium for anything that is not a top-tier operating company. That is a composition shift, not a liquidity event.
Tier Two Is Paying Up While Repo Says Nothing
The tier-1 versus tier-2 spread — 90-day A2/P2 paper minus 90-day AA nonfinancial paper — is the cleanest available gauge of whether the marginal borrower is being rationed. It closed at 33 basis points on July 21, 2026, after monthly averages of 57 basis points in April, 35 in May and 38 in June.[7] The comparison that matters is the base rate: that spread averaged 21 basis points across 2024 and 28 basis points across 2025. Tier-2 issuers are now paying close to double the 2024 premium for the same ninety days of money.
For scale, this measure averaged 66 basis points in August 2007, 111 basis points in March 2020, and 407 basis points in October 2008.[7] Today's level is nowhere near stress. It is at roughly the August 2007 level's midpoint, and it is drifting in one direction while the instrument everyone actually watches sits perfectly still. SOFR minus interest on reserve balances was zero basis points on July 29 and has averaged negative three over the past month, versus an average of plus seven with a 32 basis point spike as recently as October 2025.[8] Secured overnight funding has gotten calmer over the past nine months. Unsecured term funding for anything below the top tier has gotten more expensive. Both things are true, and only one of them is in the daily commentary.
Two Reruns Worth Reading
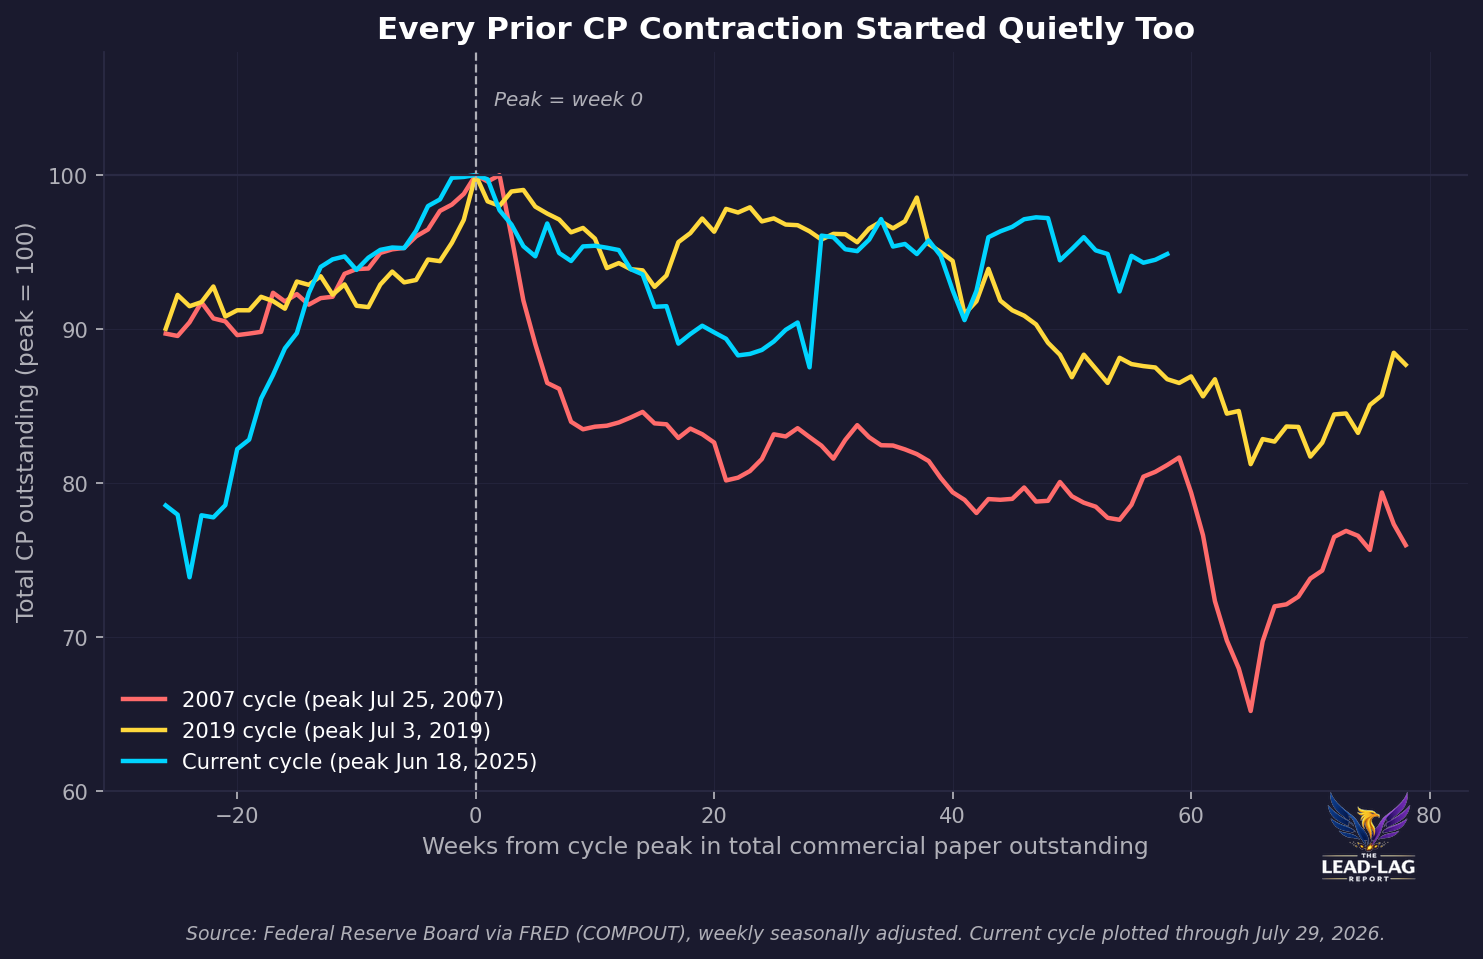
The 2007 sequence is documented in the same series. Total commercial paper peaked at $2,222.8 billion on July 25, 2007. By the end of that August it was $1,978.7 billion, and by December $1,785.9 billion — a 19.7 percent contraction that was fully underway before Bear Stearns, before Lehman, and before anyone described the period as a credit crisis.[1] Nonfinancial paper went from $200.6 billion in July 2007 to $177.0 billion by September, then bounced through the first half of 2008 while the securitized part of the market disintegrated.[2] The corporate step-back led. The recognized event followed by more than a year.
The 2019 sequence rhymes. Total paper peaked at $1,163.9 billion on July 3, 2019. Nonfinancial paper fell from $334.4 billion that July to $283.6 billion by December, a 15.2 percent decline, in a market that was otherwise being described as late-cycle but healthy — with the September 2019 repo episode arriving in the middle of it.[2] Total commercial paper then bottomed at $945.3 billion in September 2020. In both episodes the sequence was identical: quiet contraction in outstandings, indifferent overnight markets, and a subsequent reckoning that arrived somewhere else on the balance sheet.
Indexed to each cycle peak, the current path has tracked between the 2007 and 2019 analogs for fifty-eight weeks. It has not broken down the way 2007 did in its first quarter after the peak. It also has not recovered its peak, which is the only outcome that would end the comparison.
The Case Against Reading Anything Into This
The honest steelman is strong enough that it belongs before the conclusion. First, the measures disagree. SIFMA reports outstanding money market paper of $1.46 trillion through May 2026, up 4.7 percent year over year, on a broader and differently adjusted basis than the Federal Reserve's weekly seasonally adjusted series.[9] The Federal Reserve's own monthly table shows nonfinancial paper at $328.0 billion in January and $322.5 billion in May, a far milder move than the weekly series implies.[10] Second, quarter-end and year-end window dressing distorts weekly commercial paper prints badly — the July 1, 2026 observation of $326.3 billion is an obvious artifact.
Third, and most substantively, corporates are not short of money. The 2026 AFP Liquidity Survey found that 46 percent of organizations increased U.S. cash holdings over the prior twelve months, up from 38 percent, with stronger operating cash flow the leading driver, and only 14 percent reporting decreases.[11] Berkshire Hathaway alone closed the first quarter of 2026 with a record $397.4 billion in cash and equivalents.[12] A treasurer with a growing cash pile has no reason to keep rolling paper. That interpretation — balance-sheet strength, not caution — is entirely consistent with the data and would be the benign reading.
Two things sit awkwardly with the benign reading. The same survey shows the typical organization holding 42 percent of short-term investments in bank deposits, the lowest share since 2011, with the migration going into money funds and Treasuries.[11] Companies flush with cash and comfortable with counterparty risk do not move away from deposits. And reserve balances are $2.985 trillion, down $642 billion from their March 2024 peak of $3.626 trillion and 10.8 percent lower than a year ago.[13] “Ample reserves” is a level judgment, and the level has been falling for two years.
What Would Falsify This, and What It Means for Exposure
The thesis is specific enough to be wrong on a defined timetable. If nonfinancial commercial paper rebuilds above $370 billion within the next eight weeks and the A2/P2 spread settles back under 25 basis points, this was quarter-end noise plus a cash-rich corporate sector choosing not to bother with paper, and the signal is dead. That is a real possibility, and the July 22 and July 29 prints of $343.0 billion and $342.1 billion are at least a stabilization rather than a continued slide.
The configuration that would confirm it is equally specific: nonfinancial outstandings continuing lower while asset-backed paper carries the total, the tier-2 spread grinding through 60 basis points on a sustained rather than a month-average basis, and reserve balances falling through $2.9 trillion. That combination would describe a funding market where the marginal unsecured borrower is being rationed quietly, in an instrument nobody watches daily, while the instrument everyone does watch stays calm because it is collateralized and backstopped.
For positioning, the asymmetry does not require the confirming path to occur. It requires only that the market is pricing a zero probability of it. Short-duration quality exposure, bills over unsecured corporate paper, and Treasury duration over credit beta are all cheap ways to hold the possibility. The expensive position is the one that assumes a calm overnight rate is evidence about corporate funding intent, when the two have historically diverged for a year before converging violently.
Commercial paper is not a leading indicator because it is clever. It is a leading indicator because it is voluntary, and every quarter a treasurer chooses not to roll it is a decision made months before the event that would have justified it.
Few understand this.
— — —
Notes
[1] Board of Governors of the Federal Reserve System, Commercial Paper Outstanding (COMPOUT), weekly seasonally adjusted, via FRED. https://fred.stlouisfed.org/series/COMPOUT
[2] Board of Governors of the Federal Reserve System, Nonfinancial Commercial Paper Outstanding (COMPAPER), weekly seasonally adjusted, via FRED. https://fred.stlouisfed.org/series/COMPAPER
[3] Board of Governors of the Federal Reserve System, Financial Commercial Paper Outstanding (FINCP), via FRED. https://fred.stlouisfed.org/series/FINCP
[4] Board of Governors of the Federal Reserve System, Asset-Backed Commercial Paper Outstanding (ABCOMP), via FRED. https://fred.stlouisfed.org/series/ABCOMP
[5] 90-Day AA Nonfinancial Commercial Paper Interest Rate (RIFSPPNAAD90NB), July 27, 2026, and 3-Month Treasury Bill Secondary Market Rate (DTB3), via FRED. https://fred.stlouisfed.org/series/RIFSPPNAAD90NB and https://fred.stlouisfed.org/series/DTB3
[6] 90-Day AA Financial Commercial Paper Interest Rate (RIFSPPFAAD90NB), 90-Day AA Asset-Backed Commercial Paper Interest Rate (RIFSPPAAAD90NB), and Interest Rate on Reserve Balances (IORB), July 29, 2026, via FRED. https://fred.stlouisfed.org/series/RIFSPPFAAD90NB and https://fred.stlouisfed.org/series/IORB
[7] 90-Day A2/P2 Nonfinancial Commercial Paper Interest Rate (RIFSPPNA2P2D90NB) less 90-Day AA Nonfinancial Commercial Paper Interest Rate (RIFSPPNAAD90NB), author calculation on daily data via FRED. https://fred.stlouisfed.org/series/RIFSPPNA2P2D90NB
[8] Secured Overnight Financing Rate (SOFR) less Interest Rate on Reserve Balances (IORB), author calculation, via FRED. https://fred.stlouisfed.org/series/SOFR
[9] SIFMA, US Money Market Instruments Statistics, data through May 2026, published July 6, 2026. https://www.sifma.org/research/statistics/us-money-market-instruments-statistics
[10] Board of Governors of the Federal Reserve System, Commercial Paper Rates and Outstanding Summary, monthly-end seasonally adjusted outstanding levels. https://www.federalreserve.gov/releases/cp/
[11] 2026 AFP Liquidity Survey, underwritten by Invesco, as summarized by Invesco, July 2026. https://www.invesco.com/us/en/insights/cash-trends-liquidity-survey.html
[12] Berkshire Hathaway first-quarter 2026 Form 10-Q cash and equivalents of $397.4 billion, as reported by Yahoo Finance, July 19, 2026. https://finance.yahoo.com/markets/stocks/articles/may-soon-why-warren-buffett-121121468.html
[13] Board of Governors of the Federal Reserve System, Reserve Balances with Federal Reserve Banks (WRESBAL), weekly, via FRED. https://fred.stlouisfed.org/series/WRESBAL
[14] Federal Reserve Board, About the Commercial Paper Data Release — methodology for DTCC-sourced outstandings and category definitions. https://www.federalreserve.gov/releases/cp/about.htm



