A 20% Yield From BlackRock With A Built-In Expiration Date
BlackRock Capital Allocation Term Trust (BCAT) pays nearly 20% on a 55/44 balanced portfolio, and because it is a term trust the discount has a floor. The catch is a distribution that has been shrinking for three straight years.

KEY HIGHLIGHTS
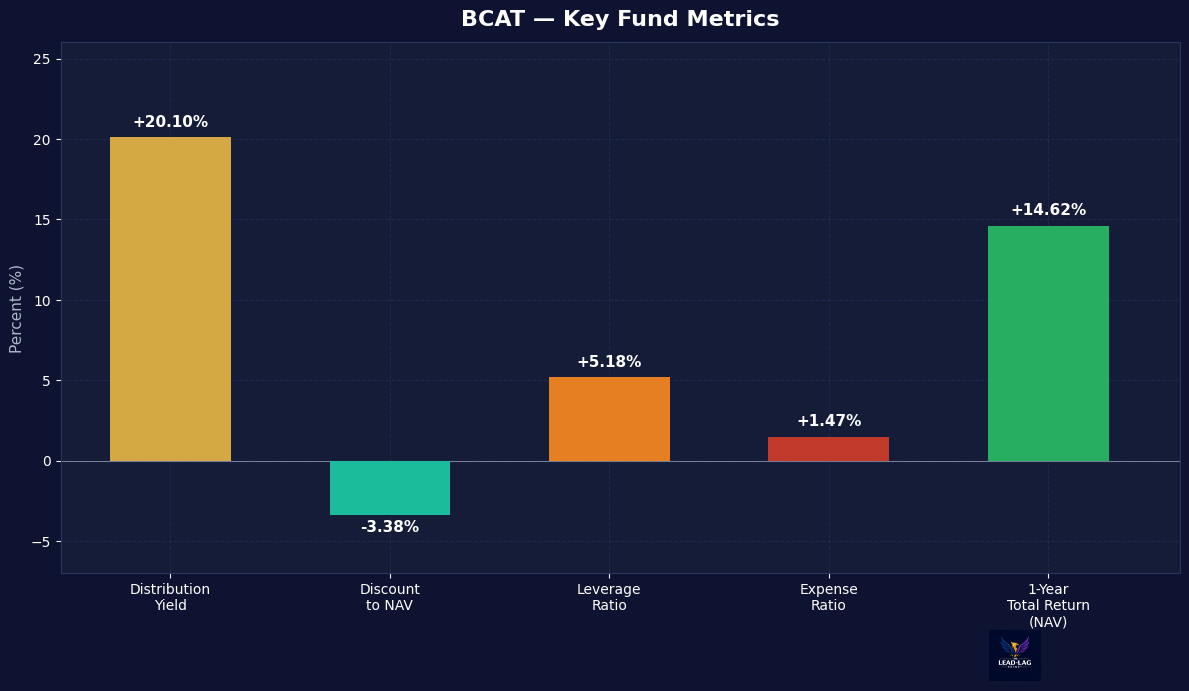
Yield: ~19.8% forward distribution yield | ~20.1% trailing
Term Trust: Defined termination date -- discount of -3.38% represents an embedded NAV-convergence gain at liquidation
Valuation: -3.38% discount vs -1.93% 52-week average -- modestly cheaper than recent history; 52-week range -18.4% to +8.4%
Distribution trend: Declining from $0.2988/mo (2023) to $0.2500/mo (Aug 2026) -- partially return of capital
AUM: ~$1.57B | Expense ratio: 1.47%
Every week, we'll profile a high yield investment fund that typically offers an annualized distribution of 6-10% or more. With the S&P 500 yielding less than 2%, many investors find it difficult to achieve the portfolio income necessary to meet their needs and goals. This report is designed to help address those concerns.

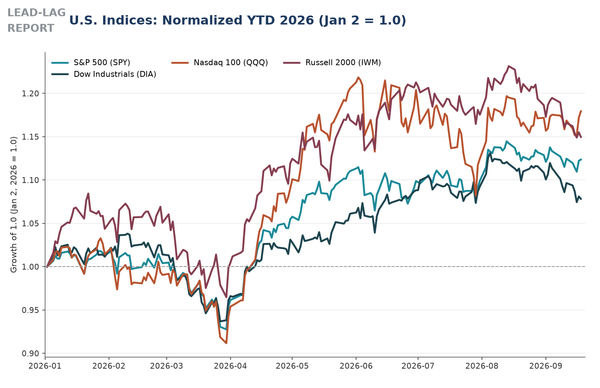
The macro setup right now is uncomfortable for anyone who needs income. The Fed is holding rather than cutting, credit spreads are about as tight as they get without becoming a punchline, and equity indices sit near highs while tariff policy remains an open question nobody can model with confidence. Every asset that pays you something has been bid up by the same crowd running the same reach for yield. There is no cheap corner of the income market left, only corners that are less expensive for identifiable reasons.
That is the environment in which a fund advertising close to a 20% distribution yield deserves either immediate dismissal or careful work. Usually it is the former. Occasionally the structure is doing something real.
The BlackRock Capital Allocation Term Trust (BCAT) is the more interesting case. This is a roughly $1.57 billion closed-end fund holding a genuinely balanced portfolio, about 55% equity, 44% fixed income, and 4% commodities, paying $0.25 per share monthly, or $3.00 annualized, against a $15.14 price ([BlackRock](https://www.blackrock.com/us/individual/products/315530/blackrock-capital-allocation-term-trust)). That is a 19.8% forward yield, roughly 20.1% on the trailing twelve months of $3.14. The portfolio is not exotic. Top equity positions are Microsoft at 3.42%, Nvidia at 2.62%, Amazon at 2.41%, Apple at 1.97%, and Alphabet at 1.87%, the same names you already own, while the largest single line item is the US two-year Treasury note at 22.85% of the portfolio ([BlackRock fact sheet](https://www.blackrock.com/us/individual/literature/fact-sheet/blackrock-capital-allocation-term-trust-class-usd-factsheet-us09260u1097-us-en-individual.pdf)).
So the honest question is not whether the yield is sustainable, because it plainly is not being earned. It is whether the total package, a managed balanced portfolio bought at a discount in a wrapper that will eventually pay you NAV in cash, justifies a 1.47% expense ratio and a payout that is partly your own money coming back.
Fund Background
BCAT launched in 2021 as a term trust, and that word is the single most important thing in the ticker's profile. Unlike a perpetual closed-end fund, which can trade at a discount forever with no mechanism forcing the gap to close, BCAT has a defined termination date, at which point it liquidates and returns net asset value to shareholders in cash. The discount does not need sentiment, a buyback, or an activist filing a 13D. It closes by contract.
Shares trade at $15.14 against a NAV of $15.67, a discount of 3.38% ([CEFConnect](https://www.cefconnect.com/fund/BCAT)). Every dollar you commit buys about $1.035 of assets, and if you hold to termination you collect that spread independent of what markets do. Small, but asymmetric, and the sort of edge most closed-end fund buyers never actually get.
Structurally, the fund is unusual for a high-yielding CEF in that it barely uses leverage. Effective leverage runs 5.18%, achieved through derivatives rather than traditional borrowing, so BCAT is not exposed to the funding cost spiral that punished leveraged bond CEFs during rate shocks. Effective duration is 3.06 years, genuinely short. Shares outstanding total 104,775,271, and annual turnover of 260% tells you the managers run an active tactical mandate rather than a static allocation.
Portfolio Composition

What BCAT actually owns is closer to a target allocation fund than to an income vehicle. Roughly 55% sits in equity, weighted heavily toward North American large cap and concentrated in the same technology leadership that has driven index returns for years. About 44% sits in fixed income, and the composition there is deliberately conservative: the two-year Treasury note at 22.85% of the portfolio, SOFR swap positions, and agency mortgage-backed securities at 12.47% ([BlackRock fact sheet](https://www.blackrock.com/us/individual/literature/fact-sheet/blackrock-capital-allocation-term-trust-class-usd-factsheet-us09260u1097-us-en-individual.pdf)). A commodities sleeve of roughly 4% rounds it out. Total holdings run above 1,300 positions.
Read that fixed income book carefully, because it changes the risk profile from what the headline yield implies. This is not high yield credit dressed up with leverage. It is short Treasuries, swaps, and agency paper, about as close to risk-free as fixed income gets, and the 3.06 year duration means a 100 basis point rate move costs roughly 3% of the bond sleeve rather than the 8% to 12% long-duration CEFs absorbed in 2022.
Which means the risk in BCAT is equity risk, plainly stated. Fifty-five percent of the fund rides on large cap technology multiples holding up. If the AI capital expenditure cycle disappoints or tariffs resolve badly for hardware supply chains, NAV takes the hit and no amount of two-year Treasury exposure offsets it. Investors reading 20% and assuming a bond fund are misreading this.
Performance Analysis


The return record is short but instructive. NAV total returns run positive 5.2% in 2021, negative 13.5% in 2022, positive 11.7% in 2023, positive 11.1% in 2024, positive 14.6% in 2025, and positive 8.5% year to date in 2026 ([CEFConnect](https://www.cefconnect.com/fund/BCAT)). That is a credible balanced fund record, and the 2022 drawdown is meaningfully better than what a 60/40 portfolio delivered that year.
Price returns tell a noisier story: negative 5.2%, negative 22.6%, positive 19.3%, positive 19.4%, positive 16.8%, and positive 24.7% year to date. Notice how far price exceeds NAV in every year since 2023. That gap is discount compression, not investment performance, and over the past 52 weeks the discount has traveled from as wide as negative 18.4% to as rich as a positive 8.4% premium.
This is the part investors should sit with. The extraordinary price returns of the last three years were substantially the market repricing BCAT from deeply discounted to occasionally premium, a one-time gain that has largely been taken. At negative 3.38% against a 52-week average of negative 1.93%, you buy modestly cheaper than the recent norm but nowhere near the distressed levels that produced those returns.
Macro Environment
My read is that BCAT's construction fits the moment better than most income vehicles, for reasons that have nothing to do with the yield.
Start with what can go wrong elsewhere. Leveraged credit CEFs are the standard answer to a yield mandate, and right now they are levered into the tightest spreads of the cycle while the Fed holds, so borrowing costs stay high and there is no spread cushion left. Long-duration bond funds need cuts to work. BCAT sidesteps both: 5.18% leverage makes funding costs nearly irrelevant, 3.06 year duration makes a rate surprise survivable, and the credit exposure is Treasuries and agency MBS rather than triple-C corporates.
What you take on instead is equity beta at index highs plus unresolved tariff policy, and that is not a small substitution. If you are not comfortable owning large cap technology at current multiples, you should not own BCAT regardless of the distribution rate.
The term structure is what makes this tolerable. In a perpetual fund, buying equity beta near highs and hoping the discount holds is a bet on two things going right. In a term trust, if markets sell off and the discount widens, eventual liquidation at NAV still delivers the asset value. You can be wrong about timing and still collect the structural spread.
Distribution Policy

Here is where the honest work has to happen, and where the case gets weaker.
BCAT's monthly distribution has been quietly declining for three years. It ran $0.2988 per share through mid-2024, then stepped down to $0.2617, then $0.2579, then $0.2542, and now sits at $0.2500 ([MarketBeat](https://www.marketbeat.com/stocks/NYSE/BCAT/dividend/)). That is a cumulative cut of roughly 16% from the peak, delivered in increments that individually never made headlines. Trailing distributions total $3.14 against a $3.00 forward run rate, so the 20.1% trailing yield overstates what you will actually receive.
More importantly, the distribution is not covered by net investment income and has not been. A portfolio that is 55% large cap equity and 44% short Treasuries and agency paper does not generate a 20% cash yield. The gap between what the portfolio earns and what the fund pays is filled by realized capital gains when available and return of capital when not.
Return of capital is not automatically destructive. In a fund turning over 260% annually and harvesting gains actively, some of what gets classified that way is timing rather than erosion. But some of it is genuine erosion, and the steady march down in the monthly rate is the tell. A fund comfortably covering its payout does not trim four times in two years. I would plan on it drifting lower.
The correct way to underwrite BCAT is therefore total return, not yield. Treat the $0.25 monthly as a managed withdrawal from a balanced portfolio, roughly a 19% annual rate, and ask whether the portfolio can generate that. It cannot, and it is not trying to. What you are buying is a balanced fund with an aggressive distribution policy that partially liquidates itself on your behalf.
Advantages
The term structure is the real advantage and it is meaningfully underappreciated. Most closed-end fund investors spend their lives hoping a discount closes. BCAT holders have a defined date on which NAV gets paid in cash. At a 3.38% discount that is an embedded gain independent of markets, and more valuably it caps how badly the discount can hurt you over a long enough horizon. Perpetual funds do not offer that.
Second, this is a legitimately diversified portfolio run by the largest asset manager in the world, not a single-strategy yield product. Fifty-five percent equity, 44% fixed income, and 4% commodities across more than 1,300 holdings means one decision gets you a complete allocation, and that convenience has real value.
Third, the risk construction is conservative in exactly the places where high-yield CEFs usually are not. If the next dislocation comes from rates or credit rather than equities, low leverage, short duration, and a Treasury and agency book mean BCAT holds up far better than the typical 19% yielder.
Disadvantages
The distribution trend is the clearest problem. Four cuts in two years, taking the monthly rate from $0.2988 to $0.2500, is a pattern, not noise. Anyone modeling BCAT as a $3.00 annual income stream should model something lower.
The 1.47% gross expense ratio is expensive for what this is. You can build a 55/44/4 allocation with index products for under ten basis points. The premium buys tactical management, and 260% turnover says the managers are earning it in activity if not necessarily in results. NAV returns of 11% to 15% in the strong years are respectable but not obviously worth 1.47% versus a passive balanced benchmark.
The valuation is only moderately attractive. Negative 3.38% against a negative 1.93% 52-week average is a modest edge, and this fund traded as wide as negative 18.4% within the past year. If you are patient, waiting for a disruption that reopens the discount is a materially better entry than today's price.
Finally, the equity concentration cuts against the diversification story. When Microsoft, Nvidia, Amazon, Apple, and Alphabet make up more than 12% of the fund, the equity sleeve is a concentrated bet on mega-cap technology dressed as broad market exposure, and tariff uncertainty lands on exactly those supply chains.
Final Thoughts
BCAT is a better fund than its 20% yield makes it look, and a worse income vehicle than that yield implies. Both are true at once.
If you are buying this for income, you will be unhappy. The distribution is not earned, it has been cut four times in two years, and it will likely be cut again. As a total return position the argument is far more defensible. You get a managed 55/44/4 balanced portfolio with low leverage, short duration, and a conservative fixed income book, purchased at a 3.38% discount, in a structure that will eventually pay NAV in cash. That last point separates BCAT from every perpetual CEF making similar claims. The discount has a resolution date.
Where I come out is this. The term structure earns BCAT a place on the watchlist, but a 3.38% discount is not the entry I want when the same fund printed negative 18.4% within the last year. The convergence math is far more compelling at a double-digit discount, and the market hands you that during a drawdown that also pressures NAV. For investors who want the position now, size it as an equity-risk allocation rather than an income sleeve and expect the monthly check to keep shrinking. For those willing to wait, set a limit near a 10% discount and let volatility do the work. The termination date is not going anywhere.
The Lead-Lag Report is provided by Lead-Lag Publishing, LLC. All opinions and views mentioned in this report constitute our judgments as of the date of writing and are subject to change at any time. Information within this material is not intended to be used as a primary basis for investment decisions and should also not be construed as advice meeting the particular investment needs of any individual investor. Trading signals produced by the Lead-Lag Report are independent of other services provided by Lead-Lag Publishing, LLC or its affiliates, and positioning of accounts under their management may differ. Please remember that investing involves risk, including loss of principal, and past performance may not be indicative of future results. Lead-Lag Publishing, LLC, its members, officers, directors and employees expressly disclaim all liability in respect to actions taken based on any or all of the information on this writing.