Corporate Bonds Yield 5.82%. Only 0.88 of It Pays for Credit Risk.
Investment-grade bonds yield 5.82%, but only 0.88 points is credit spread. Bond buyers are paid mostly for rates, not corporate risk.


Today’s Lead-Lag Report post is sponsored by TappAlpha

The Stock-Bond See-Saw Is Breaking. Where Does Income Come From Now? Live roundtable, Tuesday, November 3, 1:00 to 2:00 PM ET
The Fed hiked in September for the first time since 2023, and the 10-year Treasury has pushed above 5%. Bonds pay real income again, but there's a catch: when rates and inflation drive markets, stocks and bonds have tended to fall together, as they did in 2022. That leaves advisors with a harder question than how much yield to chase: where should client income come from when the bond sleeve may not cushion a stock sell-off?
Join Michael A. Gayed, CFA, publisher of The Lead-Lag Report, Si Katara, Founder and CEO of TappAlpha, and three practicing RIAs, Paul Schatz of Heritage Capital, Ricky Biel of Favor Wealth and Christian Ravsten of Foxstone Financial, for a 60-minute roundtable on rates, bonds and option-based income. No slides, just a frank conversation with time for audience questions.
On the agenda:
- Why the stock-bond relationship tends to change at higher yields, and what it means for 60/40 portfolios
- How to weigh 5% bond yields against equity income and option-based strategies
- How three RIA practices are explaining income trade-offs to clients right now
Registration is free. 1.0 CFP CE credit hour requested; CFP Board approval is pending. Register free here.
DISCLAIMER – PLEASE READ: Sponsored by TappAlpha. Views expressed are those of the speakers and are not investment advice. This is sponsored advertising content for which Lead-Lag Publishing, LLC has been paid a fee. The information provided in the link is solely the creation of TappAlpha. Lead-Lag Publishing, LLC does not guarantee the accuracy or completeness of the information provided in the link or make any representation as to its quality, and expressly disclaims any responsibility for action taken in connection with the information provided in the link. This message is educational only and is not an offer to sell or a solicitation of an offer to buy any security.
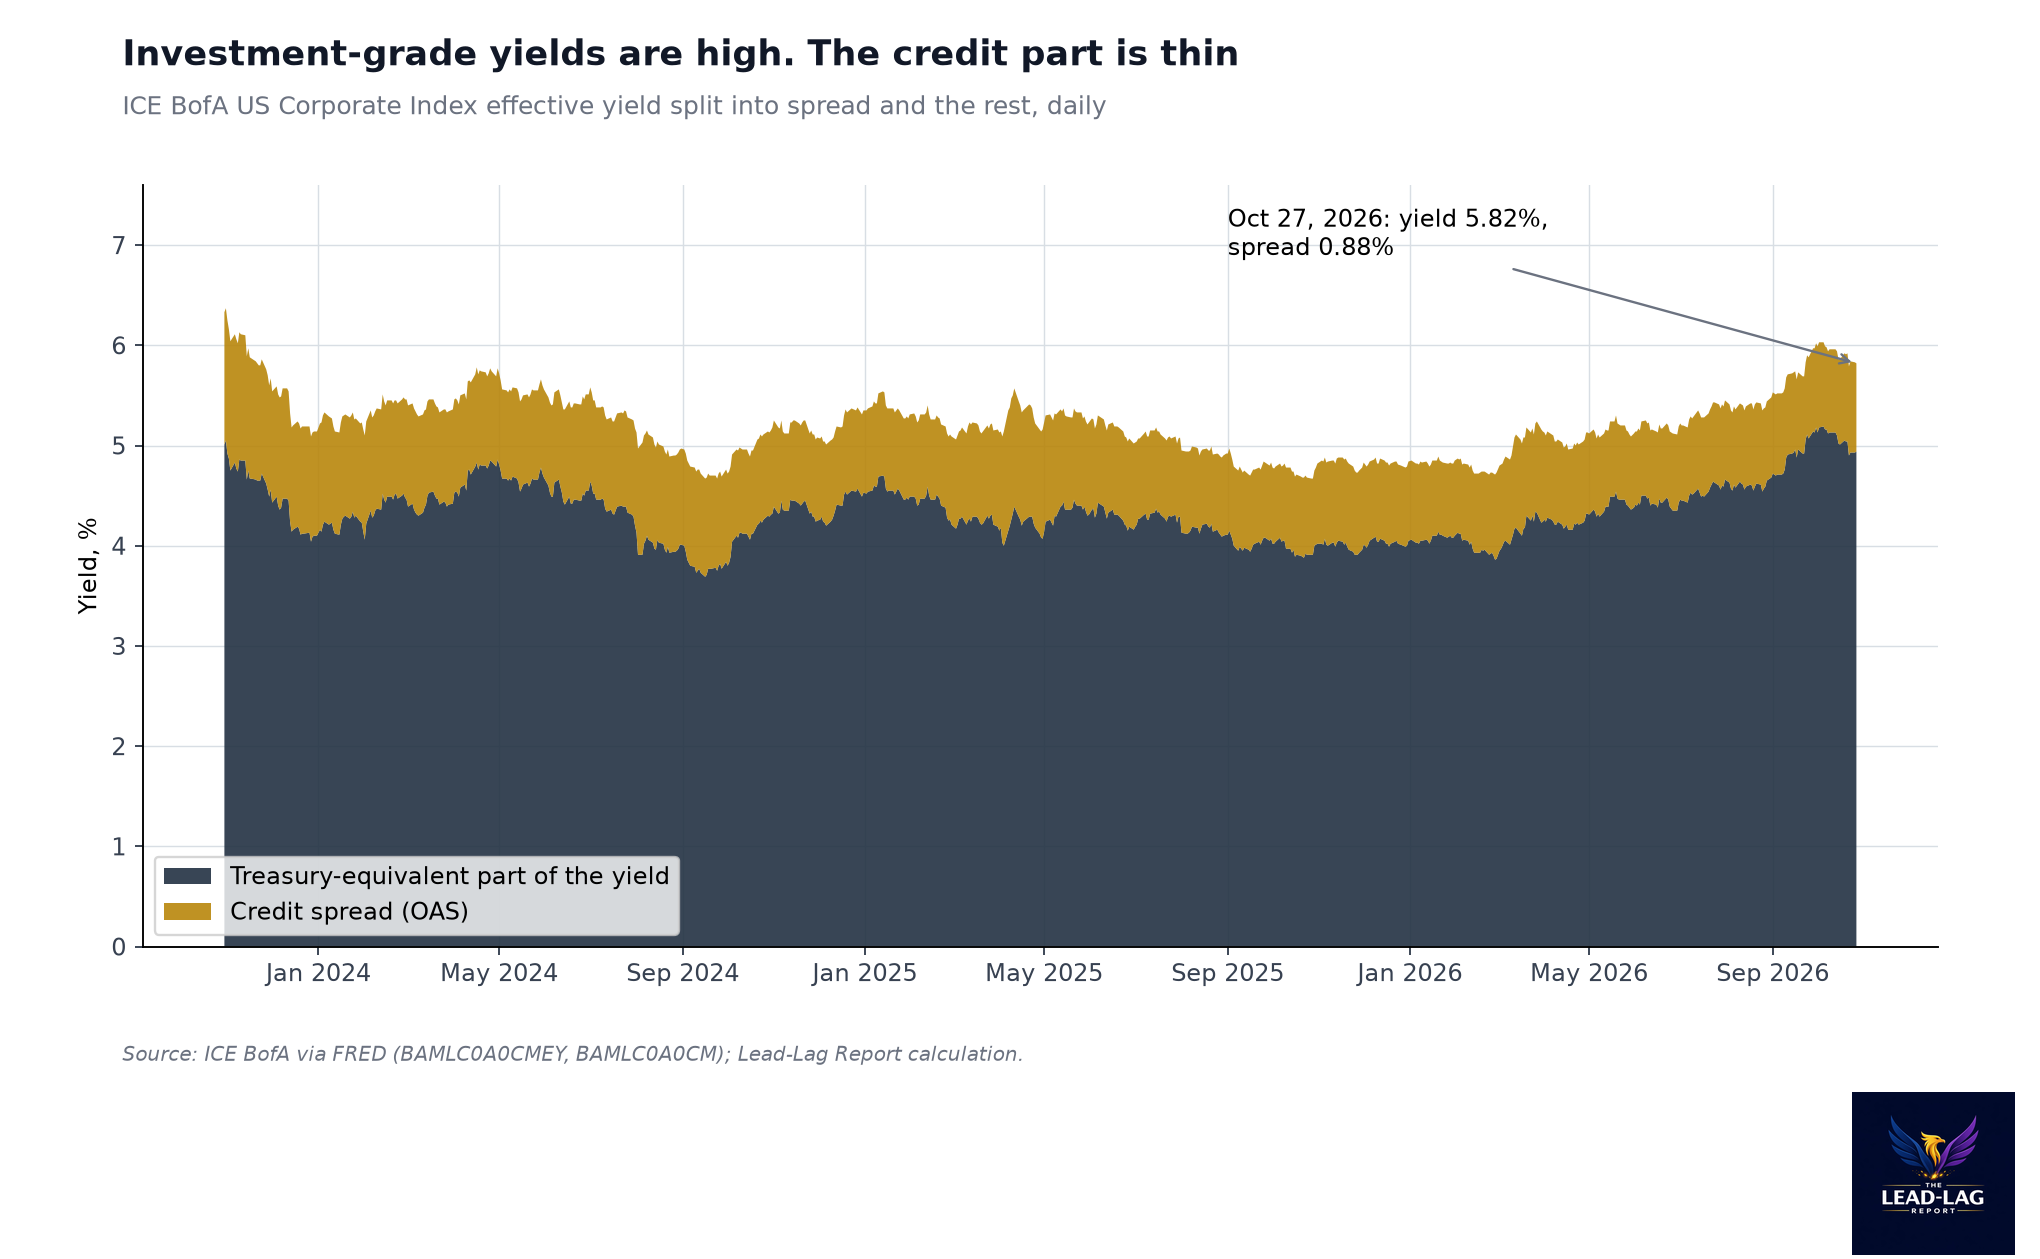
The ICE BofA US Corporate Index yields 5.82%, near the top of its three-year range, but only 0.88 points of that is credit spread. Bond buyers are being paid mostly for owning rates, and very little for owning corporate risk.
MICHAEL A. GAYED, CFA
Key Highlights
- The ICE BofA US Corporate Index had an effective yield of 5.82% on October 27, 2026, higher than on 94.6% of days since October 30, 2023.1
- Its option-adjusted spread was 0.88%, so the credit spread was about 15.1% of the total yield.1, 2
- That share hit 13.2% on September 23, 2026, the lowest in the series, against 22.4% on April 7, 2025.1, 2
- In 1 to 3 year investment-grade bonds, the spread is 0.58 of a 5.28% yield, about 11%.3, 4
A good yield with a thin cushion
Investment-grade corporate bonds look generous right now. The ICE BofA US Corporate Index had an effective yield of 5.82% on October 27.1 That is higher than on 94.6% of trading days since October 30, 2023, the start of the daily history FRED publishes for these indexes.1 On January 2, 2026, the same index yielded 4.85%.1
But a yield is two things stacked together. One part is what you would earn on Treasuries of similar maturity. The other is the spread, the extra amount lenders demand for the risk that a company does not pay. On October 27, the spread on that index was 0.88%.2 Subtract it and roughly 4.94 points of the 5.82% yield is the Treasury-equivalent part.1, 2
So about 15.1% of what an investment-grade corporate bond pays today is compensation for credit risk.1, 2 The other 85% is compensation for owning interest rates.
How thin is thin
That share moves around. On April 7, 2025, during the tariff shock, the spread was 22.4% of the yield, the highest in the series.1, 2 On September 23, 2026, it fell to 13.2%, the lowest.1, 2 Today's 15.1% is closer to the floor than the ceiling: it has been lower on only about 17% of days in the series.1, 2
Put it next to the other two corners of the bond market and the pattern is consistent. In high yield, the spread is 3.18 of a 7.96% yield, about 39.9%.5, 6 In short investment-grade bonds with 1 to 3 years to maturity, it is 0.58 of a 5.28% yield, about 11.0%.3, 4
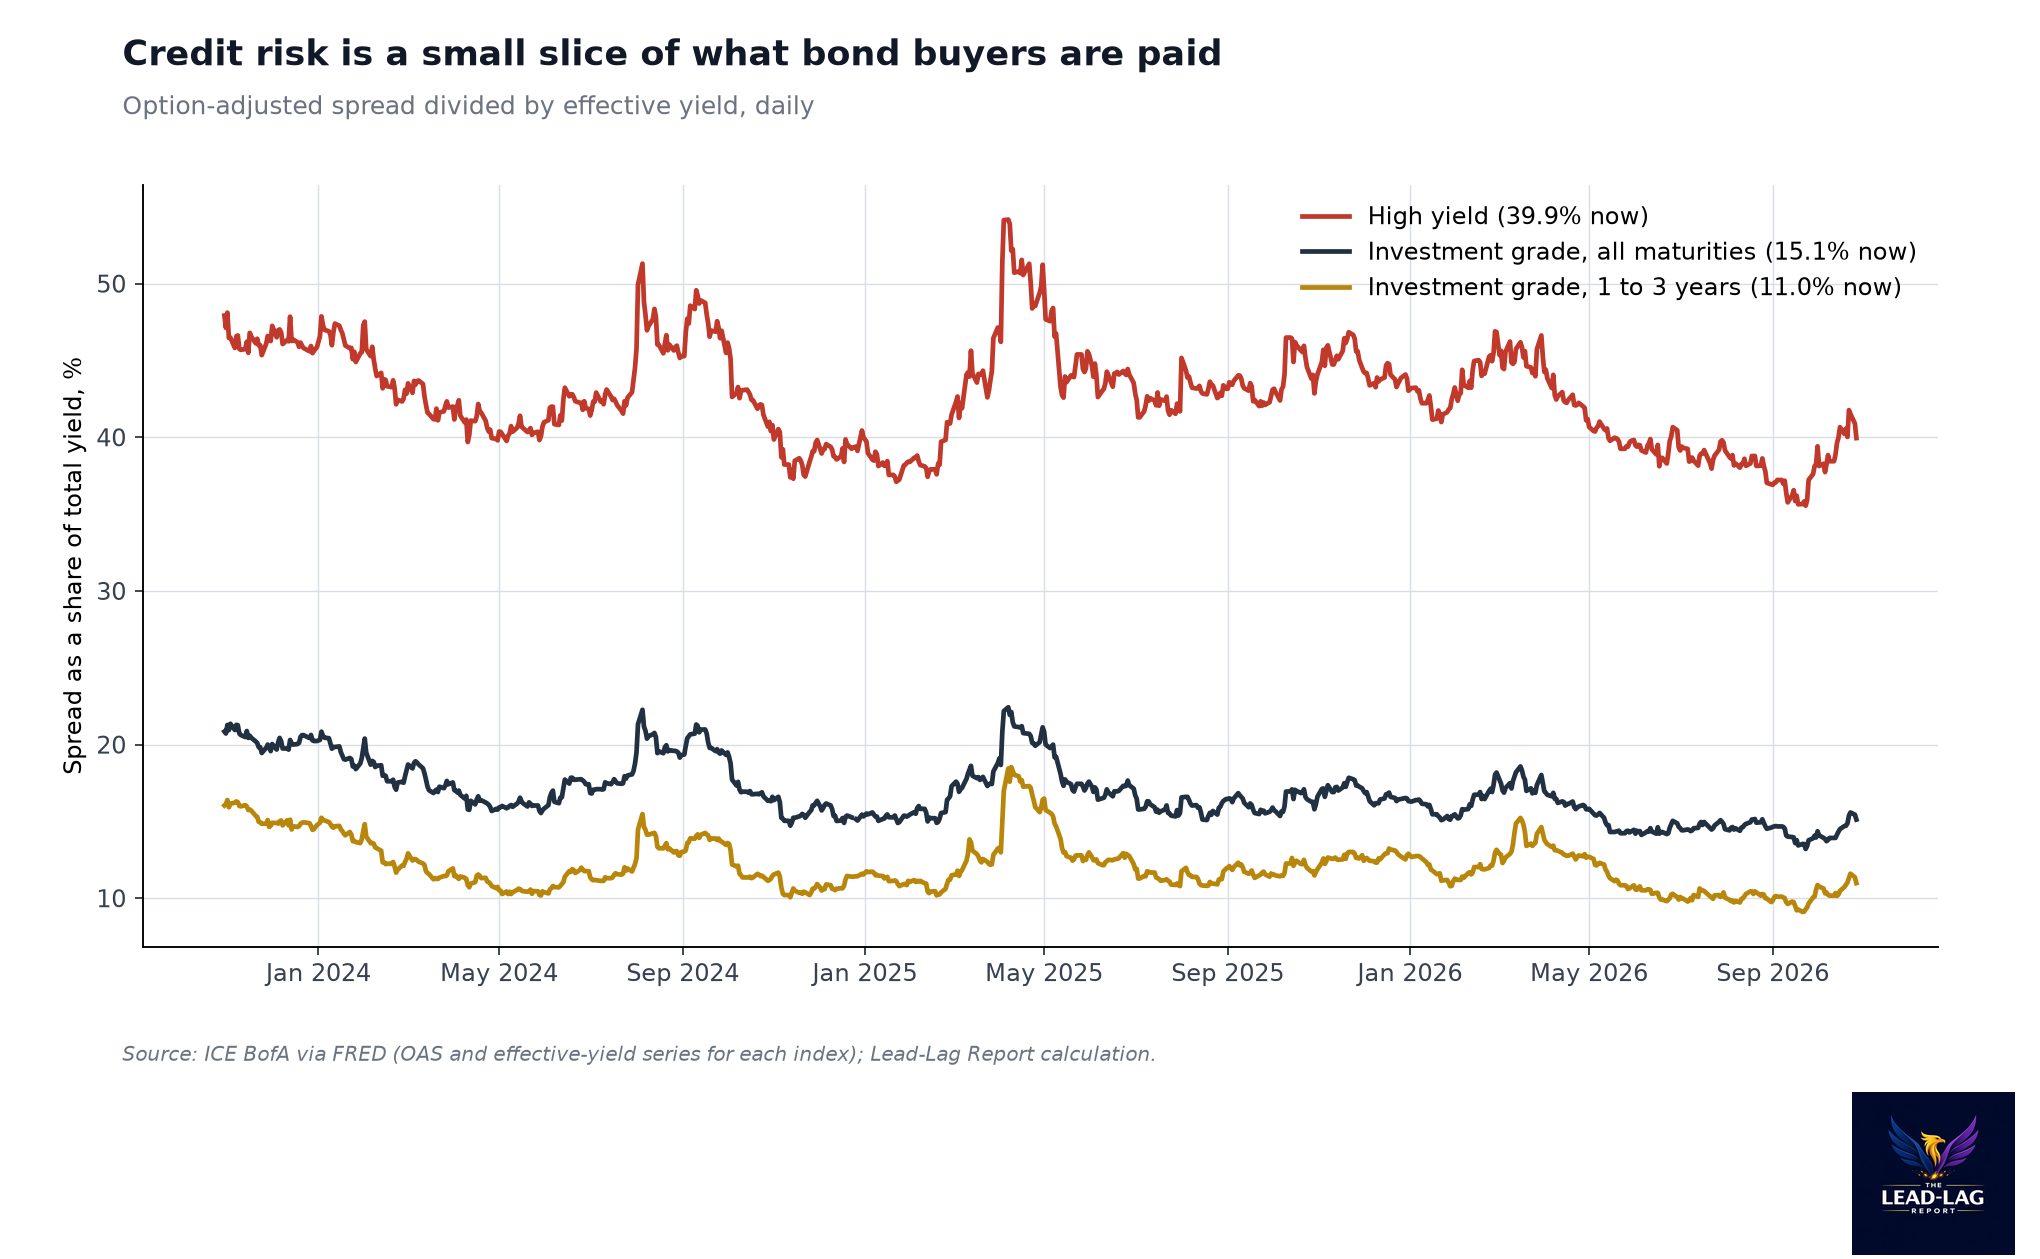
The short end is where the spread is thinnest relative to yield. That makes sense. With 2-year Treasury yields at 4.68% on October 26, a short corporate bond earns most of its income from the Treasury curve itself.7
Same yield as 2023, less pay for the risk
Here is the comparison that matters. On October 31, 2023, the index yielded 6.37% with a spread of 1.32%.1, 2 Today it yields 5.82% with a spread of 0.88%.1, 2 The yield is lower by 0.55 points. The spread is lower by 0.44 points, down by a third.
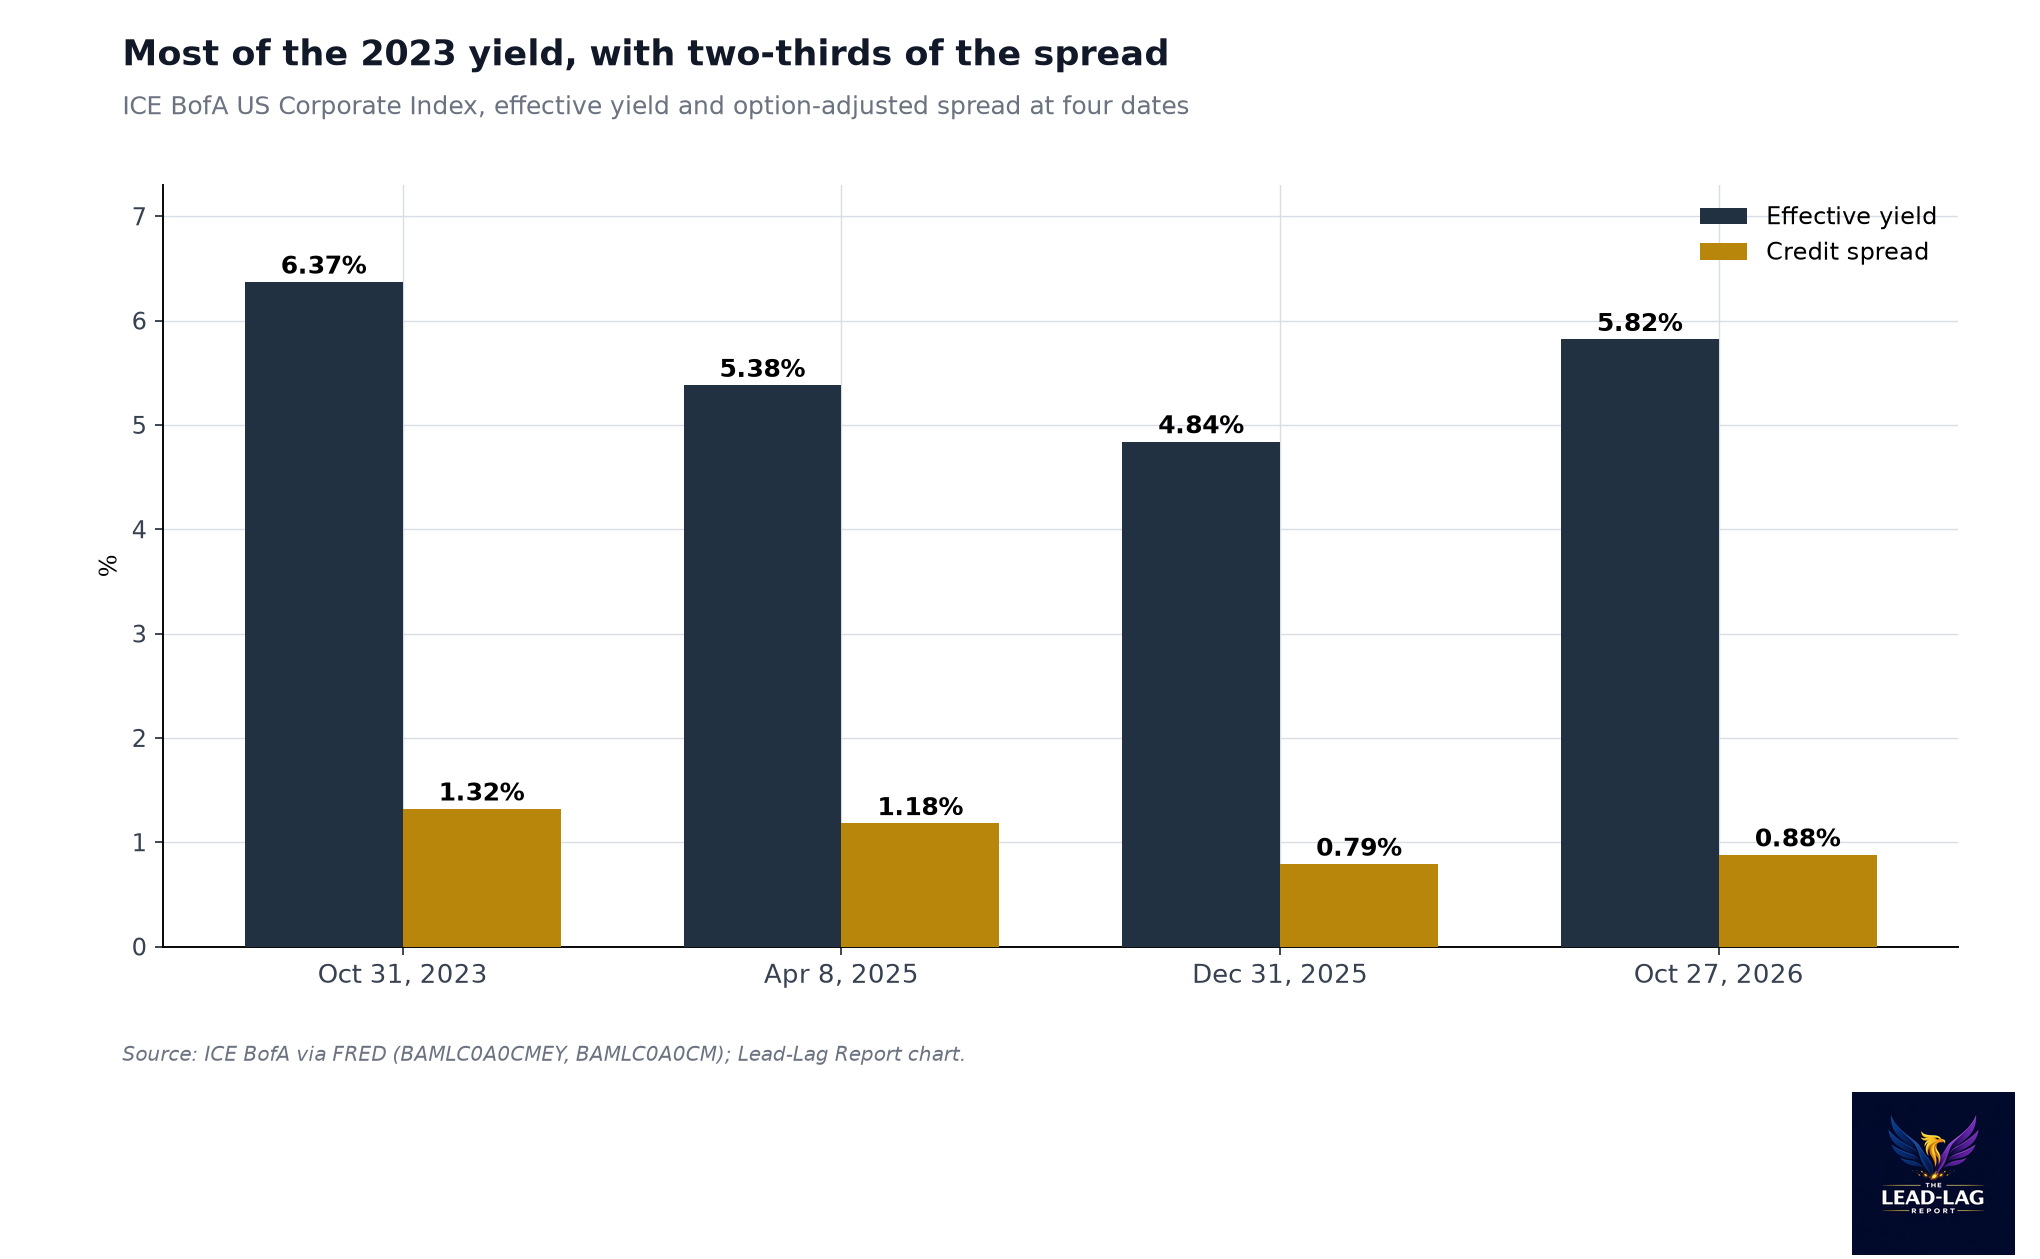
In other words, most of the yield is still there, but the part that pays you for credit risk has shrunk. Investors are taking close to the same total income with a much smaller margin for error on the corporate side.
That is not a prediction of defaults. Spreads are tight because investors believe investment-grade balance sheets are in good shape, and on most measures that belief is reasonable. The point is narrower. When spreads are this thin, credit is not where the return is coming from. Rates are.
What that means for risk
If most of the yield comes from the rate part, then most of the risk does too. A bond that pays 0.88 points of spread has very little cushion if rates move against it. A simple illustration: a bond with a duration of six years loses about 0.9% in price for a 0.15 point rise in yields, roughly a year of spread income at today's level.
That is the trade-off investors are making whether they think about it or not. A corporate bond fund that tracks the broad index is mostly a rate position with a modest credit overlay. That can be exactly what someone wants. It is just worth knowing which risk you are paid for.
The 10-year Treasury yield was 5.00% on October 26.8 The rate exposure in high-grade credit has been anything but quiet. In 2026 alone, the index yield has moved from 4.85% in early January to a high of 6.03% on October 2.1
The quality ladder inside investment grade
Spreads also compress as you move up in quality, and the gap is small. The AAA segment of the corporate index carried a spread of 0.42% on October 27, while BBB, the lowest investment-grade tier, carried 1.09% on a 6.03% yield.9, 10 Even at the bottom of investment grade, the spread is only about 18% of the total yield.10
That is a narrow band for the gap between the best and the weakest high-grade credits. It says the market is not demanding much extra for stepping down the ladder. In junk, the opposite is happening at the very bottom, where CCC spreads widened from 10.26% on August 28 to 13.21% on October 27. Investment grade has not caught any of that.11
Why I split a yield into two pieces
I think most investors look at a yield and stop there. A bond fund yields 5.8%, and that sounds like enough. It might be. But the number alone does not tell you what you are being paid for, and that matters more than the number.
When I look at a corporate bond yield, I ask two separate questions. First, am I comfortable with the rate exposure underneath it? Second, is the spread on top fair pay for the credit risk? Today the first question is doing almost all of the work. The second is almost an afterthought.1, 2
That does not make high-grade credit a bad place to be. I would rather own a 5.8% yield with a thin spread than a 4.8% yield with a thin spread, and that was the choice at the start of the year.1 It does mean that the decision you are really making is a decision about rates.
Think about what that implies for how a bond portfolio behaves. If rates fall, high-grade credit does well, mostly because of the rate part. If rates rise, it does poorly, for the same reason. The spread does not offer much of a buffer in either direction because there is not much of it.
The question to ask of any bond fund
Here is the simple test I would run on any fixed income holding today. Take its yield. Ask how much of it comes from the Treasury curve and how much from the credit spread. Then ask which of the two you meant to own. For the broad investment-grade index, about 85% comes from the curve.1, 2 For high yield, about 40% is spread.5, 6 For short investment-grade bonds, the spread share is the smallest of the three, about 11%.3, 4
None of those answers is wrong. They describe different jobs. The mistake is owning one while believing you own another. Plenty of investors think of corporate bonds as a credit bet. At 0.88 points of spread, it is mainly a rate bet.2
That matters most for people who own corporate bonds next to Treasuries and call it diversification. If 85% of the corporate yield is the same rate exposure the Treasuries already carry, the two positions overlap more than the labels suggest.1, 2
Where I could be wrong
I could be wrong if spreads tighten further from here. They have been lower this year: the index spread was 0.73% on January 22, 2026.2 If balance sheets keep improving and demand for high-grade paper stays strong, the credit slice could shrink again without anything breaking.
I could also be wrong about the direction of rates. If yields fall, the thin spread becomes irrelevant, and the investor who locked in a 5.8% yield looks very smart.1 My point is not that rates must rise. It is that you should own the rate exposure on purpose, not by accident.
Short maturities are one way investors manage that. A 1 to 3 year corporate bond still yields 5.28%, and its price moves far less when rates change.4 The trade-off is the thinnest spread share of the three markets in this piece, about 11%.3, 4 You give up credit income to cut rate risk. Whether that trade is right depends on what else you own.
The case against this read
A thin spread is not automatically a warning. Spreads can stay tight for years when corporate balance sheets are strong. The ratio I use here also rises and falls with Treasury yields: when yields go up, the same spread becomes a smaller share of the total. Part of the drop since 2023 is simply higher base rates.
That is true, and it is the point. With base rates this high, the Treasury curve is doing most of the work. The question for an investor is not whether 0.88 is too tight. It is whether they want a position whose main driver is interest rates.
What to watch
Three markers would change the picture. A move in the index spread back above 1.18%, the April 8, 2025 level, would put credit risk back into the price.2 A drop in the index yield back toward 4.85%, where 2026 began, would show the rate component giving way.1 And a jump in the share of yield coming from spread, toward the 22% seen in April 2025, would signal that investors are again demanding real pay for corporate risk.1, 2
Conclusion
Investment-grade yields are attractive by the standards of the last three years. The credit component is not. About 85 cents of every dollar of yield comes from the rate side. For bond investors, this is a rate market wearing a credit label. Few understand this.
Notes
- [1] ICE BofA US Corporate Index Effective Yield (BAMLC0A0CMEY), daily, via FRED: fred.stlouisfed.org/series/BAMLC0A0CMEY . Values used: 5.82% (Oct 27, 2026), 4.85% (Jan 2, 2026), 6.03% (Oct 2, 2026), 6.37% (Oct 31, 2023). Percentile and the spread-share figures are Lead-Lag Report calculations from notes 1 and 2.
- [2] ICE BofA US Corporate Index Option-Adjusted Spread (BAMLC0A0CM), daily, via FRED: fred.stlouisfed.org/series/BAMLC0A0CM . Values used: 0.88% (Oct 27, 2026), 1.32% (Oct 31, 2023), 1.18% (Apr 8, 2025).
- [3] ICE BofA 1-3 Year US Corporate Index Option-Adjusted Spread (BAMLC1A0C13Y), via FRED: fred.stlouisfed.org/series/BAMLC1A0C13Y . 0.58% on Oct 27, 2026.
- [4] ICE BofA 1-3 Year US Corporate Index Effective Yield (BAMLC1A0C13YEY), via FRED: fred.stlouisfed.org/series/BAMLC1A0C13YEY . 5.28% on Oct 27, 2026.
- [5] ICE BofA US High Yield Index Option-Adjusted Spread (BAMLH0A0HYM2), via FRED: fred.stlouisfed.org/series/BAMLH0A0HYM2 . 3.18% on Oct 27, 2026.
- [6] ICE BofA US High Yield Index Effective Yield (BAMLH0A0HYM2EY), via FRED: fred.stlouisfed.org/series/BAMLH0A0HYM2EY . 7.96% on Oct 27, 2026.
- [7] Market Yield on U.S. Treasury Securities at 2-Year Constant Maturity (DGS2), via FRED: fred.stlouisfed.org/series/DGS2 . 4.68% on Oct 26, 2026.
- [8] Market Yield on U.S. Treasury Securities at 10-Year Constant Maturity (DGS10), via FRED: fred.stlouisfed.org/series/DGS10 . 5.00% on Oct 26, 2026.
- [9] ICE BofA AAA US Corporate Index Option-Adjusted Spread (BAMLC0A1CAAA), via FRED: fred.stlouisfed.org/series/BAMLC0A1CAAA . 0.42% on Oct 27, 2026.
- [10] ICE BofA BBB US Corporate Index Option-Adjusted Spread (BAMLC0A4CBBB) and Effective Yield (BAMLC0A4CBBBEY), via FRED: fred.stlouisfed.org/series/BAMLC0A4CBBB and fred.stlouisfed.org/series/BAMLC0A4CBBBEY . 1.09% and 6.03% on Oct 27, 2026.
- [11] ICE BofA CCC & Lower US High Yield Index Option-Adjusted Spread (BAMLH0A3HYC), via FRED: fred.stlouisfed.org/series/BAMLH0A3HYC . 13.21% on Oct 27, 2026, against 10.26% on Aug 28, 2026.