AMLP Pays 7.6% And Has Raised Its Payout 45% Since 2022. The Tax Bill Comes First
AMLP yields 7.6% on a payout that grew from $0.71 to $1.03 a quarter since 2022. The structure, the tax drag and the concentration explained.


Today’s Lead-Lag Report post is sponsored by TappAlpha

The Stock-Bond See-Saw Is Breaking. Where Does Income Come From Now? Live roundtable, Tuesday, November 3, 1:00 to 2:00 PM ET
The Fed hiked in September for the first time since 2023, and the 10-year Treasury has pushed above 5%. Bonds pay real income again, but there's a catch: when rates and inflation drive markets, stocks and bonds have tended to fall together, as they did in 2022. That leaves advisors with a harder question than how much yield to chase: where should client income come from when the bond sleeve may not cushion a stock sell-off?
Join Michael A. Gayed, CFA, publisher of The Lead-Lag Report, Si Katara, Founder and CEO of TappAlpha, and three practicing RIAs, Paul Schatz of Heritage Capital, Ricky Biel of Favor Wealth and Christian Ravsten of Foxstone Financial, for a 60-minute roundtable on rates, bonds and option-based income. No slides, just a frank conversation with time for audience questions.
On the agenda:
- Why the stock-bond relationship tends to change at higher yields, and what it means for 60/40 portfolios
- How to weigh 5% bond yields against equity income and option-based strategies
- How three RIA practices are explaining income trade-offs to clients right now
Registration is free. 1.0 CFP CE credit hour requested; CFP Board approval is pending. Register free here.
DISCLAIMER – PLEASE READ: Sponsored by TappAlpha. Views expressed are those of the speakers and are not investment advice. This is sponsored advertising content for which Lead-Lag Publishing, LLC has been paid a fee. The information provided in the link is solely the creation of TappAlpha. Lead-Lag Publishing, LLC does not guarantee the accuracy or completeness of the information provided in the link or make any representation as to its quality, and expressly disclaims any responsibility for action taken in connection with the information provided in the link. This message is educational only and is not an offer to sell or a solicitation of an offer to buy any security.
HIGH YIELD SPOTLIGHT
AMLP Pays 7.6% And Has Raised Its Payout 45% Since 2022. The Tax Bill Comes First
The toll roads of the energy trade, in a corporate wrapper that pays tax before you do.
MICHAEL A. GAYED, CFA | OCT 31, 2026
Key Highlights
- Yield: 7.61% on the $1.03 quarterly payment ($4.12 annualized) at the $54.12 price on Oct 30, per Perplexity Finance1, and a 7.55% trailing-twelve-month yield as of Oct 29, per ALPS2
- Structure: Pays corporate income tax at the fund level, shown as a 0.17% income tax expense inside a 1.01% total expense ratio, per the ALPS fact sheet3
- Concentration: Six names each hold 12.8% to 13.5% of assets, and the top 10 are 98.78% of the portfolio, per the Yahoo Finance holdings page4
- Return: Total return of 127.9% since Jan 2022 versus 179.6% for XLE and 71.5% for SPY, with price alone up 56.2% to $52.60 through Oct 20, per Yahoo Finance price history5 and my calculations
- Valuation and size: Price of $52.60 against a closing NAV of $52.51 on Oct 20, a 0.17% premium, with $12.64 billion in net assets, per ALPS fact sheet3 and Schwab6
Every week, we'll profile a high yield investment fund that typically offers an annualized distribution of 6-10% or more. With the S&P 500 yielding less than 2%, many investors find it difficult to achieve the portfolio income necessary to meet their needs and goals. This report is designed to help address those concerns.
Oil is back above $100 a barrel, with WTI settling at $102.00 on Oct 29, per Reuters7, and the energy sector returned 60.9% in the year through Oct 20. If you wanted that trade, you could have bought it in a single line. What I want to look at today is the other energy trade, the one that pays you whether the barrel is at $60 or $110. It sits in the pipelines that move the product, the terminals that store it, and the compression stations that keep gas flowing to power plants. That trade yields about 7.6%, and the most widely held fund for it is the Alerian MLP ETF (AMLP).
The timing is useful. The 10-year Treasury yielded 4.98% on Oct 29, per the Treasury Department8, which makes any yield below 6% hard to defend. AMLP clears that bar. Over the same year that energy stocks returned 60.9% in total, AMLP returned 22.8%, a number that sounds disappointing until you remember what you were not exposed to: the swings of the commodity itself. I rebuilt its record from daily closes. The answer is more interesting than the yield, and it comes with one structural feature that most buyers never read about.
Fund Background
AMLP began trading on Aug 25, 2010, and ALPS Advisors manages it. It tracks the Alerian MLP Infrastructure Index, holds $12.64 billion in net assets, and pays quarterly, per the ALPS fact sheet3 and Schwab6. Its total operating expenses are 1.01%, which breaks down as an 0.84% management fee and a 0.17% line labeled income tax expense, per the ALPS fact sheet3. That second line is the key to the fund.
Most MLP exposure comes with a Schedule K-1 and the tax complexity that goes with it. An ETF that holds more than a quarter of its assets in partnerships cannot qualify as a regulated investment company, so AMLP is taxed as a corporation. It pays federal and state income tax on the income it earns before it passes anything to you, and it accrues a liability for taxes on gains it has not yet realized. You receive a simple 1099, and that is the trade: you buy simplicity with a tax drag you can see in the expense ratio and a second, larger drag you cannot see directly, which lives in the net asset value.
The shares trade at about their value. The Oct 20 close was $52.60 against a closing NAV of $52.51, per Yahoo Finance price history5 and Schwab6, a 0.17% premium. That is tight for a fund holding illiquid partnership units, and it is a sign that arbitrage works well here.
Portfolio Composition
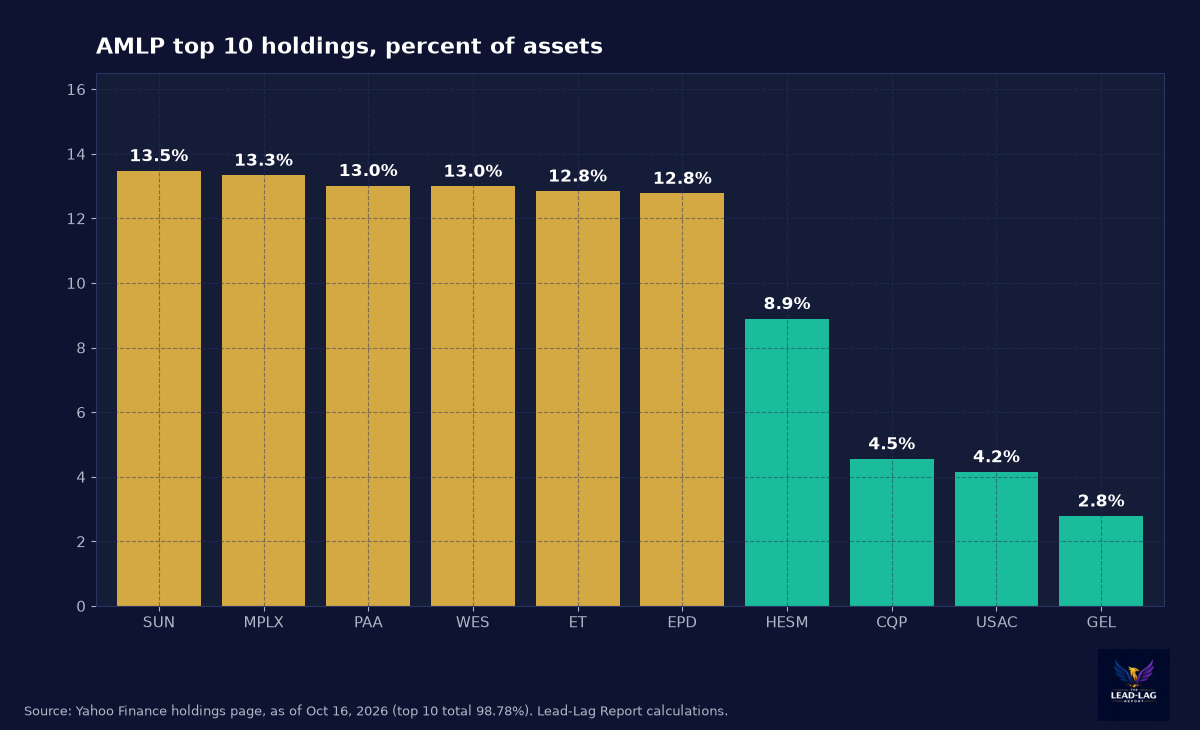
AMLP is one of the most concentrated large ETFs you can buy. As of Oct 16, Sunoco was 13.47% of assets, MPLX 13.33%, Plains All American 13.01%, Western Midstream 12.99%, Energy Transfer 12.84% and Enterprise Products Partners 12.77%, per the Yahoo Finance holdings page4. Those six alone are about 78% of the fund. Add Hess Midstream at 8.89%, Cheniere Energy Partners at 4.55%, USA Compression Partners at 4.15% and Genesis Energy at 2.78%, and you reach 98.78% in ten positions.
The holding count depends on whom you ask. The ALPS shareholder report9 counted 13 portfolio holdings as of May 31, 2026, with the top ten at 93.73%, while Schwab6 lists 22. I would not build an investment case on the count. I would build it on the weights, which agree across sources to within a point or two. This is a fund with about a dozen real positions, and the largest six move together with oil and gas volumes and with the sentiment toward the sector.
What the companies do matters more than who they are. Plains and Enterprise move crude and natural gas liquids. Western Midstream and MPLX gather and process gas. Cheniere Energy Partners owns the Sabine Pass export terminal. Sunoco distributes fuel. Hess Midstream and USA Compression serve producers. Almost all of it is paid by volume and fee, not by the price of the product. That is why the fund behaved so differently from the energy sector over the last year.
Historical Performance
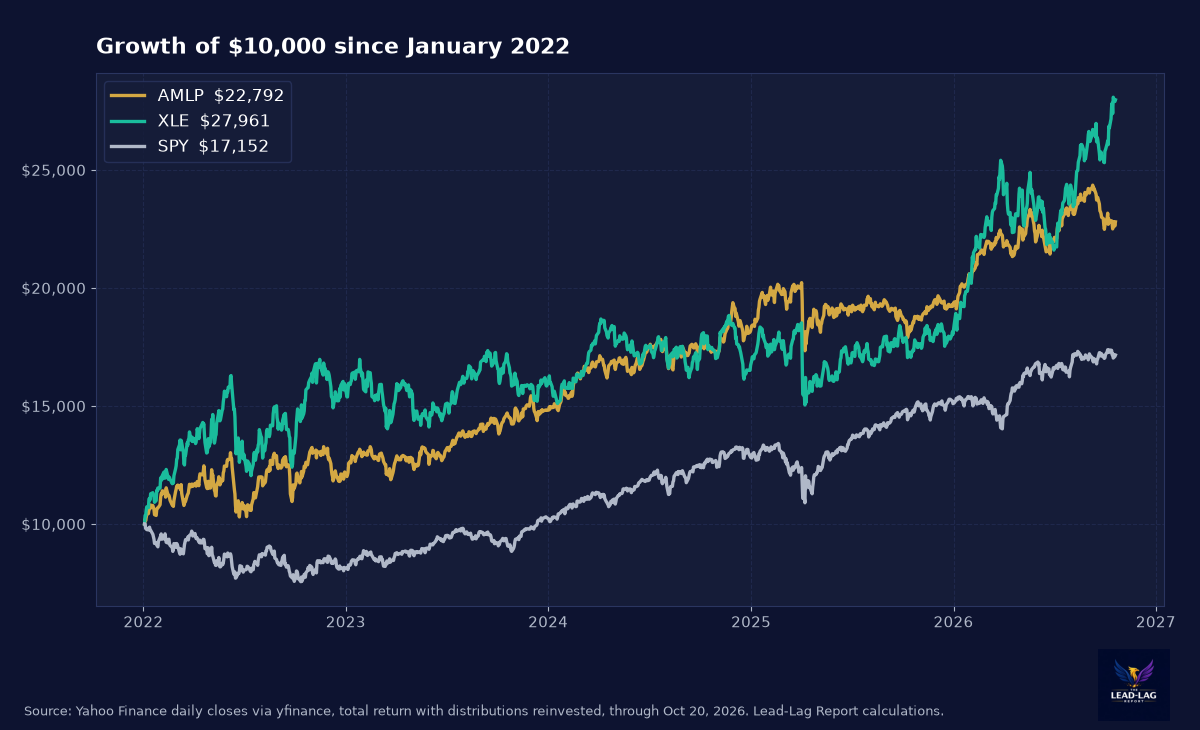
I started the clock on Jan 3, 2022, the first trading day of that year. Through Oct 20, AMLP returned 127.9% with distributions reinvested, per Yahoo Finance price history5 and my calculations. That is $10,000 turning into about $22,792. The Energy Select Sector SPDR (XLE) returned 179.6%, or $27,961, and SPY returned 71.5%, or $17,152. So AMLP beat the broad market by 56 points and trailed the energy sector by 52 points.
Over shorter windows the gap with energy widens. In the past year AMLP returned 22.8%, XLE 60.9% and SPY 15.8%. Year to date it is 18.5%, 55.0% and 13.7%. And over the last three months AMLP lost 1.6% while XLE gained 18.0%. Midstream has not benefited from the oil spike the way producers have, and its units have stalled for three months while producers kept running. That is the cost of being a toll collector: you do not get the windfall.
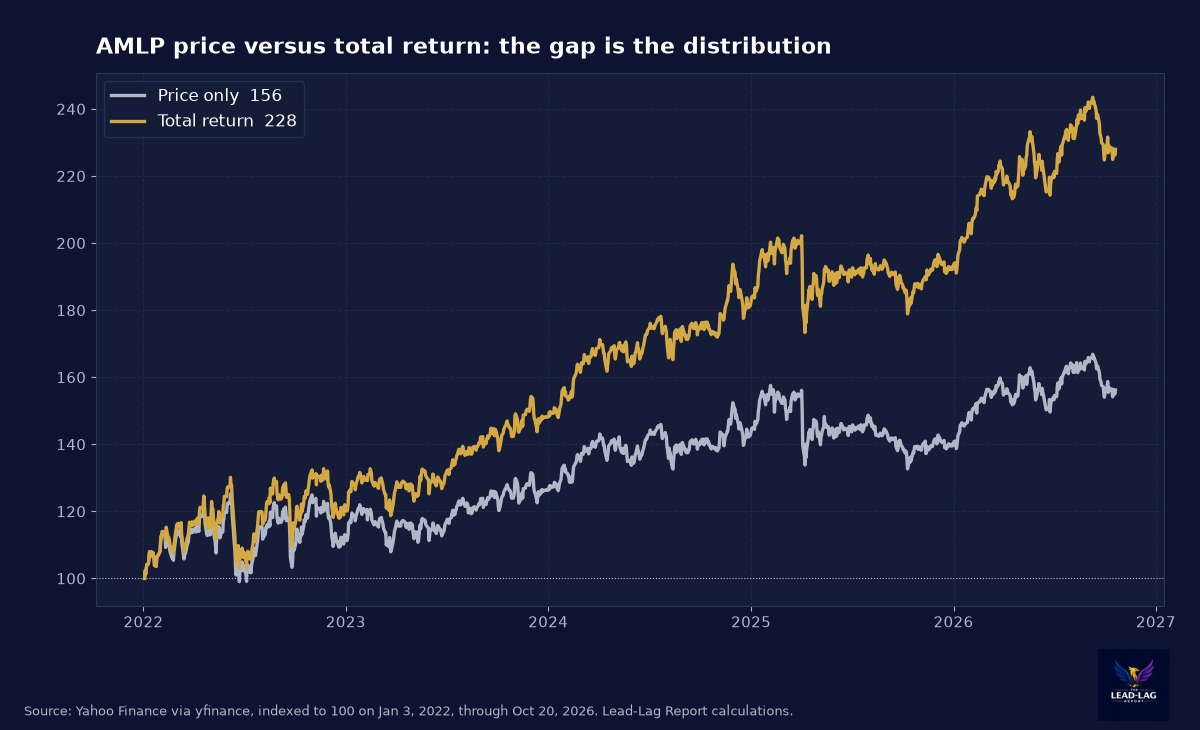
The price-only line tells the more important story for income investors. AMLP closed at $33.68 on its first trading day of 2022 and at $52.60 on Oct 20, a price gain of 56.2%. The total return of 127.9% is therefore about 72 points more than price alone. Distributions are doing the heavy lifting, and the unit price has also grown, which is the opposite of what happens at many yield products.
Volatility
The fund's annualized volatility since January 2022 was 18.8%, against 25.5% for XLE and 17.3% for SPY. So AMLP behaves roughly like the broad market in terms of daily swings and about a quarter less volatile than energy producers. Its worst drawdown, measured from a prior peak on a total return basis, was 20.9% in June 2022, against 26.0% for XLE. That is a real drawdown for a fund with a 7.6% yield, so treat it as an equity, because it is one. The fund can fall 20% from a peak when oil drops sharply or rates rise quickly, and a 10-year yield near 5% is a reminder of the second risk.
Macro Environment
Three forces drive the thesis. The first is oil. WTI settled at $102.00 on Oct 29 and Brent at $114.88, per Reuters7, as hopes for US-Iran talks offset supply fears. High prices support producer activity, which feeds midstream volumes. A sharp drop does not hurt the fee model right away, but it eventually slows drilling, and volumes follow.
The second is demand for infrastructure. Natural gas pipelines, export terminals and compression capacity are all tied to power generation and LNG, and they are constrained by permitting. That is a rule-driven story, and it is one I have followed in the Free Markets Report, where FERC is proposing to let LNG plants skip case-by-case approvals. Permitting speed is a supply-side lever for midstream assets, because it determines how quickly competitors can build.
The third is rates, and it is the one that worries me. At a 4.98% 10-year, a 7.6% yield is about a 2.6 point spread over Treasuries. That is decent, not generous. If yields keep climbing, the spread narrows, and the units have to fall to restore it, or distributions have to grow faster. I rate the macro backdrop as supportive for earnings and neutral for the unit price. For investors who also want a hedge against energy bottlenecks, it can make sense. For those looking for inflation protection without equity risk, it is not that.
Distribution Policy
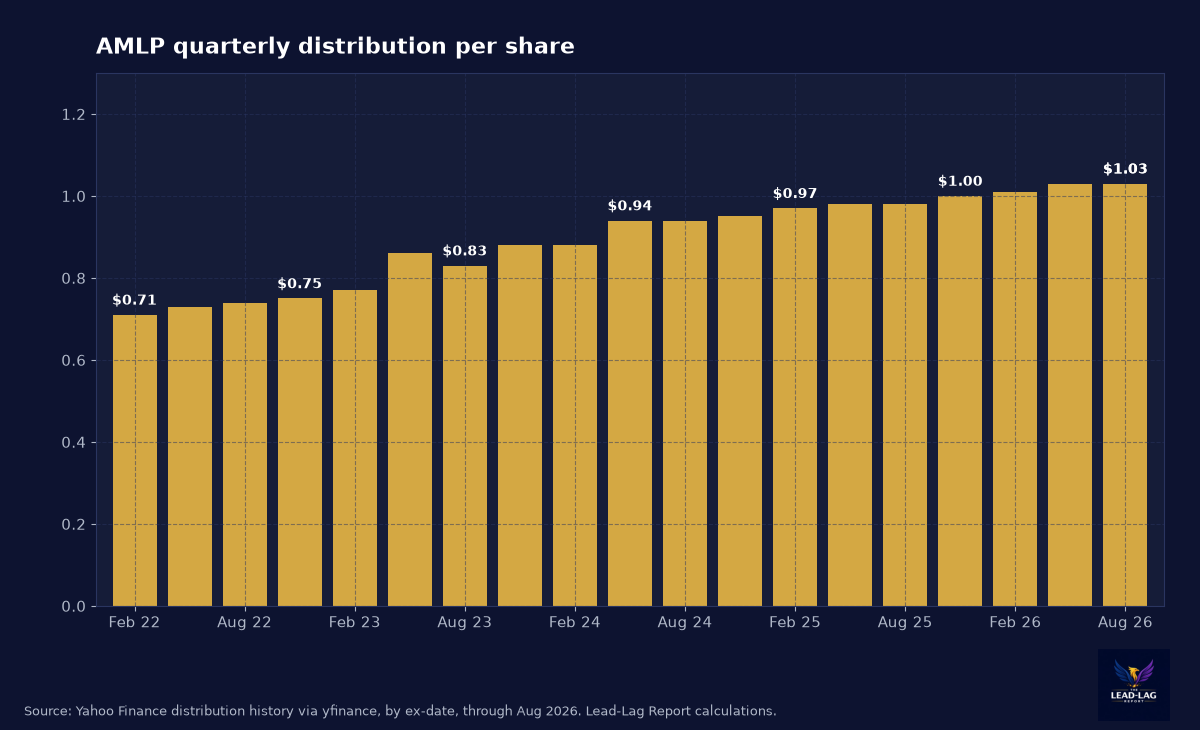
AMLP pays quarterly. The last four payments, per Yahoo Finance price history5, were $1.00 in November 2025, $1.01 in February, $1.03 in May and $1.03 in August. Annualized, that is $4.12 a share, or 7.83% on the $52.60 Oct 20 close and 7.61% on the $54.12 price on Oct 30. The trailing-twelve-month sum is $4.07, which is 7.74% on price. Schwab6 shows a distribution yield of 7.84%, and the numbers agree to within a few basis points.
The history is the best part. Since February 2022 the fund has made 19 quarterly payments. The first was $0.71, and the latest is $1.03, a 45.1% increase over four and a half years. There has been exactly one step down, from $0.86 in May 2023 to $0.83 in August 2023, and the payment was back to $0.88 by November. A distribution that grows through an energy cycle, a rate shock and a market drawdown is what you want from a toll collector.
One caution. The distribution in an MLP fund is not the same as the cash flow its holdings pay, because the fund pays taxes first. The 0.17% income tax line in the expense ratio is small today. In a sharp upturn, the deferred tax liability inside the NAV can grow, and a sudden drop in unit prices unwinds it, which cushions the fall. This is a feature of the structure, not something I can model from public data, so I would rather say so than guess.
Advantages
The distribution has grown. A 45% increase since 2022, with one tiny step down, is a record few income funds can match, and it came with a rising unit price instead of NAV erosion.
The structure is simple at tax time. You receive a 1099 and not a K-1, so you can hold it in an IRA without the unrelated business income concerns that come with direct MLP ownership.
The fee model insulates the fund from commodity prices. In a year when the energy sector returned 60.9%, AMLP returned 22.8% with 26% less volatility than that sector, and the gap in volatility is the point of owning the toll road.
Disadvantages
You pay for the structure. A 1.01% expense ratio is high for an index fund, and 0.17 points of it is a tax bill paid on your behalf. There is also the deferred tax liability inside the NAV, which dulls upside in good years and softens downside in bad ones.
The concentration is severe. With six names near 13% each, one regulatory or counterparty event at a single partnership moves the fund. Nothing here is diversified in a conventional sense, and the stated holding count of 13 in the shareholder report tells you how narrow the portfolio is.
The unit price is sensitive to rates and to the energy cycle. A 20.9% drawdown in 2022 shows that a 7% yield does not make the fund defensive. With the 10-year near 5% and the stock stalling over the last three months while energy producers rallied, you are being paid to wait in a rate-sensitive structure.
Finally, the long-term return has trailed the pure energy trade by 52 points since 2022. If your goal is to benefit from higher commodity prices, this is the wrong instrument.
Conclusion
AMLP is a tax-paying, concentrated, fee-based way to own American pipelines, and the numbers support it as an income position. It has paid a growing distribution, kept a tight premium to NAV, and delivered 127.9% since 2022 with less volatility than the energy sector. It has also trailed oil-sensitive stocks by a wide margin and carries both a structural tax drag and a rate risk that is front and center with the 10-year near 5%.
Short-term, the units have stalled, so the next move depends on rates and on whether volumes keep growing. Long-term, it is a good fit for someone who wants energy infrastructure income in a simple 1099 wrapper and understands that the trade-off is cost and concentration. Size it as a satellite energy holding, not as a bond substitute.
Annual paying members get a free print copy of The Price of a Quiet Yen or Intermarket Analysis and Investing, Third Edition (retail value up to $44.95, U.S. shipping): leadlagreport.com/annual. If you have read either book, an honest Amazon review helps other readers find it: The Price of a Quiet Yen and Intermarket Analysis and Investing.
Notes
- Perplexity Finance, Alerian MLP ETF (AMLP) quote, Oct. 30, 2026. https://www.perplexity.ai/finance/AMLP
- ALPS Funds, Alerian MLP ETF product page, trailing-twelve-month yield as of Oct. 29, 2026. https://www.alpsfunds.com/products/etf/AMLP
- ALPS Funds, Alerian MLP ETF fact sheet. https://www.alpsfunds.com/hubfs/alps-docs/lit/fs/alerian-mlp-etf-amlp-fs.pdf
- Yahoo Finance, AMLP holdings. https://ca.finance.yahoo.com/quote/AMLP/holdings/
- Yahoo Finance, AMLP price and distribution history. https://finance.yahoo.com/quote/AMLP/history/
- Charles Schwab, AMLP ETF summary. https://www.schwab.wallst.com/Prospect/Research/etfs/summary.asp?symbol=amlp
- Reuters, "Oil prices settle lower as diplomacy hopes offset some Mideast supply concerns," Oct. 29, 2026. https://lufkindailynews.com/news_reuters/business/oil-prices-fall-as-diplomacy-hopes-outwe...
- U.S. Department of the Treasury, Daily Treasury Par Yield Curve Rates, October 2026. https://home.treasury.gov/resource-center/data-chart-center/interest-rates/TextView?type=d...
- ALPS Funds, Alerian MLP ETF shareholder report. https://www.alpsfunds.com/hubfs/alps-docs/reg/sar/alerian-mlp-etf-amlp-sar.pdf
The Lead-Lag Report is provided by Lead-Lag Publishing, LLC. All opinions and views mentioned in this report constitute our judgments as of the date of writing and are subject to change at any time. Information within this material is not intended to be used as a primary basis for investment decisions and should also not be construed as advice meeting the particular investment needs of any individual investor. Trading signals produced by the Lead-Lag Report are independent of other services provided by Lead-Lag Publishing, LLC or its affiliates, and positioning of accounts under their management may differ. Please remember that investing involves risk, including loss of principal, and past performance may not be indicative of future results. Lead-Lag Publishing, LLC, its members, officers, directors and employees expressly disclaim all liability in respect to actions taken based on any or all of the information on this writing.