GDP Grew 3.4%. Real Income Fell. Americans Are Spending Their Savings.
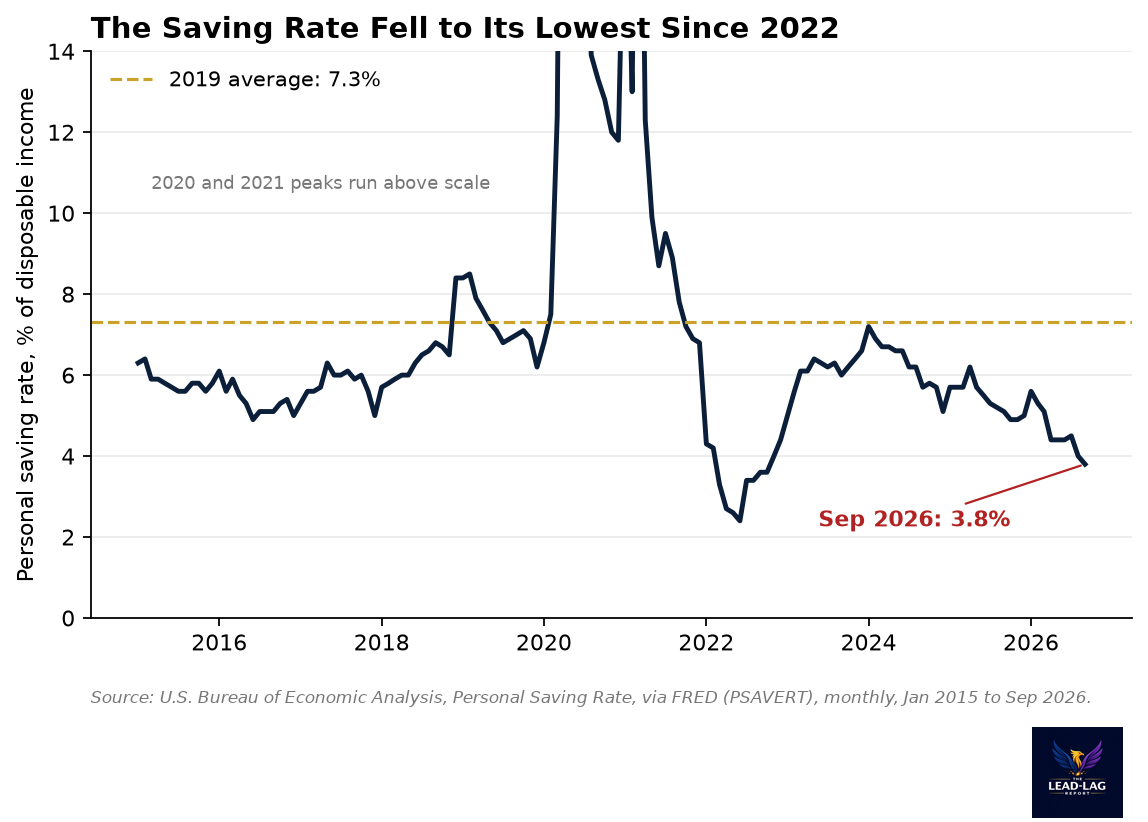
Q3 GDP grew 3.4%, but real disposable income fell 0.27% in September and the saving rate dropped to 3.8%, its lowest since October 2022.


Free for advisors today: Programmatic Ad Management

Paid campaigns set up and managed, spend under your control. Setup and management of programmatic ad campaigns, with audience targeting, exclusions and landing-page alignment. You pay ad spend directly to the ad platforms.
What you receive
- Paid media setup brief
- Platform/access readiness checklist
- Budget and billing boundary note
- Audience targeting plan
- Exclusion/suppression plan
- Campaign structure recommendation
Cost in credits: 5. Turnaround: Setup 5-7 business days, then managed. Delivered as: Handled with the Growth Desk. Best for: Advisors ready to add paid media to their growth plan.
It is free for advisors. There is no invoice from us. You earn the credits by showing up: attend a sponsored Lead-Lag Media webinar, meet a fund issuer in a one-on-one introduction, or join one of our advisor dinners.
Prefer to browse first? See all 34 services at advisor.leadlagmedia.com.
Credits carry no cash value and are not payment for services. Drafts are prepared with AI assistance and are for your and your firm’s review before use; they are not investment, legal, tax or compliance advice, and nothing is guaranteed. Services are offered to financial advisors and are not a solicitation to retail investors. Ad spend is advisor-paid directly to the ad platforms and is not included.
The economy grew 3.4% last quarter. Real income fell in September. The difference is coming out of savings.
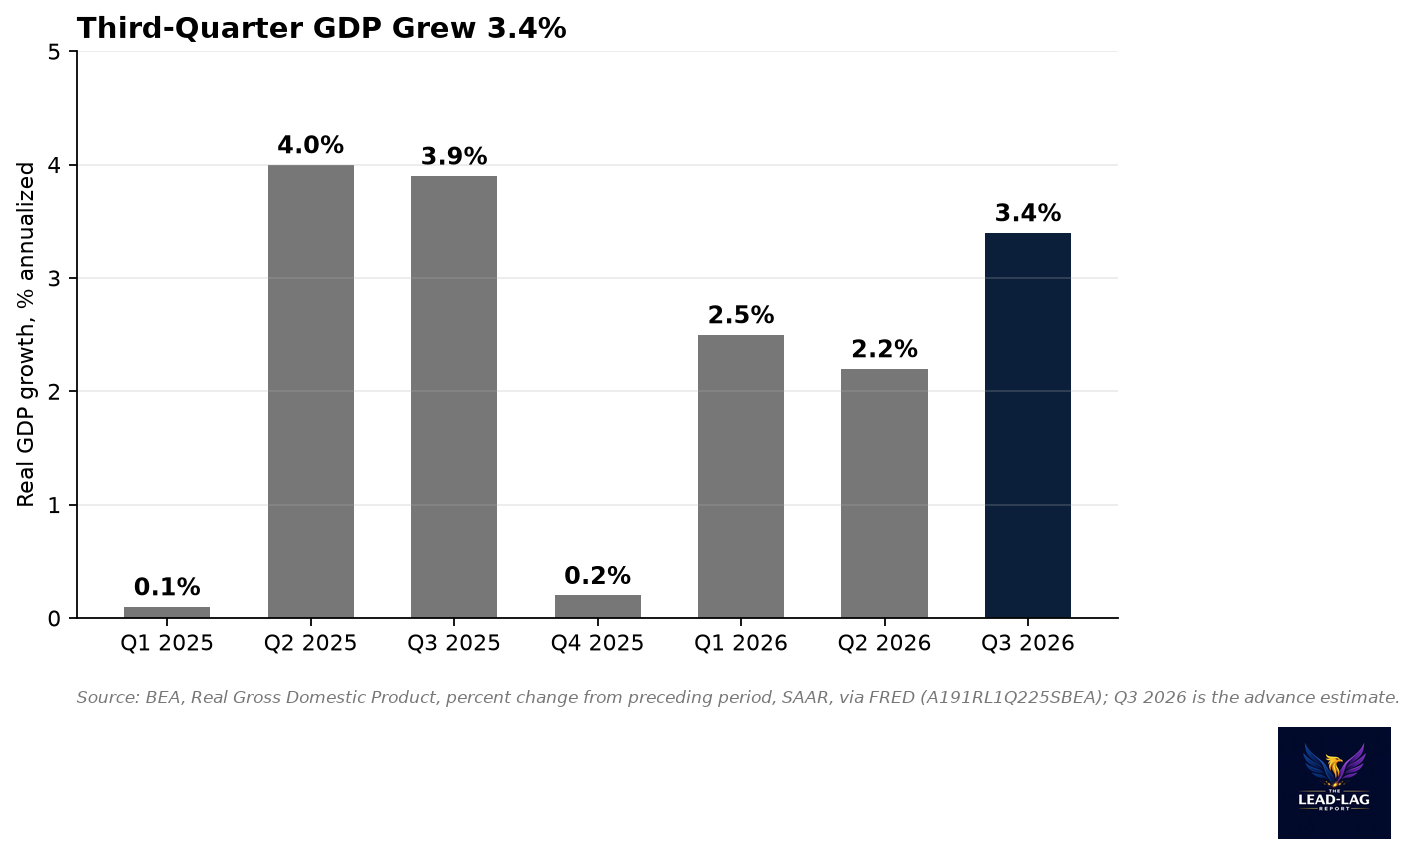
The first estimate of third-quarter GDP came in at 3.4% annualized, the fastest pace in a year.[1] On the surface, that is a strong consumer economy.
Look one layer down and the picture changes. Real disposable income fell 0.27% in September.[3] Real consumer spending rose 0.02%.[4] And the personal saving rate dropped to 3.8%, its lowest reading since October 2022.[2]
That is the story in three numbers. Households kept spending while their income went backward, and they paid for it by saving less.
The saving rate is doing the work
A year ago the saving rate was 5.1%.[2] In July it was 4.5%. In August, 4.0%. In September, 3.8%.[2] That is a slide of more than a full percentage point in two months.
For context, the 2019 average was 7.3%.[2] The rate has not been near that level for most of the past four years. The only stretch lower than today was 2022, when it bottomed at 2.4% in June.[2]
Why does this matter? The saving rate is the cushion between what people earn and what they spend. When it falls, spending can grow faster than income for a while. It cannot do that forever.
Spending has outrun income
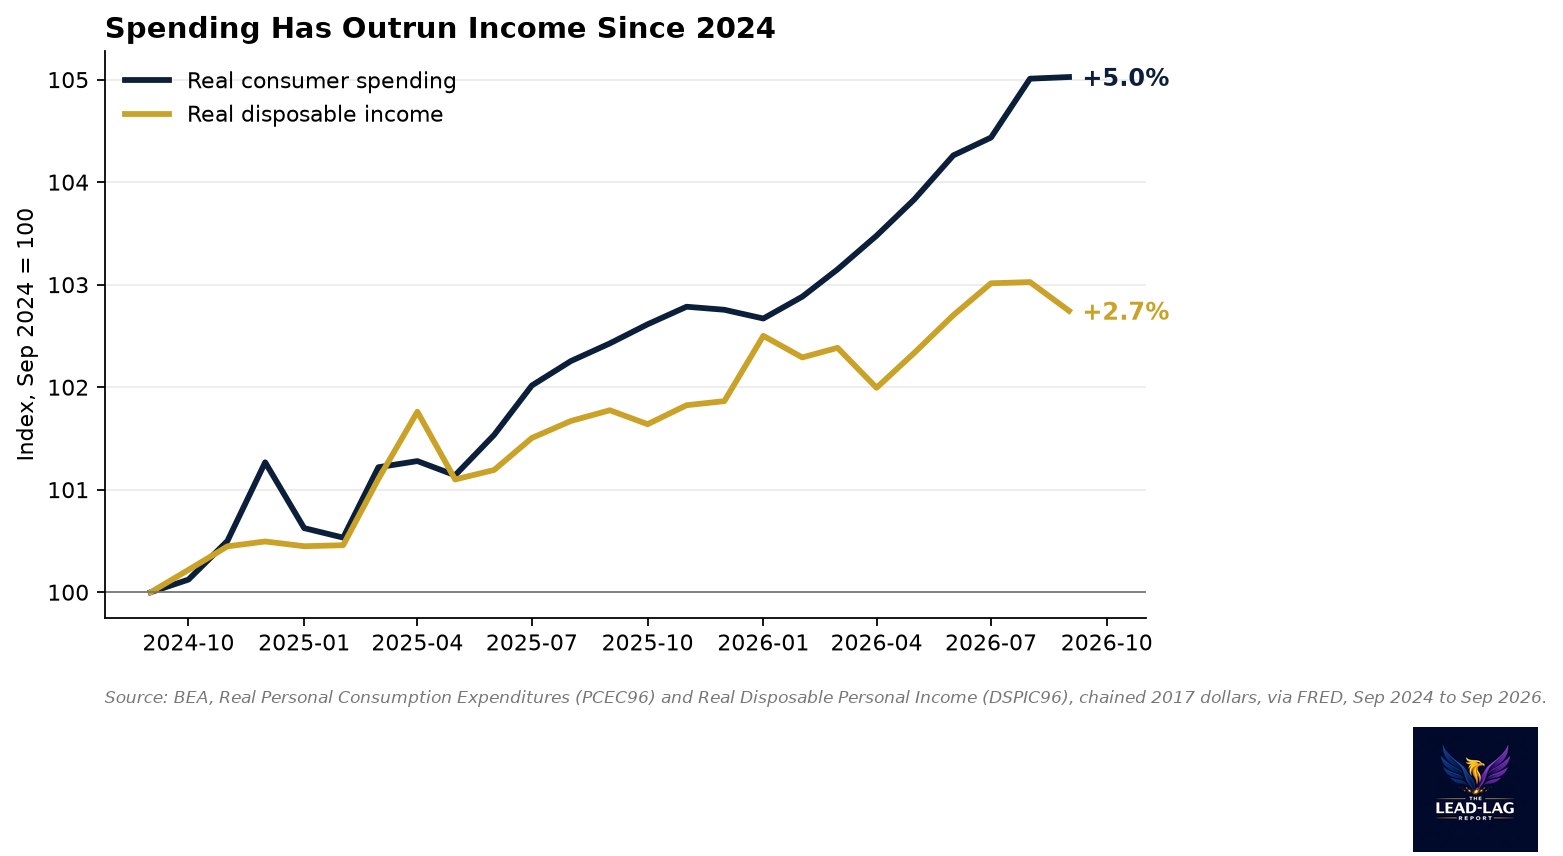
Take a longer view. Since September 2024, real consumer spending is up 5.0%.[4] Real disposable income is up 2.7%.[3] Over the past twelve months alone, spending rose 2.54% after inflation and income rose 0.95%.[3][4]
That gap is the whole growth story for the consumer. Roughly speaking, households have been spending more than two and a half times as fast as their real income has grown. By my calculation, that ratio is about 2.7 to 1 over the past year.[3][4]
A narrower income measure tells the same thing. Real personal income excluding government transfers fell in September and is up just 0.54% from a year earlier.[5] Wages and business income, after inflation, are barely growing.
Why GDP still looks strong
None of this means the 3.4% figure is wrong. It means you should be careful about what it says.
GDP measures output. A quarter in which consumers draw down savings to keep spending will still show solid output. The question for the next few quarters is not whether consumers spent. They did. It is whether they can keep spending at this pace without income growth to back it up.
The quarterly path has been uneven. Real GDP grew 0.2% in the fourth quarter of 2025, then 2.5% and 2.2% in the first two quarters of 2026, before the 3.4% advance estimate for the third.[1] The advance estimate is also the first of three. It will be revised as more data arrives.
What I would not conclude
I want to be careful here, because one month of income data can mislead.
September income can be pulled around by timing. Bonus payments, tax refunds and benefit changes all move it month to month. I would not build a view on a single 0.27% drop.[3]
What I do think is meaningful is the direction over a full year. A 2.54% gain in real spending against a 0.95% gain in real disposable income is not noise.[3][4] It is a pattern that has held for most of the period shown in the second chart.
I also would not read this as a recession call. Spending that outpaces income can run for a long time if households start from a strong position and their jobs feel safe. That has been the case.
The honest version is narrower. Growth this year has leaned on a shrinking cushion. I could be wrong if income growth picks up on its own, through faster wage gains or slower inflation, and closes the gap without spending having to slow. That is the outcome to hope for. It is not yet the outcome in the data.
Two readings
There is a benign reading. Households may simply feel secure. The labor data back that up: the layoffs rate and weekly jobless claims are both below their 2019 averages.[6] People who are not worried about their jobs save less. In that version, the lower saving rate is a sign of confidence, not stress.
There is a harder reading. Spending that runs ahead of income has to be financed by something: savings, credit or rising asset values. If real income keeps flatlining, the saving rate cannot keep falling at this pace. At some point spending growth has to slow to meet income, or income has to pick up.
I lean toward watching the second reading more closely. A saving rate that drops more than a point in two months is not a trend I would extrapolate.[2] It is a signal to watch the next two income reports.
What this means for advisors
For advisors, the practical takeaway is that client households are making active trade-offs right now. A falling saving rate means more people are choosing between spending, saving and paying down debt. Those are planning conversations.
It also means attention is shifting. When households feel the squeeze between income and spending, they look for help, and they look online first. Being visible in front of the right local audience at that moment matters more than it does when everyone is comfortable.
The markers to watch are straightforward. If next month's income data shows real disposable income recovering, the consumer story holds. If the saving rate falls again while income stays flat, spending growth is borrowing from the future.
Notes
[1] Real Gross Domestic Product, percent change from preceding period, seasonally adjusted annual rate, U.S. Bureau of Economic Analysis via FRED, series A191RL1Q225SBEA: https://fred.stlouisfed.org/series/A191RL1Q225SBEA. Q3 2026 advance estimate 3.4%; Q2 2026 2.2%; Q1 2026 2.5%; Q4 2025 0.2%.
[2] Personal Saving Rate, BEA via FRED, series PSAVERT: https://fred.stlouisfed.org/series/PSAVERT. 3.8% (Sep 2026), 4.0% (Aug 2026), 4.5% (Jul 2026), 5.1% (Sep 2025), 2.4% (Jun 2022); lowest since Oct 2022 and 2019 average 7.31% by my calculation.
[3] Real Disposable Personal Income, chained 2017 dollars, BEA via FRED, series DSPIC96: https://fred.stlouisfed.org/series/DSPIC96. $18,366.1 billion (Sep 2026), $18,416.2 billion (Aug 2026), $18,192.7 billion (Sep 2025), $17,875.4 billion (Sep 2024); changes by my calculation.
[4] Real Personal Consumption Expenditures, chained 2017 dollars, BEA via FRED, series PCEC96: https://fred.stlouisfed.org/series/PCEC96. $16,977.6 billion (Sep 2026), $16,975.0 billion (Aug 2026), $16,557.6 billion (Sep 2025), $16,165.2 billion (Sep 2024); changes by my calculation.
[5] Real personal income excluding current transfer receipts, chained 2017 dollars, BEA via FRED, series W875RX1: https://fred.stlouisfed.org/series/W875RX1. $17,015.2 billion (Sep 2026), $17,068.4 billion (Aug 2026), $16,923.1 billion (Sep 2025); year-over-year change by my calculation.
[6] Layoffs and Discharges rate, BLS JOLTS via FRED, series JTSLDR: https://fred.stlouisfed.org/series/JTSLDR, 1.0% (Aug 2026) versus a 2019 average of 1.21%; Initial Claims, U.S. Employment and Training Administration via FRED, series ICSA: https://fred.stlouisfed.org/series/ICSA, 194,000 (week ending Oct 17, 2026) versus a 2019 weekly average of 217,712. Averages by my calculation.
The Lead-Lag Report is provided by Lead-Lag Publishing, LLC. All opinions and views mentioned in this report constitute our judgments as of the date of writing and are subject to change at any time. Information within this material is not intended to be used as a primary basis for investment decisions and should also not be construed as advice meeting the particular investment needs of any individual investor. Trading signals produced by the Lead-Lag Report are independent of other services provided by Lead-Lag Publishing, LLC or its affiliates, and positioning of accounts under their management may differ. Please remember that investing involves risk, including loss of principal, and past performance may not be indicative of future results. Lead-Lag Publishing, LLC, its members, officers, directors and employees expressly disclaim all liability in respect to actions taken based on any or all of the information on this writing.