Hires, Quits and Layoffs Are All Below 2019. The Job Market Stopped Moving.
Quits are 18% below 2019, hiring 15% below and layoffs 17% below. Jobless claims are at 194,000. The labor market is not weak or strong. It is still.


Free for advisors today: LinkedIn Outreach Automation

Relationship-first LinkedIn outreach, set up properly. Strategy, targeting, a connection note and follow-up sequence, and account and tooling readiness for compliance-aware LinkedIn outreach. You and your firm review and run it from your own account.
What you receive
- LinkedIn outreach strategy
- ICP and suppression checklist
- Profile and account readiness checklist
- Automation/tooling readiness checklist
- Connection note options
- 3-message follow-up sequence
Cost in credits: 6 to set up, then 4 per month. Turnaround: Setup 7-10 business days, then ongoing. Delivered as: Handled with the Growth Desk. Best for: Advisors who want a steady stream of LinkedIn conversations.
It is free for advisors. There is no invoice from us. You earn the credits by showing up: attend a sponsored Lead-Lag Media webinar, meet a fund issuer in a one-on-one introduction, or join one of our advisor dinners.
Prefer to browse first? See all 34 services at advisor.leadlagmedia.com.
Credits carry no cash value and are not payment for services. Drafts are prepared with AI assistance and are for your and your firm’s review before use; they are not investment, legal, tax or compliance advice, and nothing is guaranteed. Services are offered to financial advisors and are not a solicitation to retail investors. Third-party automation tool subscriptions are advisor-paid where required.
Fewer people are being hired, fewer are quitting and fewer are being laid off than in 2019. The unemployment rate barely tells you that. The flows do.
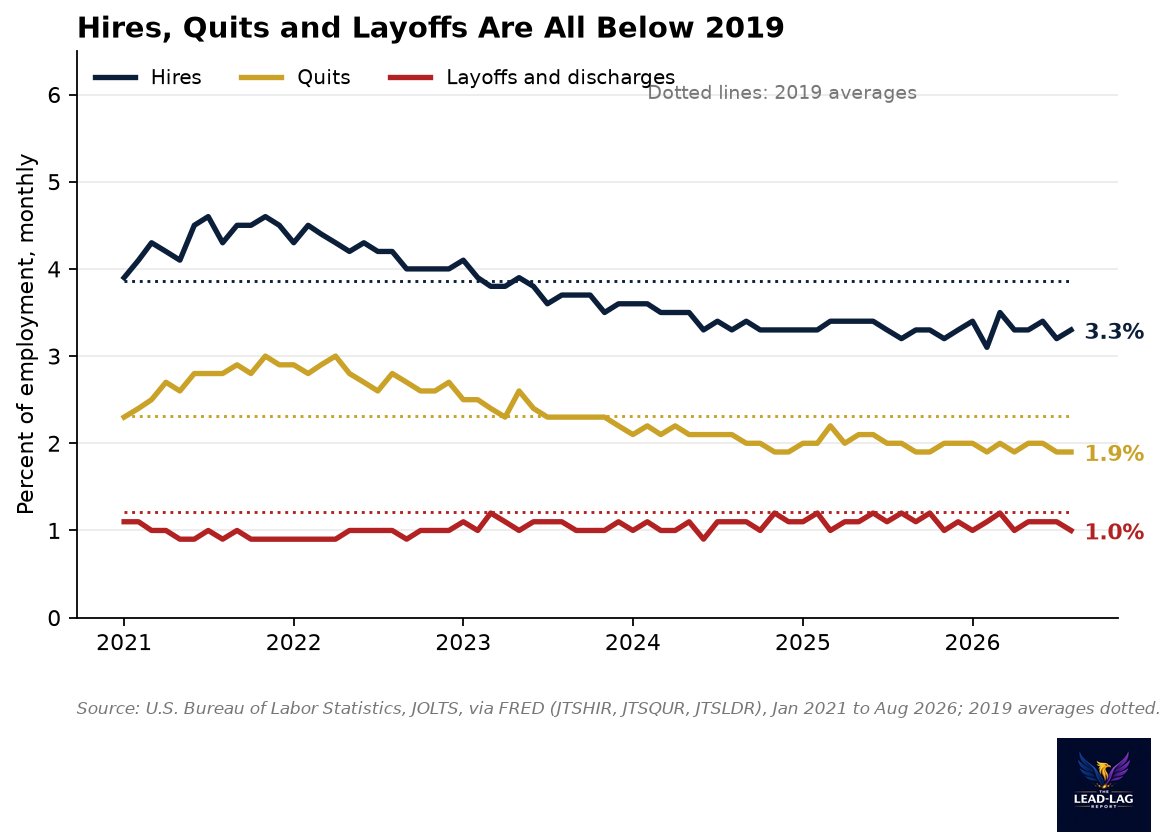
The quits rate was 1.9% in August. In 2019 it averaged 2.32%, and in November 2021 it peaked at 3.0%.[1] The hires rate was 3.3%, against a 2019 average of 3.87%.[2] The layoffs and discharges rate was 1.0%, against 1.21% in 2019.[3]
Put those together and you get a labor market that is not weak and not strong. It is still. People are not being pushed out of jobs, and they are not walking out of them either.
That stillness matters more than the headline unemployment rate, which was 4.2% in September.[7] A 4.2% rate with a lot of churn is a very different economy from a 4.2% rate with almost none.
Nobody is getting fired
Start with the low-fire side, because it is the part that looks healthiest.
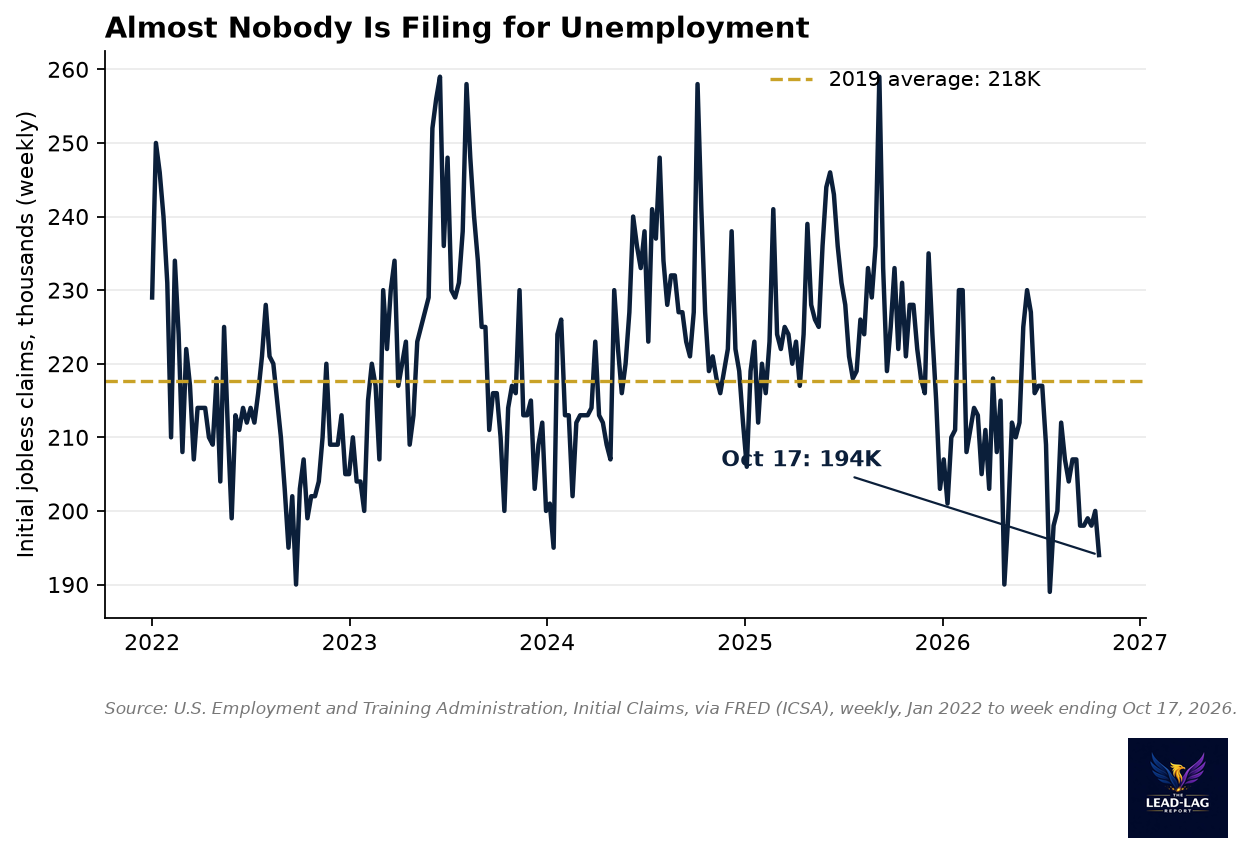
Initial jobless claims were 194,000 in the week ending October 17. The four-week average was 197,750.[4] In 2019, a year most people remember as a tight labor market, claims averaged about 217,700 a week.[4] The low for 2026 so far was 189,000, in the week ending July 18.[4]
Continuing claims tell the same story from the other end. They were 1.728 million in the week ending October 10, down from 1.947 million a year earlier.[5] Fewer people are filing, and fewer are staying on benefits.
Employers are holding on to the workers they have. After the hiring problems of 2021 and 2022, that is a rational choice. Letting someone go is cheap. Finding a replacement has not been.
Nobody is leaving either
The low-hire side is the part that deserves more attention.
Quits are a confidence measure. People quit when they believe they can find something better. At 1.9%, the quits rate is 18% below its 2019 average.[1] Hiring is 15% below.[2] Those two numbers move together for a reason: one person's quit is usually another firm's hire.
Wages help explain the caution. Average hourly earnings rose 3.02% in the year to September, to $37.81.[9] Consumer prices rose 3.72% over the same period.[9] A worker who stays put is losing a little ground in real terms. But a worker who switches is no longer guaranteed the large raise that job-hoppers got in 2021 and 2022, and that is what makes a move worth the risk.
Job openings were 7.08 million in August, against 7.03 million unemployed people.[6] That is about one opening per job seeker. Not a shortage, not a glut.
Payroll growth has slowed to match. Employers added 496,000 jobs in the twelve months to September, and an average of about 51,000 a month over the last three months.[8]
Why 2019 is the right yardstick
You could compare today with 2021 or 2022, and every number would look like a collapse. That would be misleading. Those years were an outlier, with quits at 3.0% and hiring near 4.6% as the economy reopened.[1][2] Nobody should expect that to come back.
2019 is a better test. It was late in a long expansion, unemployment was low, and most people would call it a good job market. If today's flows only matched 2019, you would call the labor market normal.
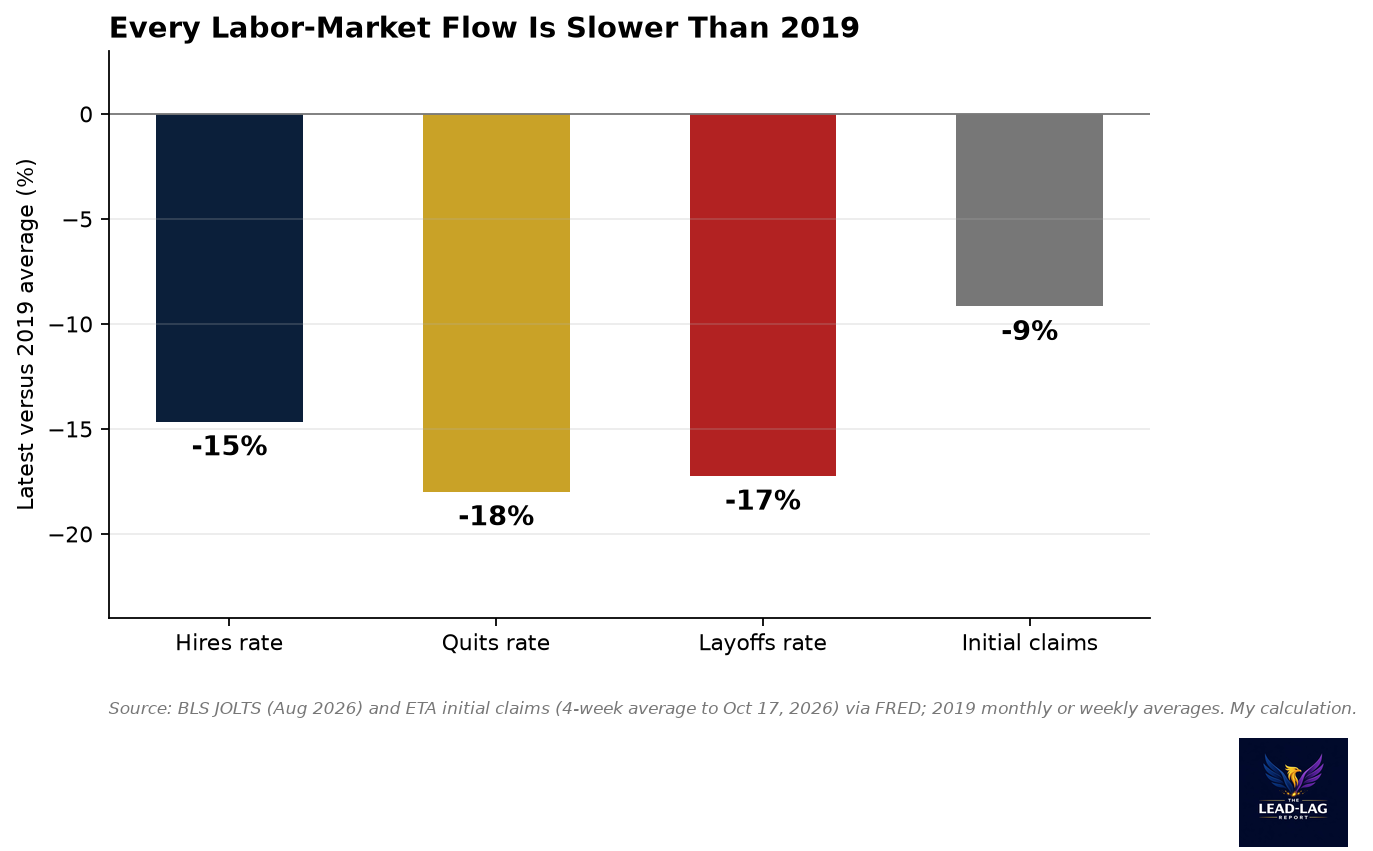
They do not match it. Every one of the four flows in chart three is below its 2019 level, by between 9% and 18%.[1][2][3][4] That is the point. The labor market is not cooling from an overheated level anymore. It has cooled past normal.
Here is the strange part. Layoffs are below 2019 too.[3] Usually a slowdown in hiring comes with a rise in firing. This time it has come with less of both. That is what a frozen market looks like. It is also why it is easy to miss.
If you only watch the unemployment rate, you see a number that has drifted from 4.4% a year ago to 4.2%.[7] Calm. If you watch the flows, you see a market where far fewer people are moving at all.
Two ways to read a frozen market
There is a benign reading. Low layoffs mean household income is secure. Secure income supports spending, and spending supports earnings. On this view, the economy is simply settling into a slower, steadier gear after an unusually turbulent five years.
There is a less comfortable reading. Low churn often shows up late in a cycle. Firms stop hiring before they start firing. If the hires rate keeps drifting lower while claims stay flat, the first visible sign of trouble may not be layoffs at all. It may be that people who do lose a job take much longer to find the next one. Continuing claims are the place to watch for that, and so far they are falling, not rising.[5]
I do not think the data settles which reading is right yet. What I do think is that the unemployment rate is the wrong number to anchor on. The flows moved first in 2021, and I would expect them to move first again.
What this means for advisors
For advisors, a low-churn labor market has a practical side effect. Job changes are one of the most reliable triggers for a new client relationship: a rollover, a new benefits package, a fresh look at a financial plan. When quits run 18% below 2019, fewer of those moments happen on their own.[1]
That shifts the work from waiting for the client to show up to finding the client first. The professionals who are still changing roles are a smaller group, and they are easier to reach where they already spend time: their professional networks.
The markers to watch from here are simple. The next JOLTS report will show whether quits and hires keep sliding. Weekly claims will show whether the low-fire side holds. If both drift lower together, the freeze is deepening. If claims start rising while hiring stays weak, the less comfortable reading is winning.
Notes
[1] Quits: Total Nonfarm, rate, U.S. Bureau of Labor Statistics JOLTS via FRED, series JTSQUR: https://fred.stlouisfed.org/series/JTSQUR. 1.9% (Aug 2026); 2019 average 2.32% by my calculation; 3.0% (Nov 2021). 18% below 2019 by my calculation.
[2] Hires: Total Nonfarm, rate, BLS JOLTS via FRED, series JTSHIR: https://fred.stlouisfed.org/series/JTSHIR. 3.3% (Aug 2026); 2019 average 3.87% by my calculation, 15% below; 4.6% (Jul 2021).
[3] Layoffs and Discharges: Total Nonfarm, rate, BLS JOLTS via FRED, series JTSLDR: https://fred.stlouisfed.org/series/JTSLDR. 1.0% (Aug 2026); 2019 average 1.21% by my calculation.
[4] Initial Claims, U.S. Employment and Training Administration via FRED, series ICSA: https://fred.stlouisfed.org/series/ICSA. 194,000 (week ending Oct 17, 2026); four-week average 197,750 by my calculation; 2019 weekly average 217,712 by my calculation; 189,000 (week ending Jul 18, 2026).
[5] Continued Claims (Insured Unemployment), ETA via FRED, series CCSA: https://fred.stlouisfed.org/series/CCSA. 1,728,000 (week ending Oct 10, 2026); 1,947,000 (week ending Oct 11, 2025).
[6] Job Openings: Total Nonfarm, BLS JOLTS via FRED, series JTSJOL: https://fred.stlouisfed.org/series/JTSJOL, 7,079,000 (Aug 2026). Unemployment Level, BLS via FRED, series UNEMPLOY: https://fred.stlouisfed.org/series/UNEMPLOY, 7,031,000 (Aug 2026).
[7] Unemployment Rate, BLS via FRED, series UNRATE: https://fred.stlouisfed.org/series/UNRATE. 4.2% (Sep 2026); 4.4% (Sep 2025).
[8] All Employees, Total Nonfarm, BLS via FRED, series PAYEMS: https://fred.stlouisfed.org/series/PAYEMS. 159,044,000 (Sep 2026) versus 158,548,000 (Sep 2025) and 158,892,000 (Jun 2026); changes by my calculation.
[9] Average Hourly Earnings of All Employees, Total Private, BLS via FRED, series CES0500000003: https://fred.stlouisfed.org/series/CES0500000003, $37.81 (Sep 2026) versus $36.70 (Sep 2025). Consumer Price Index for All Urban Consumers, BLS via FRED, series CPIAUCSL: https://fred.stlouisfed.org/series/CPIAUCSL, 336.298 (Sep 2026) versus 324.245 (Sep 2025). Changes by my calculation.
The Lead-Lag Report is provided by Lead-Lag Publishing, LLC. All opinions and views mentioned in this report constitute our judgments as of the date of writing and are subject to change at any time. Information within this material is not intended to be used as a primary basis for investment decisions and should also not be construed as advice meeting the particular investment needs of any individual investor. Trading signals produced by the Lead-Lag Report are independent of other services provided by Lead-Lag Publishing, LLC or its affiliates, and positioning of accounts under their management may differ. Please remember that investing involves risk, including loss of principal, and past performance may not be indicative of future results. Lead-Lag Publishing, LLC, its members, officers, directors and employees expressly disclaim all liability in respect to actions taken based on any or all of the information on this writing.