Junk Bonds Split in Two. CCC Spreads Are Wider Than April 2025.
CCC spreads hit 13.56% on Oct. 23, wider than the April 2025 shock, while BB barely moved. The junk market is no longer one market.


Today’s Lead-Lag Report post is sponsored by SanJac Alpha
A smarter approach to fixed income investing
SanJac Alpha offers actively managed fixed income ETFs designed to pursue opportunities while also managing risk across today’s fixed income landscape.
The SanJac Alpha Low Duration ETF (SJLD) seeks current income and capital preservation through short-term, high-grade credit markets.
The SanJac Alpha Core Plus Bond ETF (SJCP) seeks to maximize total returns while maintaining a moderate risk profile by providing exposure to a diverse range of Treasury, Agency, and Investment-Grade Bonds, Mortgage-Backed Securities (MBS), mREITs, and Preferred Stocks. Seeks to maximize total return while balancing risk by providing exposure to a broad range of bond products with a bias toward high-grade credits.
Markets change. Volatility is here.
It’s time for active management.
IMPORTANT INFORMATION
SanJac Alpha offers two exchange-traded funds. The funds’ investment objectives, risks, and expenses must be considered carefully before investing. The prospectus contains this and other important information about the investment company. Please read it carefully before investing. A copy of the prospectus can be found by visiting www.sanjacalpha.com or by calling 1-800-617-0004.
Investing involves risk, including loss of principal.
ETFs are subject to additional risks that do not apply to conventional mutual funds, including the risks that the market price of an ETF’s shares may trade at a premium or discount to its net asset value, an active secondary trading market may not develop or be maintained, or trading may be halted by the exchange in which they trade, which may impact an ETF’s ability to sell its shares.
Shares of any ETF are bought and sold at market price (not NAV) and are not individually redeemed from the ETF. Brokerage commissions will reduce returns.
The SanJac Alpha exchange-traded funds are distributed by Quasar Distributors, LLC.
DISCLAIMER – PLEASE READ: This is sponsored advertising content for which Lead-Lag Publishing, LLC has been paid a fee. The information provided in the link is solely the creation of SanJac Alpha. Lead-Lag Publishing, LLC does not guarantee the accuracy or completeness of the information provided in the link or make any representation as to its quality. All statements and expressions provided in the link are the sole opinion of SanJac Alpha, and Lead-Lag Publishing, LLC expressly disclaims any responsibility for action taken in connection with the information provided in the link.
Today’s Lead-Lag Report post is sponsored by DeFi Development Corp.

Meet CHAD: A Nasdaq-Listed Preferred Stock With a 14% Annualized Dividend Rate
Meet CHAD (Nasdaq: CHAD), DeFi Development Corp.’s variable-rate perpetual preferred stock. CHAD currently offers a 14% annualized dividend rate, paid each business day when declared. Based on its current balance sheet, DFDV estimates over 140 years of dividend coverage.
DISCLAIMER – PLEASE READ: This is sponsored advertising content for which Lead-Lag Publishing, LLC has been paid a fee. The information provided in the link is solely the creation of DeFi Development Corp. Lead-Lag Publishing, LLC does not guarantee the accuracy or completeness of the information provided in the link or make any representation as to its quality. All statements and expressions provided in the link are the sole opinion of DeFi Development Corp., and Lead-Lag Publishing, LLC expressly disclaims any responsibility for action taken in connection with the information provided in the link.
CCC spreads hit 13.56% on October 23, wider than at the April 2025 tariff shock, while BB spreads barely moved and the high-yield index sits more than a point below its 2025 peak. The junk market is no longer one market.
MICHAEL A. GAYED, CFA
Key Highlights
- CCC-and-lower spreads reached 13.56% on October 23, 2026, the widest reading in the three years of daily data FRED publishes and above the 11.37% of April 7, 2025.1
- The total high-yield spread was 3.38% the same day, well below its 4.61% peak of April 7, 2025.2
- From August 28 to October 23, CCC spreads widened 330 basis points while BB widened 56 and single-B 71.1, 3, 4
- CCC now pays 7.06 times what BB pays, above 99.7% of daily readings since October 2023.1, 3
The index says calm. The bottom of the market does not.
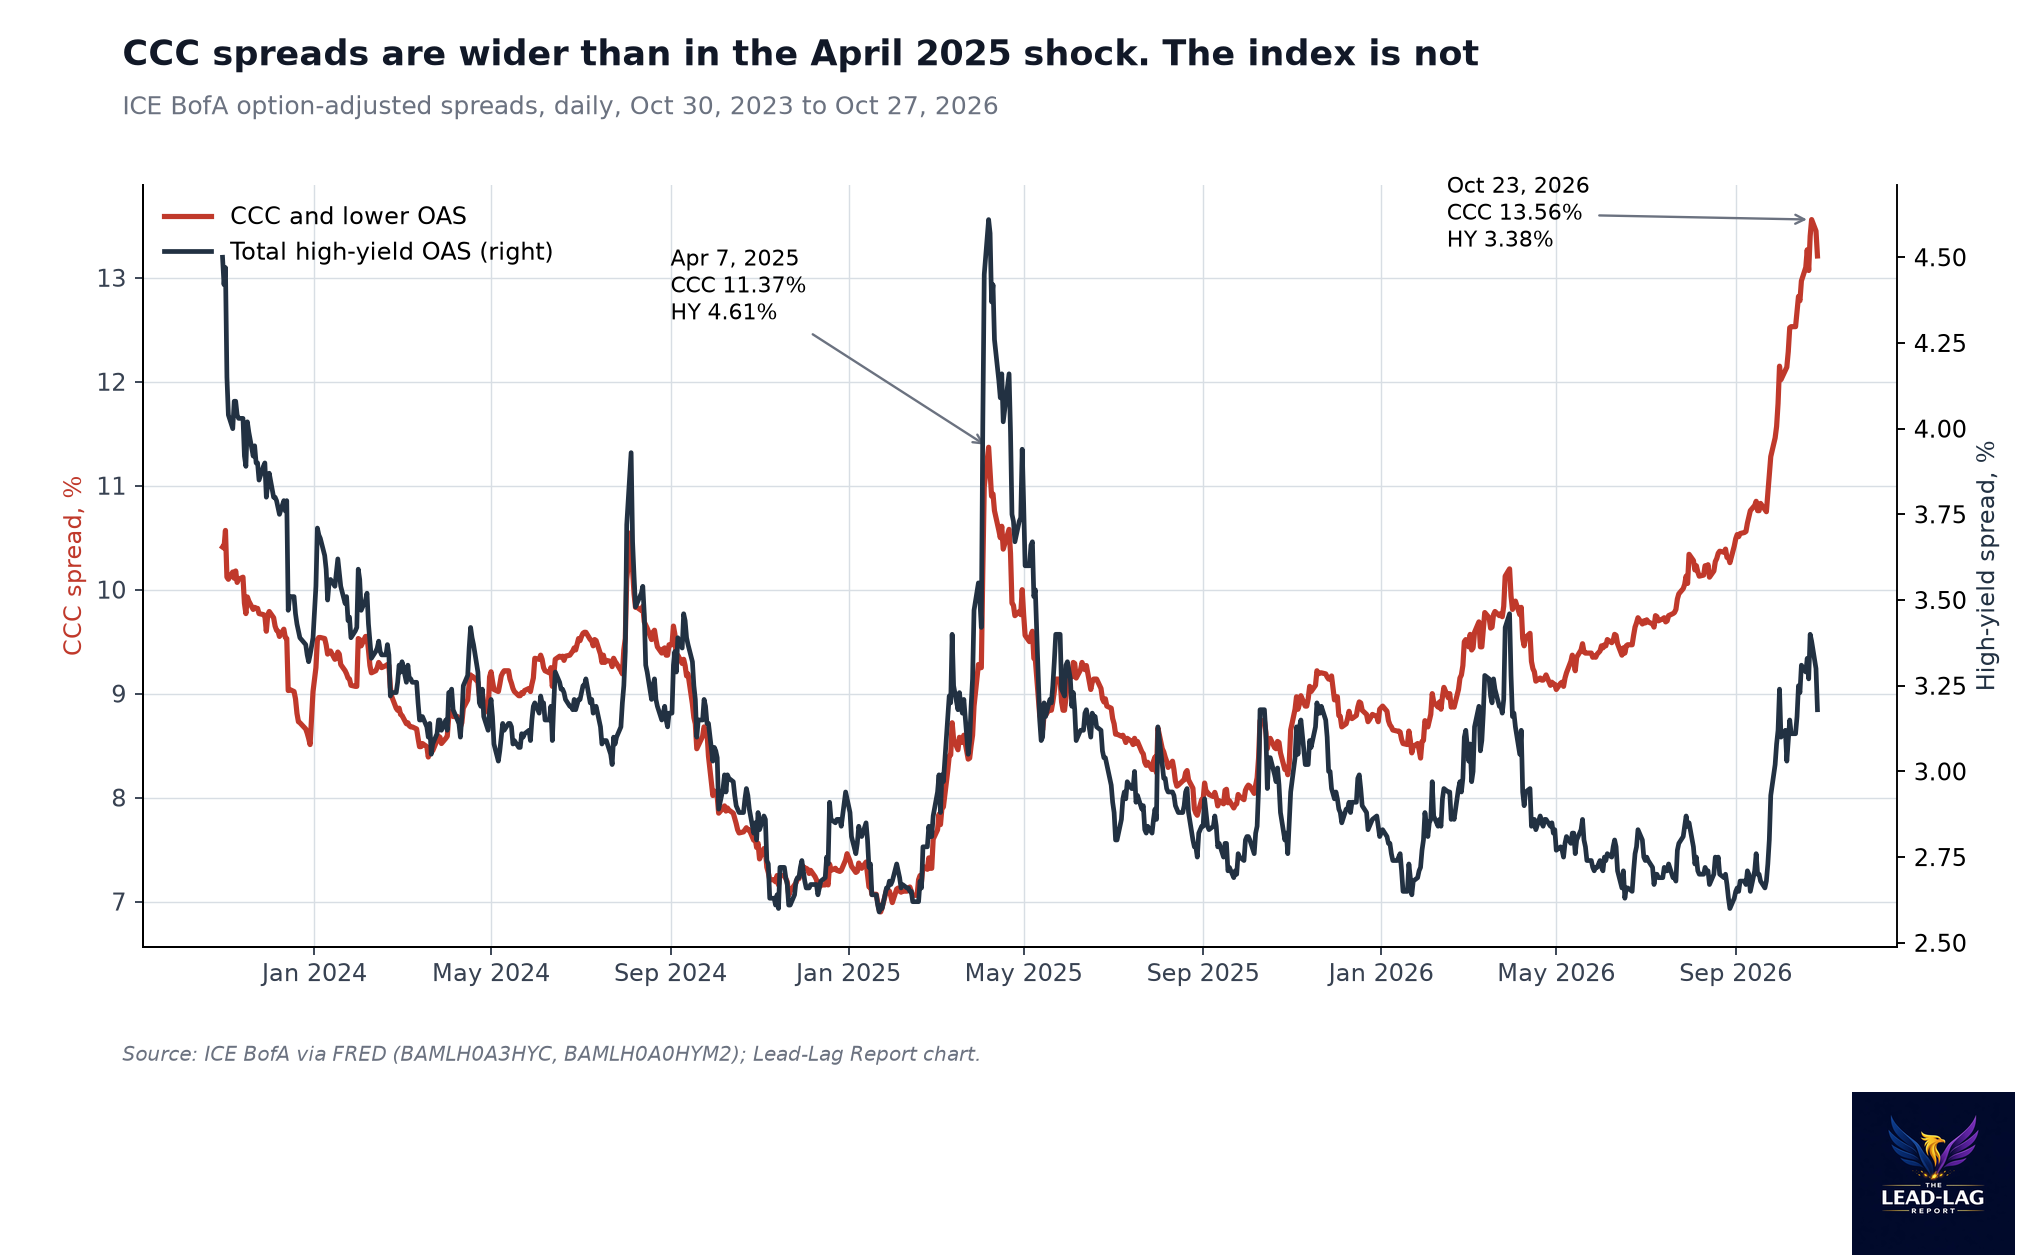
If you only watch the headline high-yield spread, the last two months look like a modest repricing. The ICE BofA US High Yield Index spread rose from 2.60% on August 28 to 3.38% on October 23, then eased to 3.18% by October 27.2 That is a move, but it is not a crisis. In April 2025, during the tariff shock, the same spread hit 4.61%.2
Now look one layer down. The CCC-and-lower segment, the weakest credits in the junk universe, closed at 13.56% on October 23.1 That is the widest level in the daily series FRED makes available, which starts October 30, 2023. It is also wider than the 11.37% CCC reached on April 7, 2025, the day the overall junk spread peaked.1, 2
Read that again. The weakest borrowers are being charged more today than at the worst point of the 2025 shock, while the index as a whole is more than a full point tighter than it was then. The headline number is hiding a split.
Where the widening actually happened
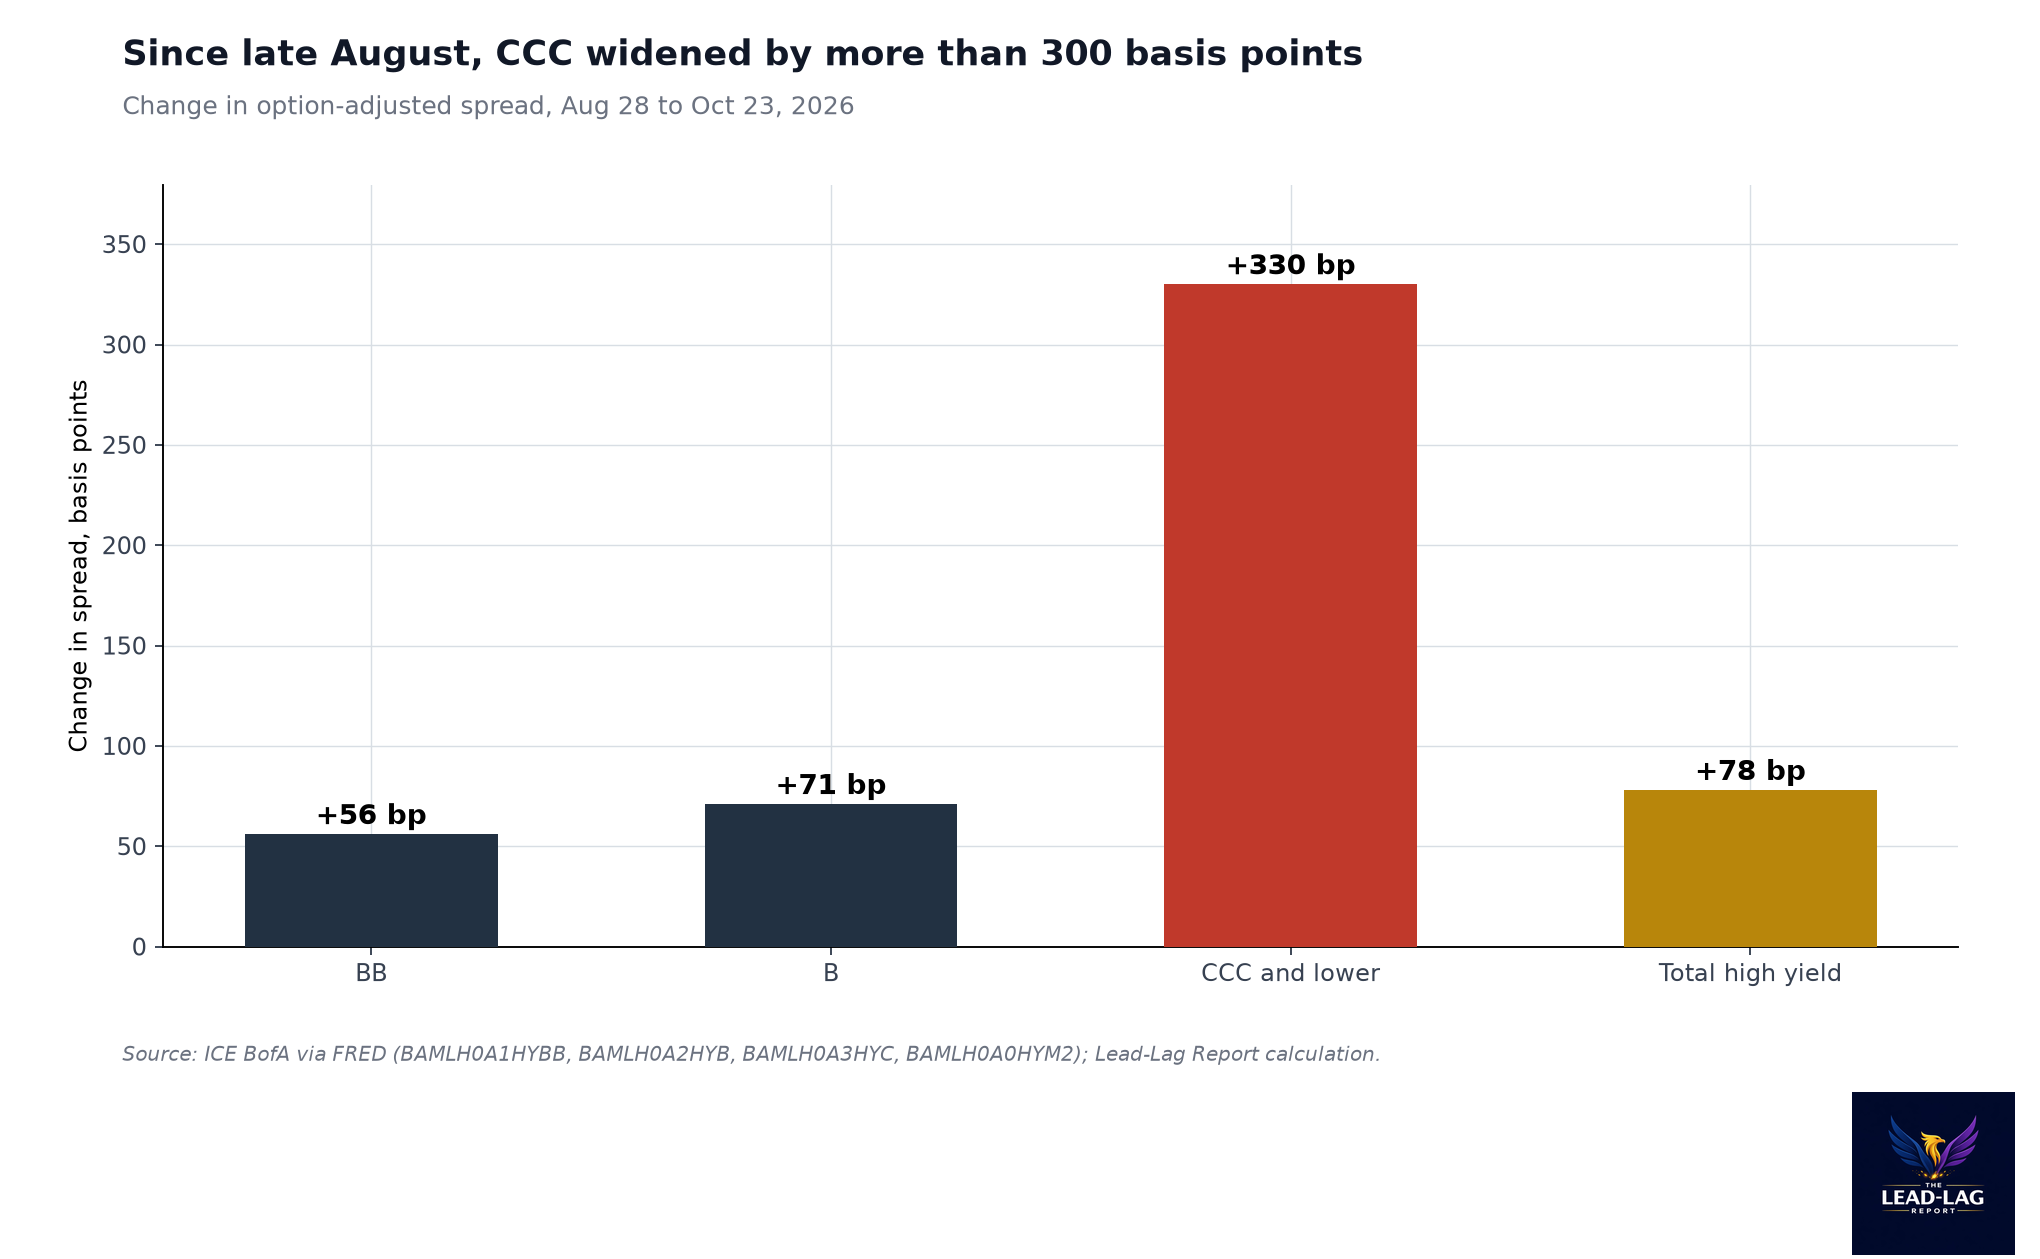
The cleanest way to see the split is to break the index apart by rating. Between August 28 and October 23, the BB spread went from 1.50% to 2.06%, a 56 basis point move.3 Single-B went from 2.72% to 3.43%, 71 basis points.4 CCC went from 10.26% to 13.56%, 330 basis points.1 The total index widened 78 basis points.2
BB is the top tier of junk. These are companies one notch from investment grade, often with public equity, real cash flow and access to the bond market on most days. CCC is the opposite end: thin coverage, heavy debt loads and refinancing needs that depend on the market staying open. When stress shows up in CCC and stays out of BB, the market is not repricing risk in general. It is repricing who can roll their debt.
This has been building all year, not just since August. CCC spreads were 8.38% on January 28, 2026, the low for the year.1 From that low to the October 23 peak they widened 518 basis points. BB set its 2026 low at 1.50% on August 28 and has never been above 2.10% since.3
The ratio that tells the story
One way to measure the split is to divide the CCC spread by the BB spread. It answers a simple question: how many times more does the weakest junk pay than the best junk?
Since October 2023, the median answer has been 4.73 times.1, 3 On October 27 it was 7.06 times, higher than 99.7% of daily readings in the series.1, 3 The peak was 7.17 times on September 11, 2026.1, 3
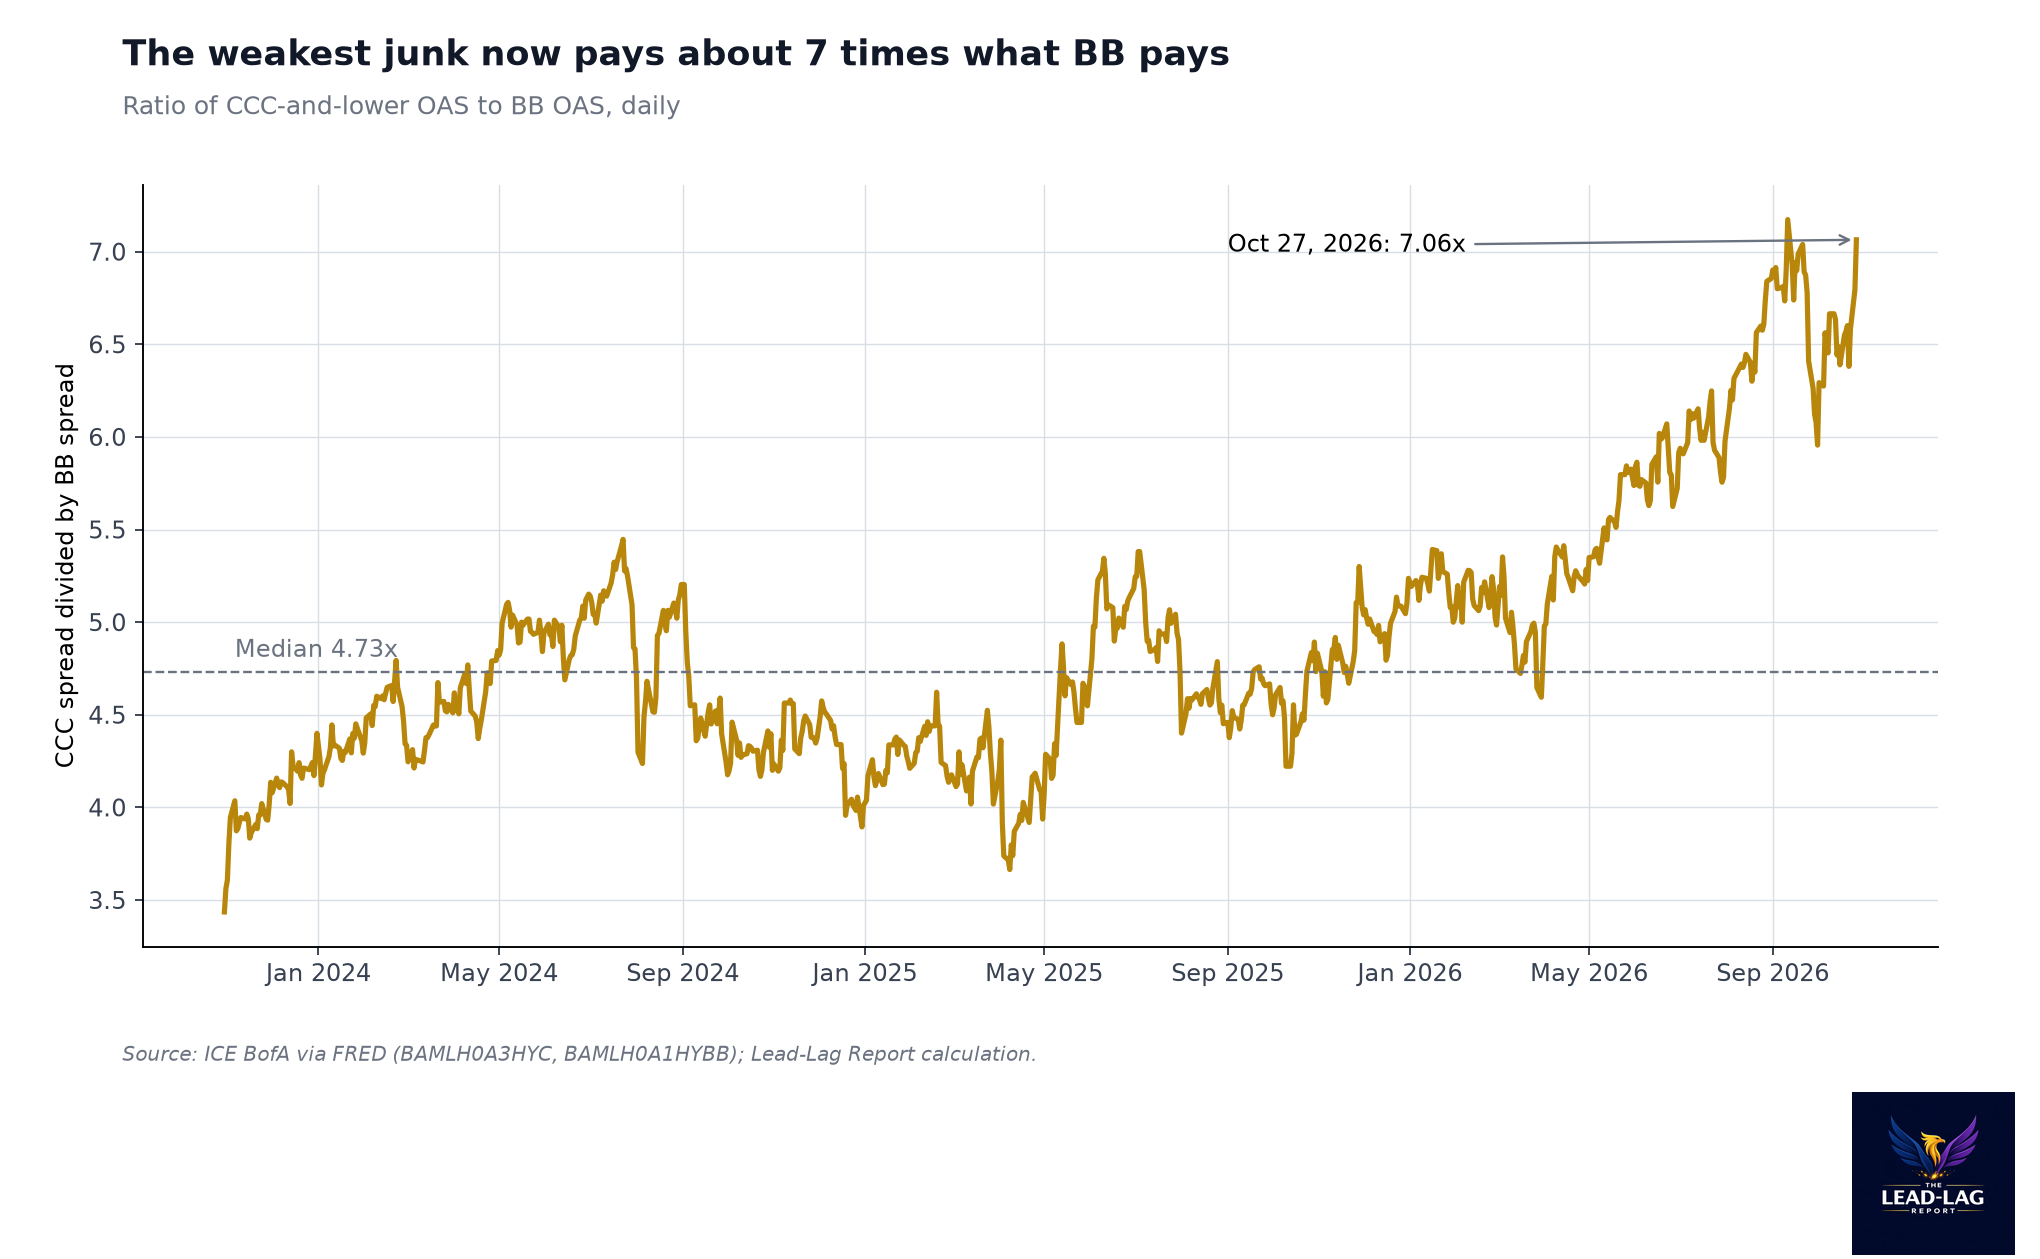
In April 2025 the ratio did not do this. Spreads blew out across the board, so the ratio stayed near its normal range. That was a liquidity shock that hit everyone. This is different. This is a selection process, and the market is choosing.
Why the split matters more than the level
There is a comfortable way to read this. CCC is a small part of the junk market, its spreads are always volatile, and the index is fine. That reading misses what CCC spreads usually measure.
CCC spreads tend to move first because those borrowers have the least room. They cannot ride out a long stretch of high funding costs. With the 10-year Treasury yield at 5.00% on October 26 and the 2-year at 4.68%, the base rate under every one of those bonds is high.5, 6 Add a 13% spread on top and the effective yield on the CCC index was 17.86% on October 27.7 A company refinancing at anything near that rate is paying a cost that most business models cannot carry for long.
The better credits can live with today's rates. The weakest cannot. The bond market is drawing that line in public, one spread at a time.
I have watched this pattern before. When the bottom of a credit market reprices while the top stays calm, the question is never whether the stress is real. The question is whether it stays contained. Sometimes it does. The lowest-quality issuers default, restructure or get taken out, and the rest of the market moves on. Sometimes it does not, and the widening climbs the ladder from CCC to single-B to BB.
What the last two days said
The most recent data argue for containment, for now. Between October 23 and October 27, CCC spreads eased from 13.56% to 13.21%, BB from 2.06% to 1.87%, single-B from 3.43% to 3.22%, and the total index from 3.38% to 3.18%.1, 2, 3, 4
Notice what did not change. The ratio actually rose over those two days, to 7.06 times, because BB tightened faster than CCC in percentage terms.1, 3 The relief rally helped the strongest names most. The weakest are still paying close to their peak.
How I read a split like this
I think the most common mistake in credit is treating the index as the market. It is an average. Averages are useful when the parts move together, and misleading when they do not. Right now they do not.
When I look at a credit market, I start with the bottom tier because it has the least room to hide. If the weakest borrowers can still refinance at a tolerable cost, the cycle is usually fine. If they cannot, the next question is how fast the problem travels up the ratings ladder. So far, the answer in 2026 is slowly. BB is wider than in August, but only modestly, and it gave back part of that move in the last two sessions.3
That is why I do not read this as a call that a default wave is coming. I read it as a market that has stopped giving every junk borrower the benefit of the doubt. That is healthy. It is also a change from most of the last three years, when the ratio sat near its median and investors were paid almost the same for very different risks.1, 3
I could be wrong if the CCC widening turns out to be a few large issuers repricing toward recovery value. In that case the average would look worse than the typical bond in the bucket. The way to check is simple: watch whether single-B follows. So far it has moved, but nowhere near as much.4
What this means if you own high yield
If you own a broad high-yield fund, you own some of each tier. Your yield looks attractive because the weakest tier is paying a lot. Your risk is also concentrated there. A fund that leans toward BB will behave very differently from one that leans toward CCC, even if both carry the same label.
That is the practical point. You are not choosing between junk and no junk. You are choosing how far down the ladder to go, and the market is now charging very different prices for each step. Read the holdings. Check the rating mix. Look at maturity walls.
Ask one question of any credit position you own. If the weakest borrowers in it had to refinance today, at today's rates, could they? The bond market is asking that question every day. You should too.
The case against this read
There are honest reasons to discount the signal. The CCC segment is a small share of the high-yield market, so a handful of distressed issuers can move its average a long way. A spread average can also widen because a few bonds move toward default pricing, not because the whole bucket is under pressure. And the FRED series only gives three years of daily history, so "widest on record" here means widest in that window, not widest ever.
Those are fair points. They argue for watching the spread of the spread, not for ignoring it. If this were only a few names, I would expect BB and single-B to look completely untouched. They are not. Both are wider than at the end of August, just by far less.3, 4
What to watch
Three things would tell me the split is turning into something broader. First, the BB spread moving back above its October 23 level of 2.06%.3 Second, the single-B spread moving back above 3.43%.4 Third, the total high-yield spread pushing toward the April 2025 peak of 4.61%.2 If those stay put while CCC stays wide, the market is doing what it is supposed to do: pricing the weakest borrowers on their own merits.
If they start to move, the conversation changes from credit selection to credit cycle.
Conclusion
The junk bond market is no longer a single trade. The best-rated borrowers are being treated as if 5% Treasury yields are survivable. The weakest are being treated as if they are not. The index average blends the two and comes out looking calm.
For anyone holding credit, that means the label on the fund matters less than what is inside it. Quality, maturity and refinancing needs are doing the work that the headline spread is not showing. Few understand this.
Notes
- [1] ICE BofA CCC & Lower US High Yield Index Option-Adjusted Spread (BAMLH0A3HYC), daily, via FRED: fred.stlouisfed.org/series/BAMLH0A3HYC . Values used: 13.56% (Oct 23, 2026), 13.21% (Oct 27, 2026), 11.37% (Apr 7, 2025), 10.26% (Aug 28, 2026), 8.38% (Jan 28, 2026). The CCC-to-BB ratio is a Lead-Lag Report calculation from notes 1 and 3.
- [2] ICE BofA US High Yield Index Option-Adjusted Spread (BAMLH0A0HYM2), daily, via FRED: fred.stlouisfed.org/series/BAMLH0A0HYM2 . Values used: 3.38% (Oct 23, 2026), 3.18% (Oct 27, 2026), 2.60% (Aug 28, 2026), 4.61% (Apr 7, 2025).
- [3] ICE BofA BB US High Yield Index Option-Adjusted Spread (BAMLH0A1HYBB), daily, via FRED: fred.stlouisfed.org/series/BAMLH0A1HYBB . Values used: 1.50% (Aug 28, 2026), 2.06% (Oct 23, 2026), 1.87% (Oct 27, 2026).
- [4] ICE BofA Single-B US High Yield Index Option-Adjusted Spread (BAMLH0A2HYB), daily, via FRED: fred.stlouisfed.org/series/BAMLH0A2HYB . Values used: 2.72% (Aug 28, 2026), 3.43% (Oct 23, 2026), 3.22% (Oct 27, 2026).
- [5] Market Yield on U.S. Treasury Securities at 10-Year Constant Maturity (DGS10), via FRED: fred.stlouisfed.org/series/DGS10 . 5.00% on Oct 26, 2026.
- [6] Market Yield on U.S. Treasury Securities at 2-Year Constant Maturity (DGS2), via FRED: fred.stlouisfed.org/series/DGS2 . 4.68% on Oct 26, 2026.
- [7] ICE BofA CCC & Lower US High Yield Index Effective Yield (BAMLH0A3HYCEY), via FRED: fred.stlouisfed.org/series/BAMLH0A3HYCEY . 17.86% on Oct 27, 2026.