Defensives Beat the S&P 500 by 8% in a Month. Eleven of 15 Times, a Drawdown Followed.
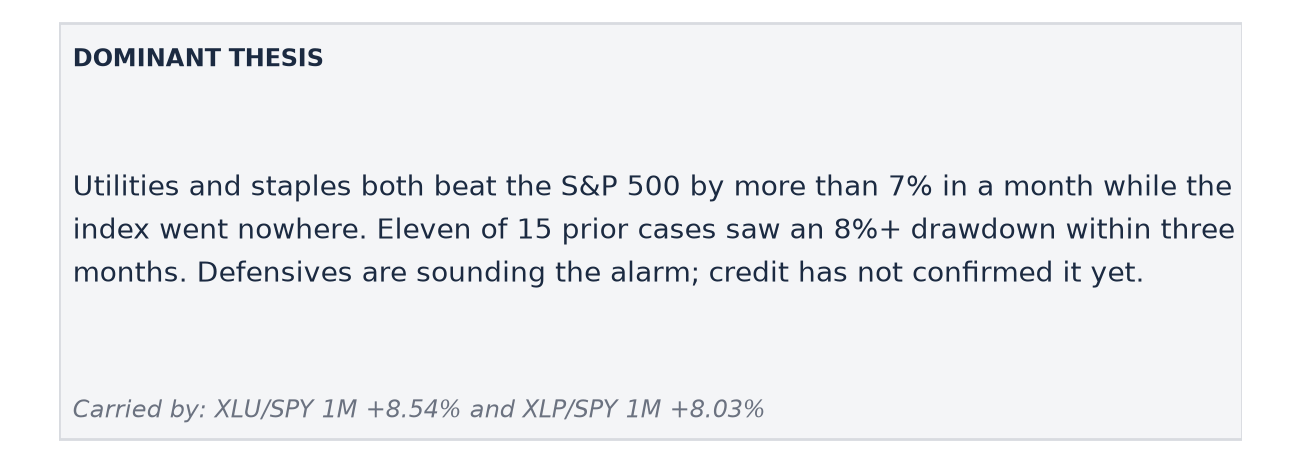
Utilities and staples both beat a flat S&P 500 by more than 7% in a month. In 11 of 15 prior cases an 8%+ drawdown followed within three months. Credit has not confirmed yet.

Today’s Lead-Lag Report post is sponsored by Evoke

The future is highly uncertain, with potential challenges in growth, inflation, and geopolitics, making diversification crucial.
Most investors are unknowingly underdiversified. A traditional 60/40 portfolio is 98% correlated to the stock market, potentially exposing investors to more risk than they realize. The S&P 500 historically experienced extended periods of underperformance, including:
1. Underperforming cash from 1966 to 1982 during inflationary times
2. A 0% average return from 1929 to 1949
3. A lost decade prior to the recent 15-year bull market
Historical bear markets often started with high valuations. Given current high valuations, we may be on the verge of another challenging period for U.S. equities.
Risk parity seeks to offer a more diversified allocation than conventional mixes. By spreading risk across global equities, Treasuries, TIPS, and commodity producers and gold, investors can maintain a low-cost, tax-efficient passive mix seeking:
1. Equity-like long-term expected returns
2. Lower risk than stocks
3. Reduced risk of a lost decade
To learn more about the RPAR Risk Parity ETF, visit rparetf.com.
Before investing you should carefully consider the Fund’s investment objectives, risks, charges, and expenses. This and other information is in the prospectus. A prospectus may be obtained by clicking here. Please read the prospectus carefully before you invest.
Investing involves risk. Principal loss is possible.
Distributed by Foreside Fund Services, LLC.
Data source: Bloomberg.
DISCLAIMER – PLEASE READ: This is sponsored advertising content for which Lead-Lag Publishing, LLC has been paid a fee. The information provided in the link is solely the creation of Evoke Advisors. Lead-Lag Publishing, LLC does not guarantee the accuracy or completeness of the information provided in the link or make any representation as to its quality. All statements and expressions provided in the link are the sole opinion of Evoke Advisors and Lead-Lag Publishing, LLC expressly disclaims any responsibility for action taken in connection with the information provided in the link.
Defensives Beat the S&P 500 by 8% in a Month. Eleven of 15 Times, a Drawdown Followed.
Utilities and staples both lapped a flat index, communication services broke to -2.78 sigma, and credit sits on its +1 sigma line as the Fed meets.
MICHAEL A. GAYED, CFA
OCT 28, 2026
KEY HIGHLIGHTS
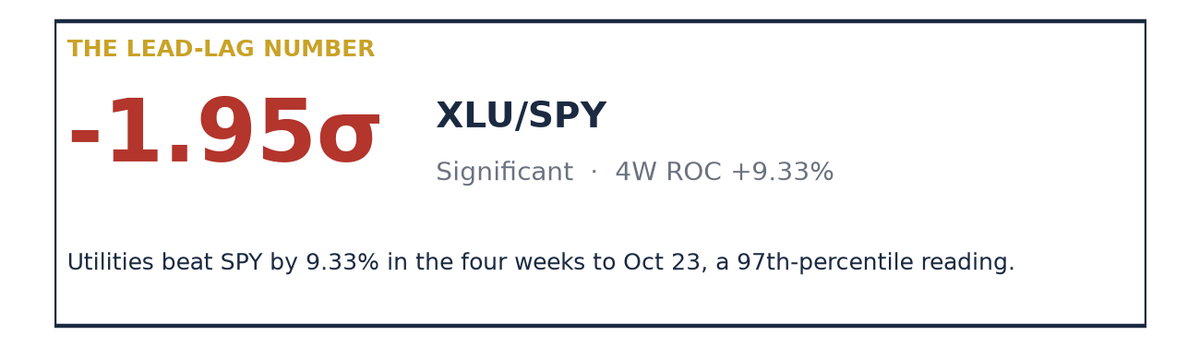
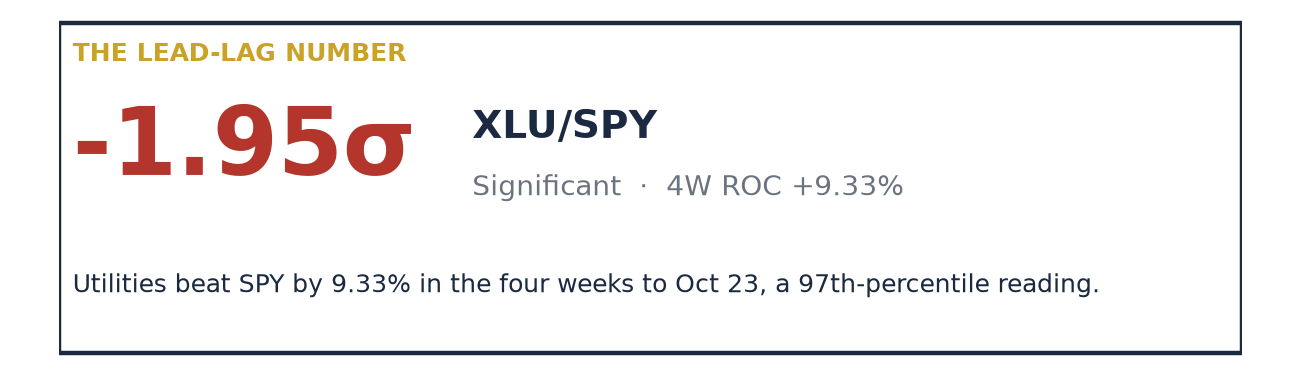
- Utilities beat the S&P 500 by 8.54% over the past month and staples by 8.03%, while SPY itself was down 0.78%. The utilities four-week rate of change hit +9.33% on the October 23 weekly close, a 97th-percentile reading since 1999.
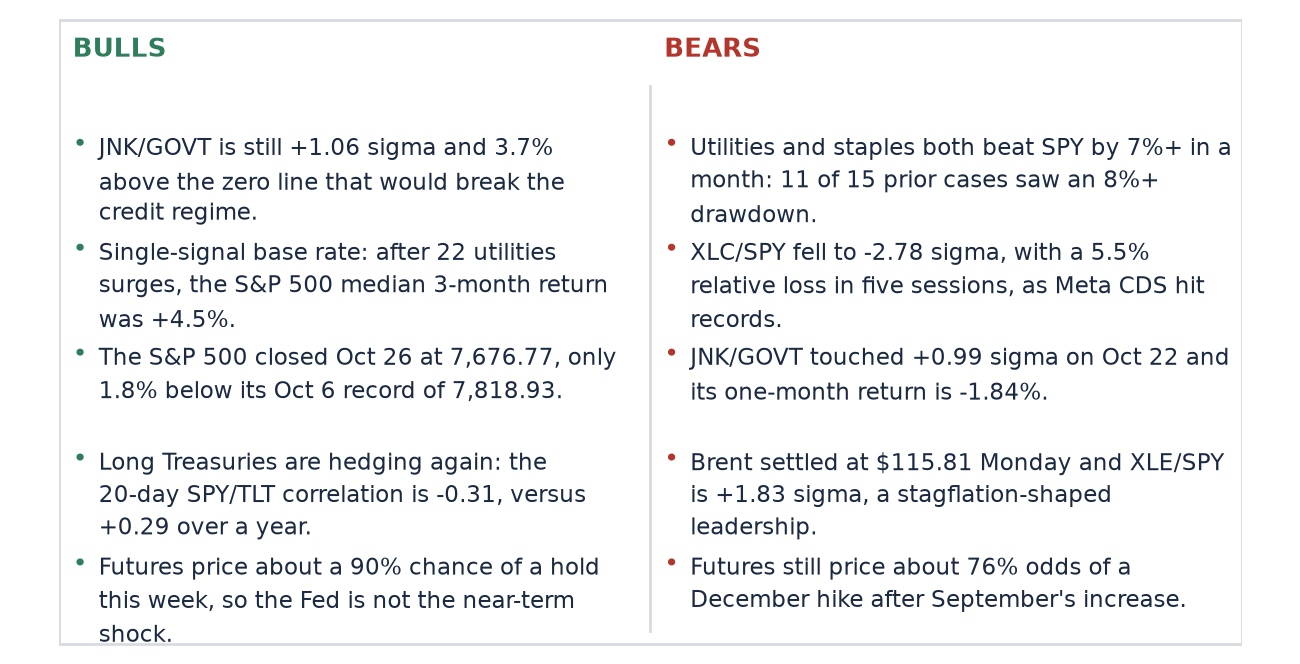
- When utilities and staples have both beaten SPY by 7% or more in a month, the S&P 500 suffered a drawdown of 8% or worse within three months in 11 of 15 cases since 1999. The base rate for any random three-month window is 21%.
- Credit is the missing confirmation. JNK/GOVT is +1.06 sigma, closed at +0.99 on October 22, and needs a 3.7% decline to reach zero sigma.
- Communication services broke to -2.78 sigma against SPY after Meta, Netflix and the telecoms fell in the same week. Run #34 scored three of six with the Fed deciding on Wednesday.
The S&P 500 finished Monday at 7,676.77, 1.8% below its October 6 record of 7,818.93 per FRED and AP. Over the same month, utilities beat it by 8.54% and staples by 8.03%. An index near its high with defensives sprinting past it is a contradiction, and this edition argues the defensives are telling the truth. The pair has done this 15 times since 1999, and 11 of those were followed by an 8% or larger S&P 500 drawdown within three months. My thesis is that the next three months carry far more turbulence than the index level implies, and that credit is the one market that has not yet agreed.
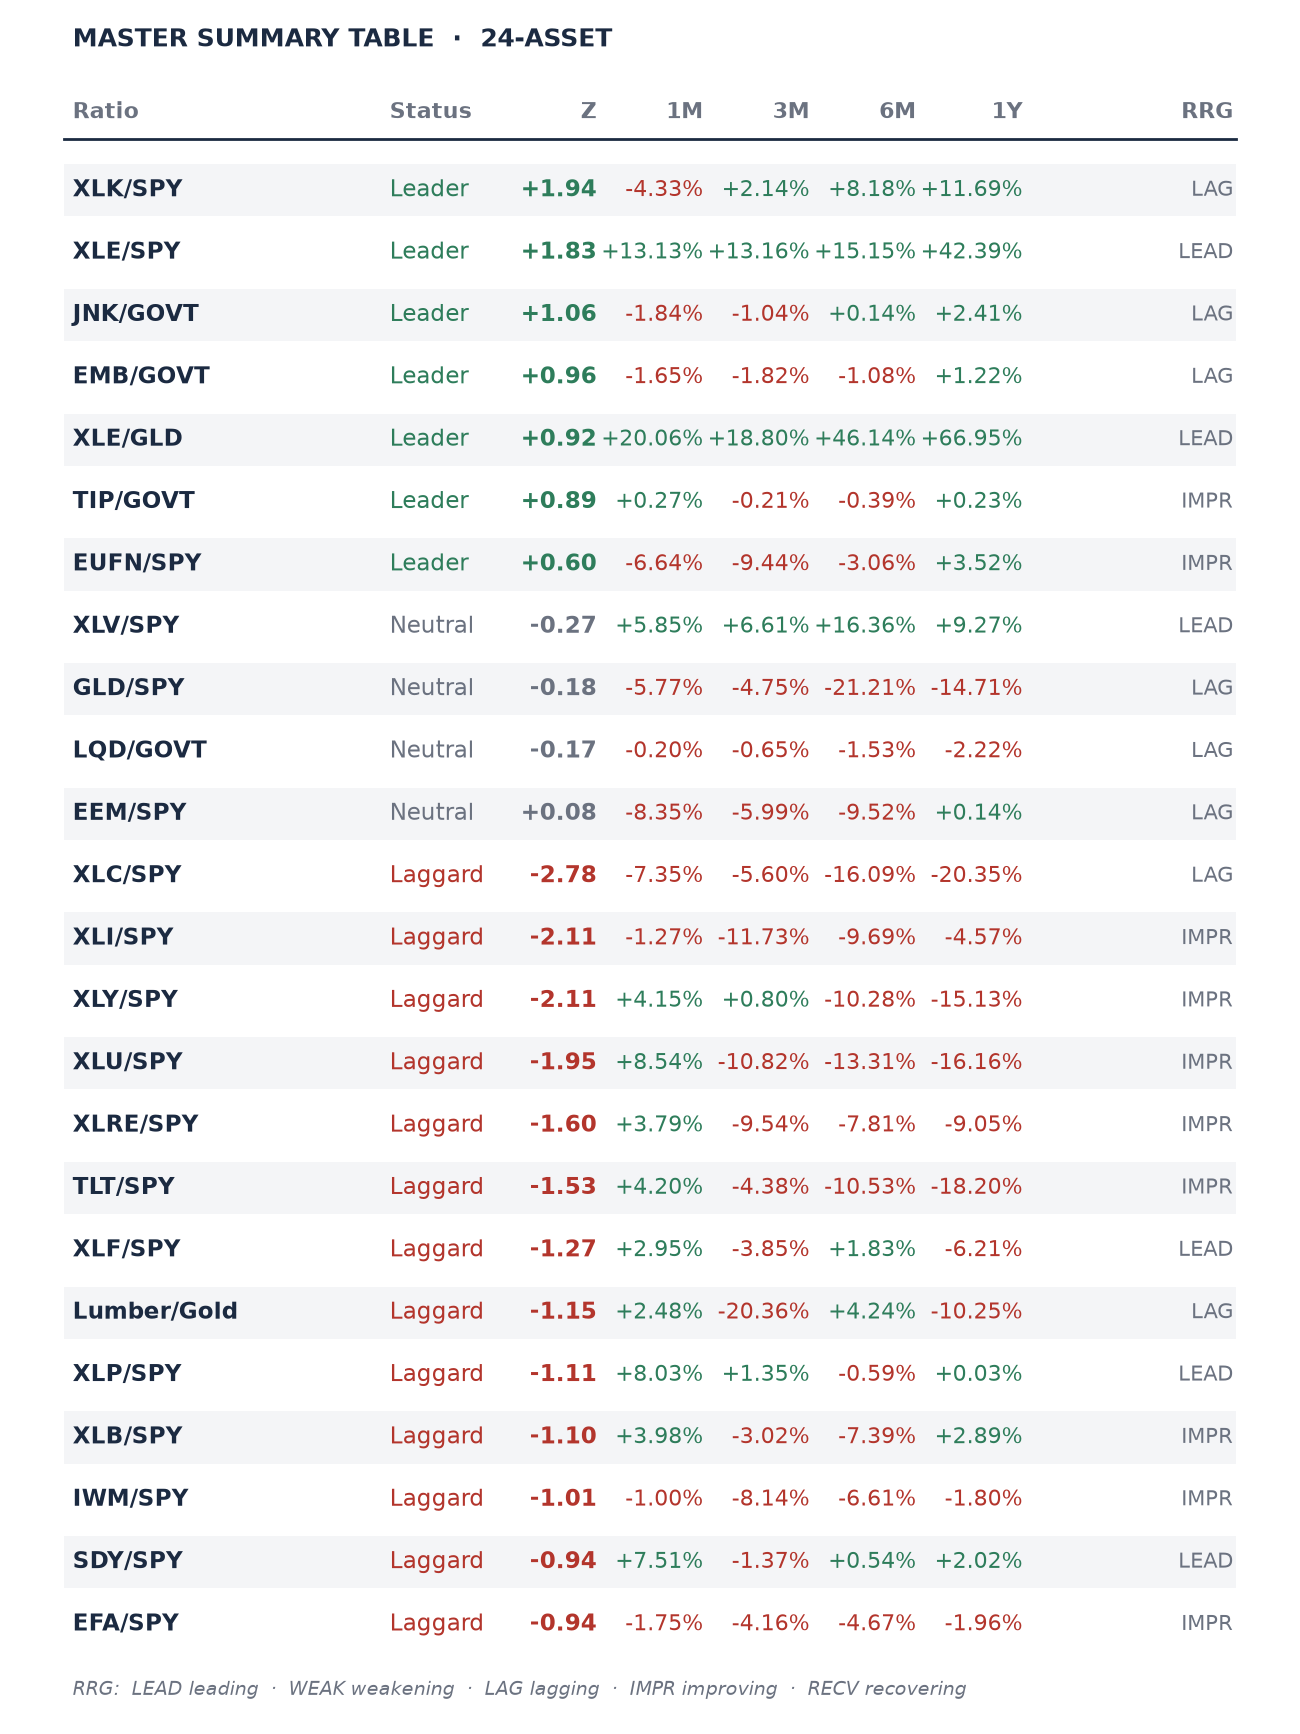
Update: What Moved Through Tuesday's Close
This edition was built on the October 26 close. Here is what Tuesday, October 27 changed, ahead of the Fed's decision this afternoon. All ratio readings below are yfinance daily closes through October 27.
The index. The S&P 500 rose 0.6% to 7,722.60 and the Nasdaq Composite rose 1.2%, with AI and chip stocks doing the lifting while most S&P 500 stocks fell, per AP and FRED. That leaves the index 1.23% below its October 6 record of 7,818.93, per Portfolio Terminal.
The joint signal cooled. Staples gave back ground. XLP fell 0.92% on the day, and the XLP/SPY 21-session return dropped to +5.36% from +8.03%, below the +7% line the screen uses. XLU/SPY held at +8.60%. The October 22 trigger still counts as an episode, but the condition is no longer active as of Tuesday's close. Defensive sectors, including staples and REITs, lagged on the day, per eOption.
Credit moved against me. JNK/GOVT rose to +1.24 sigma from +1.06, and its one-month return improved to -1.21% from -1.84%. Credit was the one market I said had not agreed with the defensive read, and on Tuesday it leaned the other way. One day does not settle it, but you should know the confirmation I was waiting for moved further off.
Energy cooled, tech firmed. XLE fell 2.05% and XLE/SPY slipped to +1.54 sigma from +1.83, just above the +1.5 line in this week's forward call. Brent settled down 1.67% at $113.88 and WTI down 1.83% at $99.90, per Reuters via the Kansas City Star. XLK/SPY rose back to +2.09 sigma from +1.94. XLC/SPY fell further, to -2.88 sigma from -2.78.
The hedge held. The 20-day correlation between SPY and TLT daily returns moved to -0.35 from -0.31, so long Treasuries are still hedging stocks.
Falsifiers and calls. None of the three falsifiers below has triggered. All six forward calls for Run #36 are holding as of Tuesday: XLE/SPY +1.54 sigma, XLC/SPY -2.88, TLT/SPY one-month +3.55%, JNK/GOVT +1.24, XLP/SPY one-month +6.44%, XLK/SPY +2.09. The tightest is energy, 0.04 sigma above its line.
My read after Tuesday: the path-risk thesis stands, but with weaker support than on Monday. Staples dropped out of the joint signal and credit improved. If JNK/GOVT keeps rising while staples keep fading, I will have to treat last week as a rates trade, which is the counter-case below.
The Fed, Wednesday afternoon. The FOMC held the federal funds target range at 3.75% to 4% by a 10 to 2 vote, per the Federal Reserve statement. Governor Lisa D. Cook and Cleveland Fed President Beth M. Hammack dissented in favor of a quarter-point hike. It was Cook's first dissent since joining the Fed in 2022, and Dallas President Lorie Logan and Minneapolis President Neel Kashkari, who dissented for a hike in July, voted with the majority, per CNBC. A hold with two hawkish dissents keeps a December move on the table, which matters for the rates-trade counter-case below.
Previously on Leaders-Laggards
Run #34 published October 21, a week after Run #33, with the thesis that tech's slide from three sigma was a pause as long as credit's level held. Scoring its six forward calls against the Monday, October 26 close from yfinance daily data. The canonical ledger lives in the Forward Call Scorecard.
- XLK/SPY Z-score stays above +1.0 sigma: read +1.94. [CORRECT]
- JNK/GOVT Z-score stays above 0.0 sigma: read +1.06. [CORRECT]
- XLE/SPY 1M return stays positive: read +13.13%. [CORRECT]
- XLU/SPY Z-score stays below -2.0 sigma: read -1.95. [MISS]
- TLT/SPY 1M return stays negative: read +4.20%. [MISS]
- IWM/SPY Z-score stays below -1.25 sigma: read -1.01. [MISS]
Three of six, after six of six in Run #33. The three misses share one cause, and I should name it plainly: I assumed the ten-year near 5.15% would keep pressure on everything rate-sensitive. Instead the ten-year fell to 4.99%, and utilities, long Treasuries and small caps all rallied on it. The calls that held were the ones tied to credit and energy. None of Run #34's three falsifiers triggered: JNK/GOVT stayed above zero, XLK/SPY stayed above +1.0, and the ten-year never closed above 5.33% before the Fed. The pause thesis survived. What changed is that the defensive side of the table moved far faster than I expected, and that deserves its own thesis this week.
Streak tracking
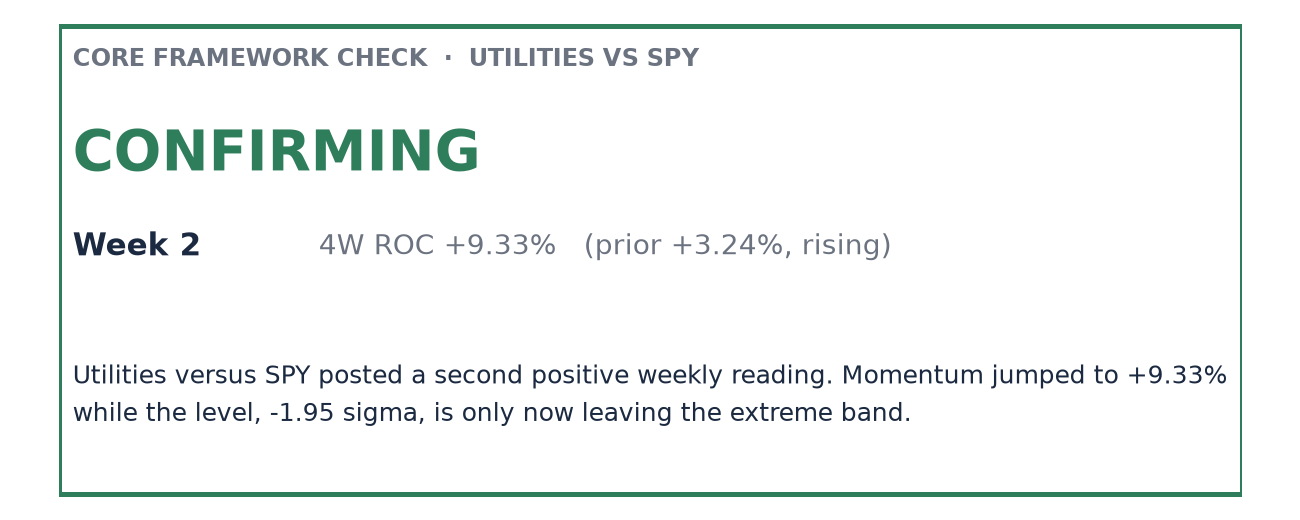
- XLU/SPY: second straight positive weekly 4W ROC, +3.24% then +9.33%; the Z-score left the extreme band at -1.95.
- JNK/GOVT: third consecutive negative one-month return at -1.84%; level +1.06 sigma after a +0.99 close on October 22.
- XLC/SPY: new extreme at -2.78 sigma, the deepest reading in the table.
- XLE/SPY: leader streak extended to +1.83 sigma, 1M +13.13%.
- XLK/SPY: holds +1.94 sigma for a second week, with the month negative at -4.33%.
The Thesis: Defensives Are Pricing Turbulence the Index Is Not
Start with the single signal. I took the ratio of the Utilities Select Sector SPDR (XLU) to the S&P 500 ETF (SPY), sampled every Friday since 1999, and measured its four-week rate of change. The October 23 reading of +9.33% is higher than 97.4% of the 1,398 weekly readings. Readings at or above +8%, de-clustered so a single episode counts once, have happened 22 times before.
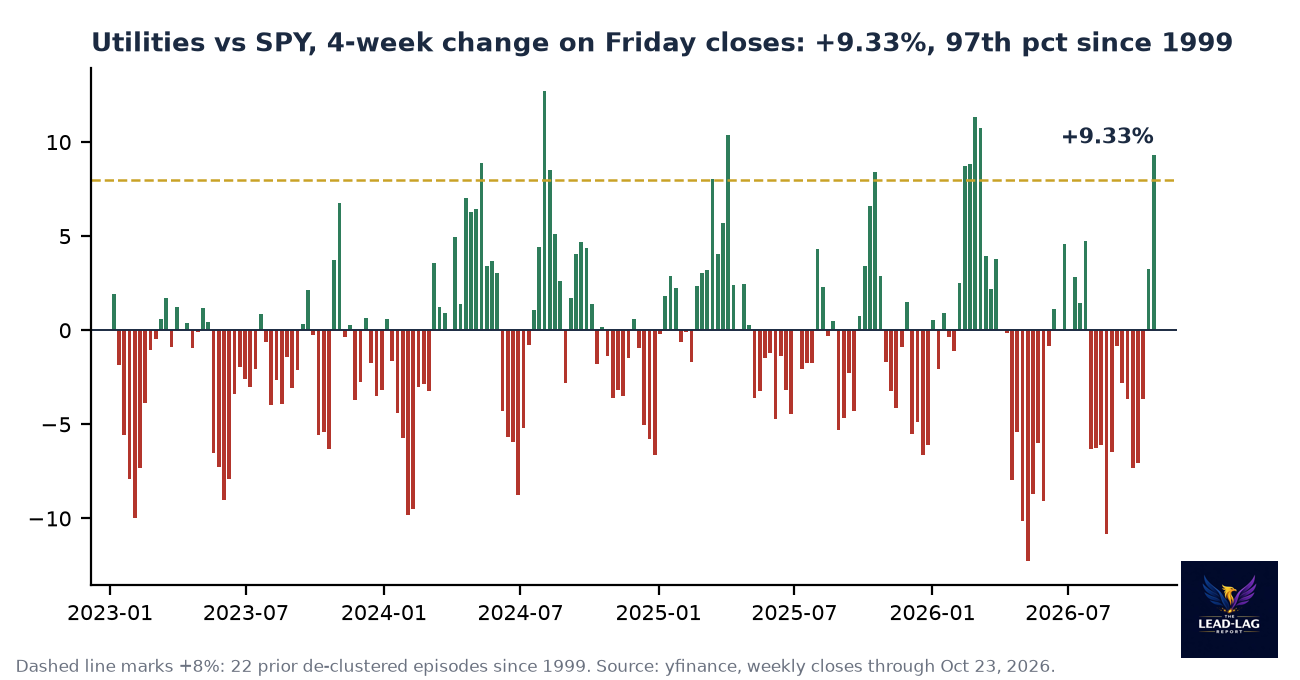
Utilities just posted their sharpest four-week gain against SPY since the March 2026 surge. Source: yfinance weekly closes through October 23, 2026.
On its own, that signal is not a crash call. After the 22 prior episodes, SPY rose a median 4.52% over the next 63 trading days, against 3.51% for every 63-session window since 2000. It was negative in 8 of 22, against 30.8% unconditionally. What changes is the path: 9 of the 22, or 41%, included an 8% or deeper drawdown at some point inside the three months, about double the 21.3% rate for all windows. Utilities themselves gave the gain back, with a median XLU/SPY return of -3.67% over the following three months.
The stronger evidence comes from asking for two defensive sectors at once. I screened for every day when both XLU/SPY and the Consumer Staples Select Sector SPDR (XLP) against SPY had 21-session returns of +7% or more, de-clustered at 91 days. That condition fired on October 22, and there are 15 completed prior episodes since 1999.
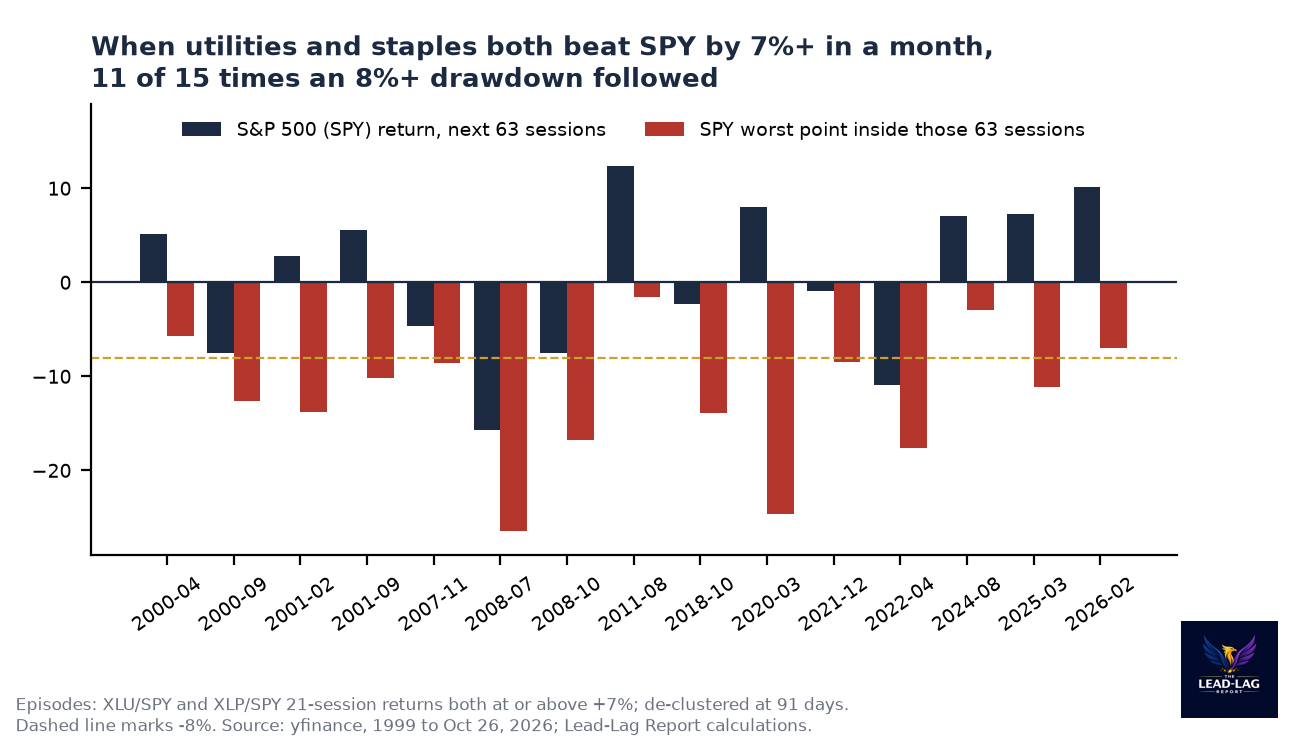
When utilities and staples lead together, the drawdown usually comes even when the three-month return ends positive. Source: yfinance, 1999 to October 26, 2026.
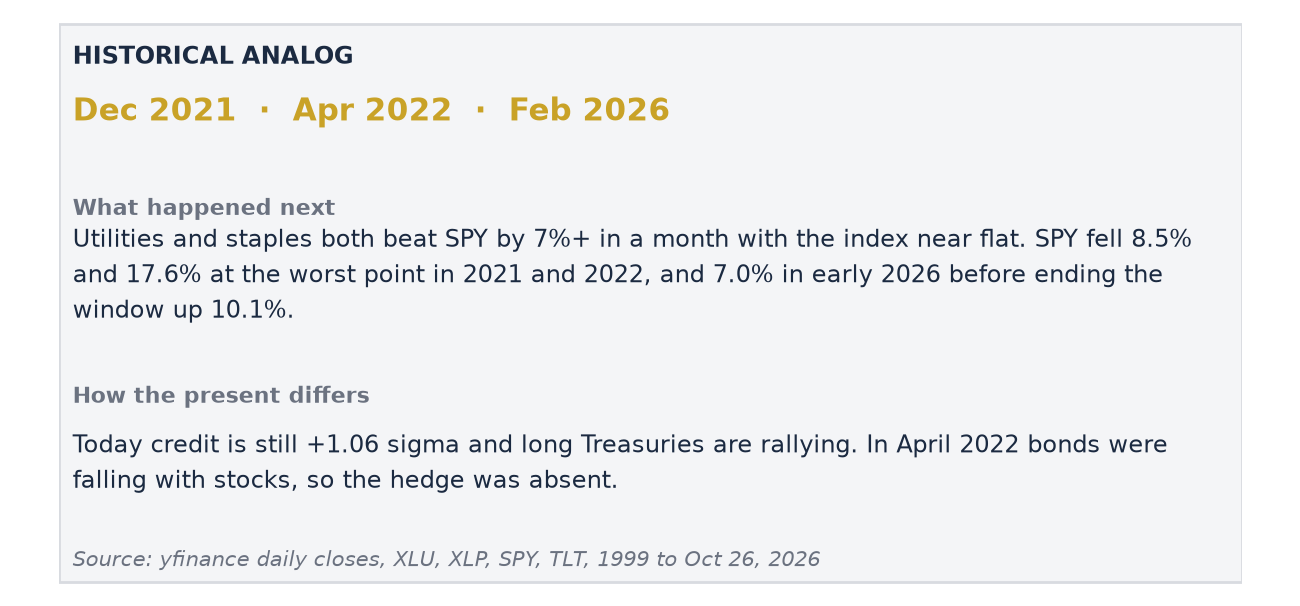
Eleven of the 15 saw the S&P 500 fall 8% or more at some point within 63 sessions: September 2000, February 2001, September 2001, November 2007, July 2008, October 2008, October 2018, March 2020, December 2021, April 2022 and March 2025. The median three-month return was still +2.82%, and 8 of 15 ended the window positive, so the joint signal is about path risk more than destination. Seventy-three percent against a 21% base rate is the gap that carries this edition.
The sample has two weaknesses and both matter. First, seven of the 15 episodes come from the 2000 to 2002 and 2007 to 2008 bear markets, when the index was already falling and a drawdown was close to guaranteed. Second, in most episodes SPY had already dropped before the signal fired. Today SPY is flat over the prior 21 sessions, at -0.03%. Only four episodes started with the index down less than 3% over the prior month: April 2000, December 2021, April 2022 and February 2026. Two of those four saw an 8% drawdown. Two of four is a coin flip on a tiny sample, which is still more than double the base rate, and it is the honest number to hold in mind.
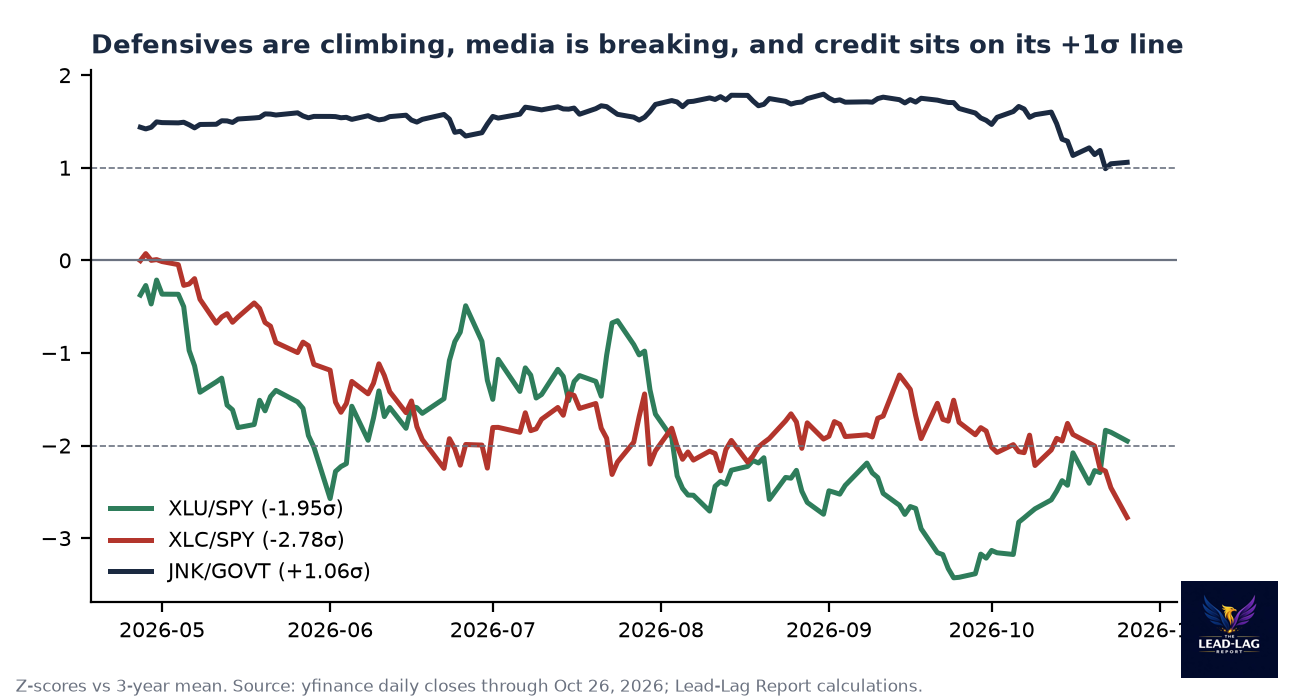
Defensives are climbing, media is breaking, and credit sits right on its +1 sigma line. Source: yfinance daily closes through October 26, 2026.
The cross-asset picture explains why the defensive bid is credible this time. The trigger was the AI financing scare. Meta fell more than 9% for the week after reporting negative free cash flow for the first time, and its five-year credit default swap spread hit an all-time high on Thursday, per CNBC. The Nasdaq Composite fell almost 3% on October 22, its largest one-day drop in four months, per Reuters. Money went to utilities, staples, health care and Treasuries.
Two details separate this from a generic risk-off week. Gold fell 3.13% while Treasuries rallied, so this was not a currency or systemic scare. And long Treasuries went back to hedging equities. The 20-day correlation of daily returns between SPY and the iShares 20+ Year Treasury Bond ETF (TLT) is -0.31, against +0.26 over 60 sessions and +0.29 over a year.

Long Treasuries are hedging stocks again for the first time since July. That is the bond market treating the selloff as a growth scare, not an inflation scare. Source: yfinance through October 26, 2026.
A negative stock-bond correlation is what lets defensives and duration rally together, and it is what made this week's rotation coherent. I also rechecked sector dispersion. The mean absolute Z-score across the 11 sector ratios against SPY is 1.33, unchanged from a week ago, with eight of 11 beyond 1 sigma. The leadership did not broaden. It flipped ends.
Leaders: Ratios Where the Denominator Is Losing
XLK/SPY · Signal strength: +1.94σ Significant · RRG: lagging
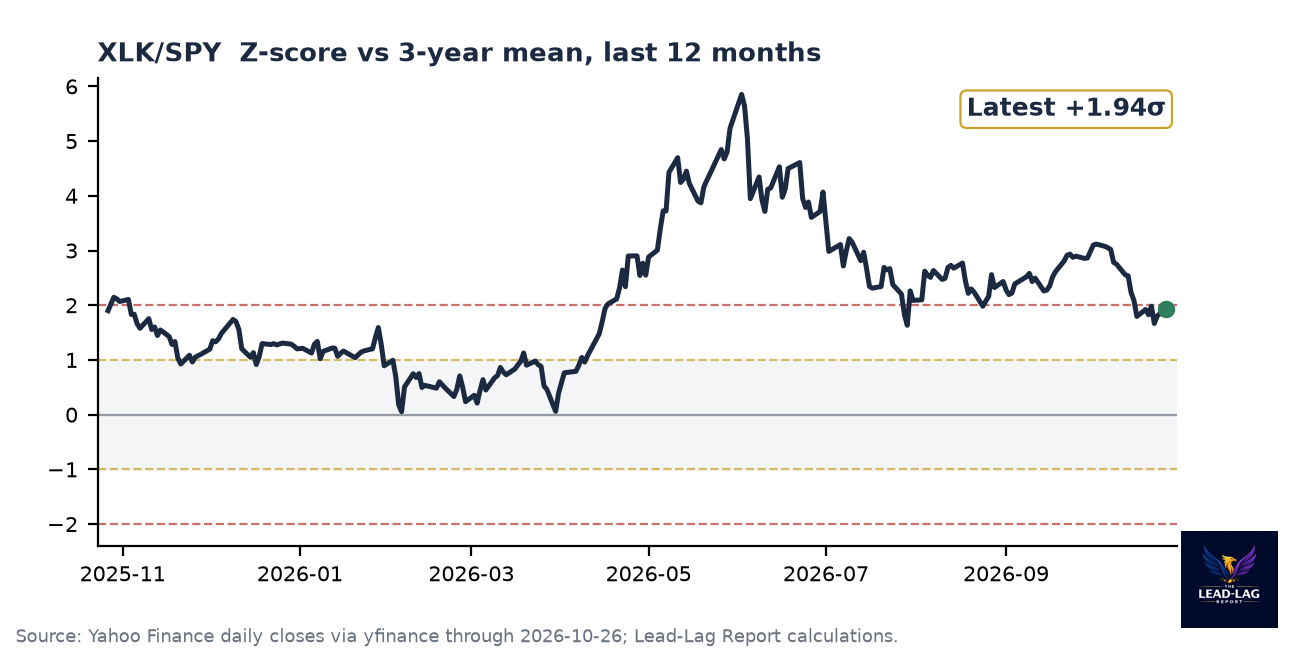
Plain-English: still a leader on level, with a negative month.
Returns: 1M -4.33% · 3M +2.14% · 6M +8.18% · 1Y +11.69%
Tech sits at +1.94 sigma, almost unchanged from +1.92, but the one-month return is -4.33%. The AI-capex selloff hit chips and memory hardest, with semiconductors down more than 15% this month per CNBC. The level needs a 6.5% relative decline to reach +1.0 sigma, so Run #34's call held with room.
XLE/SPY · Signal strength: +1.83σ Significant · RRG: leading
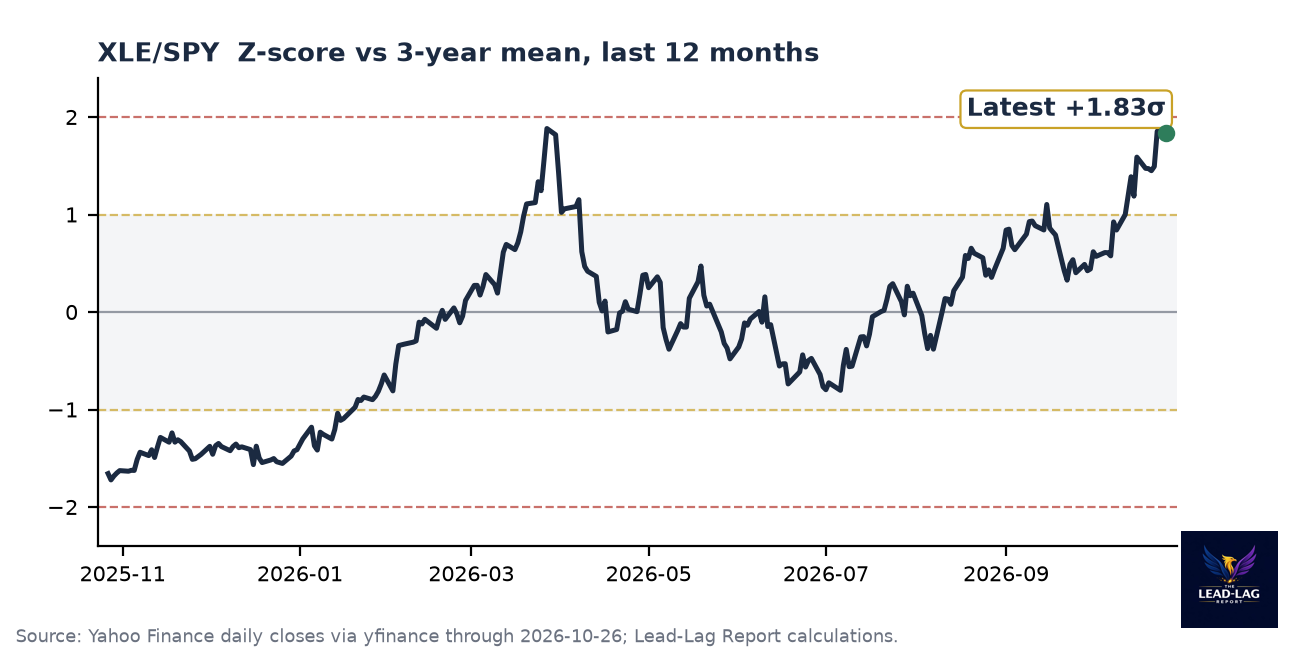
Plain-English: the strongest leader in the table and accelerating.
Returns: 1M +13.13% · 3M +13.16% · 6M +15.15% · 1Y +42.39%
Energy jumped to +1.83 sigma from +1.47, with +13.13% on the month and +42.39% over a year. Brent settled at $115.81 and WTI at $101.76 on Monday per CNBC, after Brent gained 6% last week on Houthi attacks on Saudi infrastructure. This is the cleanest leader in the table and the least diversifying one.
JNK/GOVT · Signal strength: +1.06σ Notable · RRG: lagging
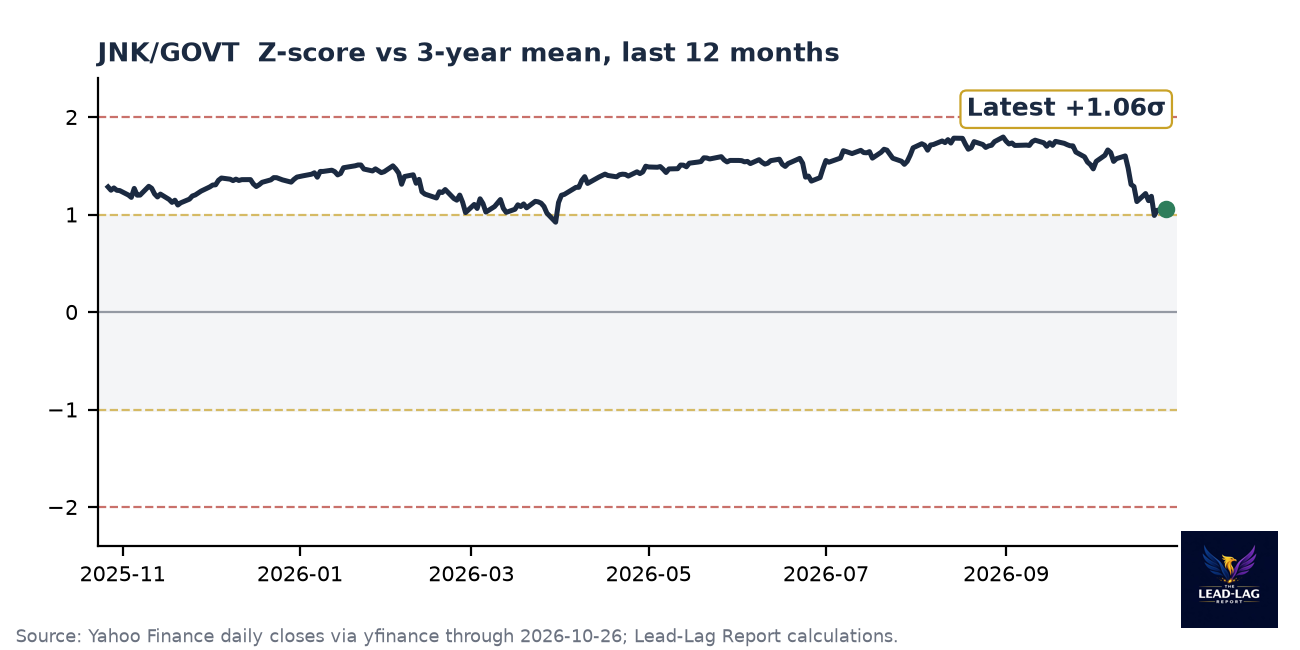
Plain-English: a leader sitting on its +1 sigma line.
Returns: 1M -1.84% · 3M -1.04% · 6M +0.14% · 1Y +2.41%
High yield against Treasuries is +1.06 sigma, down from +1.21, and it closed at +0.99 on October 22, its first close below +1.0 since March 30. The one-month return is -1.84%. Covered in full below.
EMB/GOVT · Signal strength: +0.96σ Weak · RRG: lagging
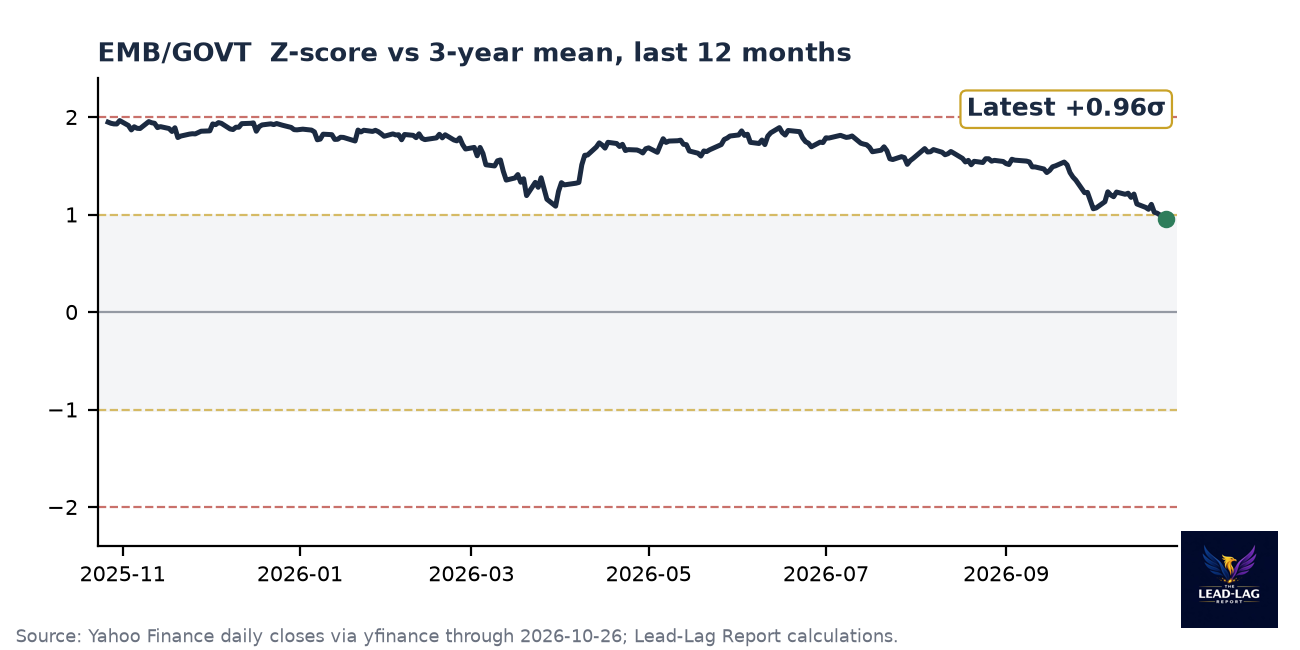
Plain-English: slipped just under +1 sigma, momentum negative.
Returns: 1M -1.65% · 3M -1.82% · 6M -1.08% · 1Y +1.22%
Emerging-market dollar debt slipped to +0.96 sigma from +1.07, with -1.65% on the month. It lost the +1.0 line mostly on the Treasury leg.
XLE/GLD · Signal strength: +0.92σ Weak · RRG: leading
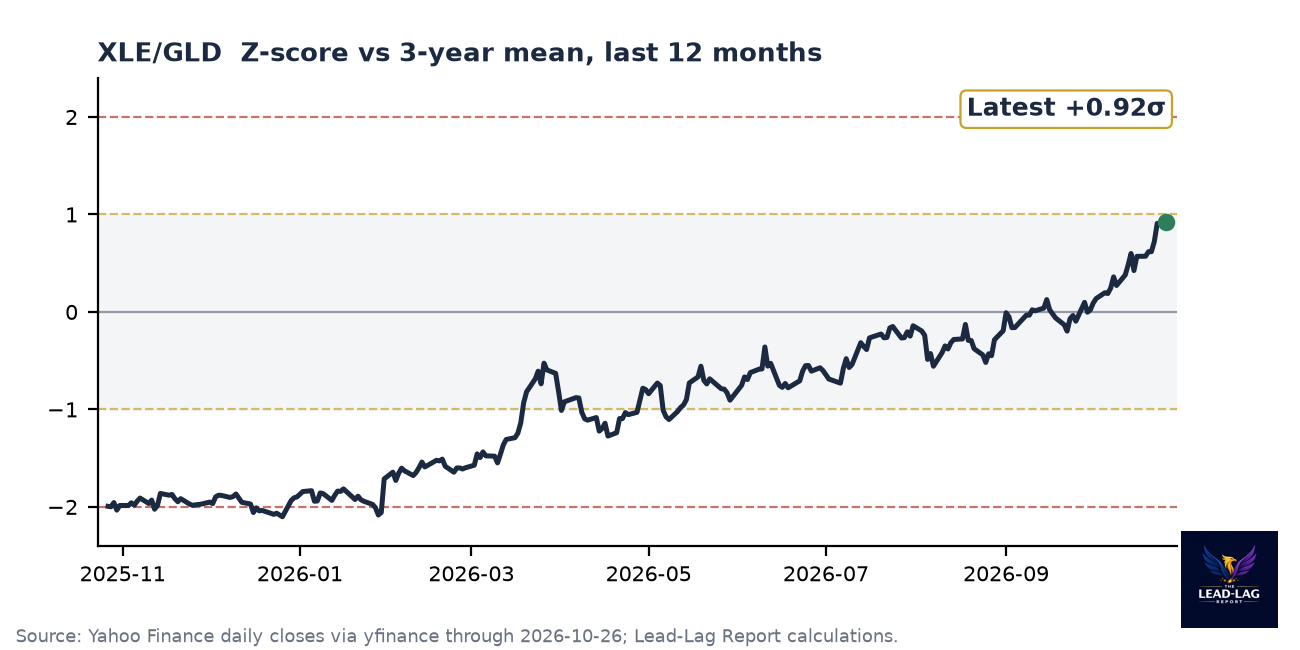
Plain-English: energy is crushing gold on every horizon.
Returns: 1M +20.06% · 3M +18.80% · 6M +46.14% · 1Y +66.95%
Energy against gold moved to +0.92 sigma from +0.57, with +20.06% on the month and +66.95% over a year. Gold had its biggest weekly decline since June per Moneycontrol while oil rose, so both legs pushed the same way. It is the cleanest inflation-impulse ratio we track.
TIP/GOVT · Signal strength: +0.89σ Weak · RRG: improving
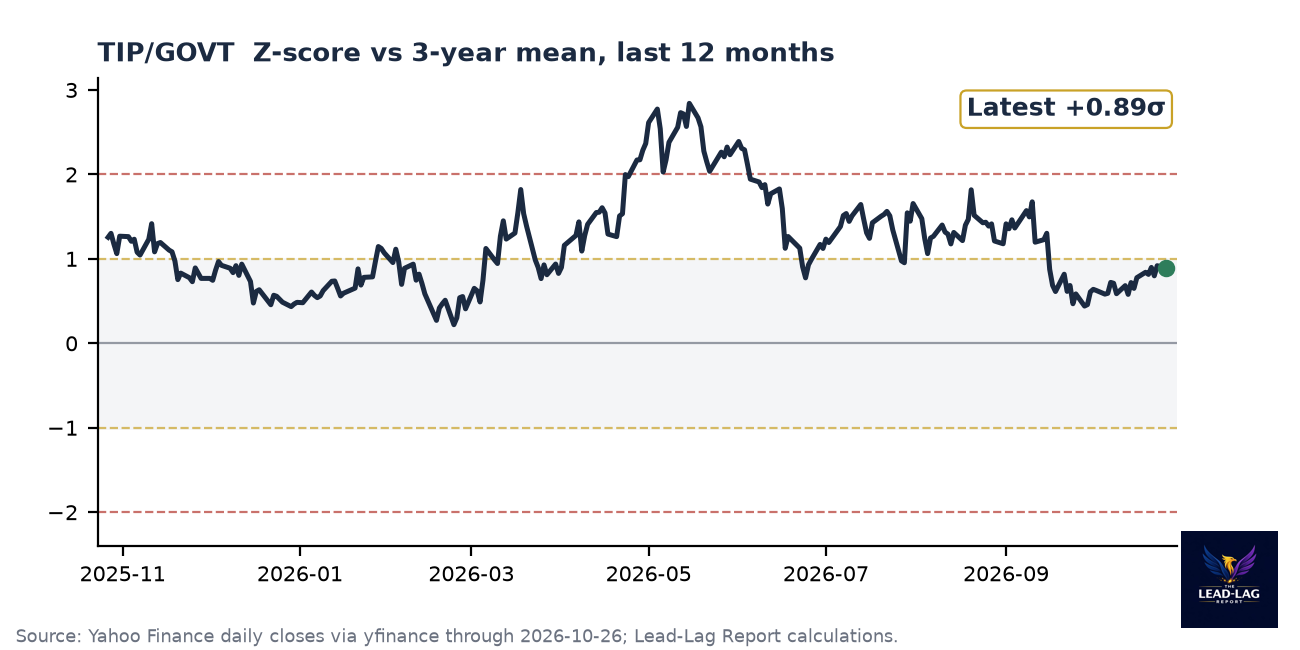
Plain-English: a mild leader with no real momentum.
Returns: 1M +0.27% · 3M -0.21% · 6M -0.39% · 1Y +0.23%
Inflation-protected Treasuries edged to +0.89 sigma from +0.84, with +0.27% on the month. Weak leader, no signal.
EUFN/SPY · Signal strength: +0.60σ Weak · RRG: improving
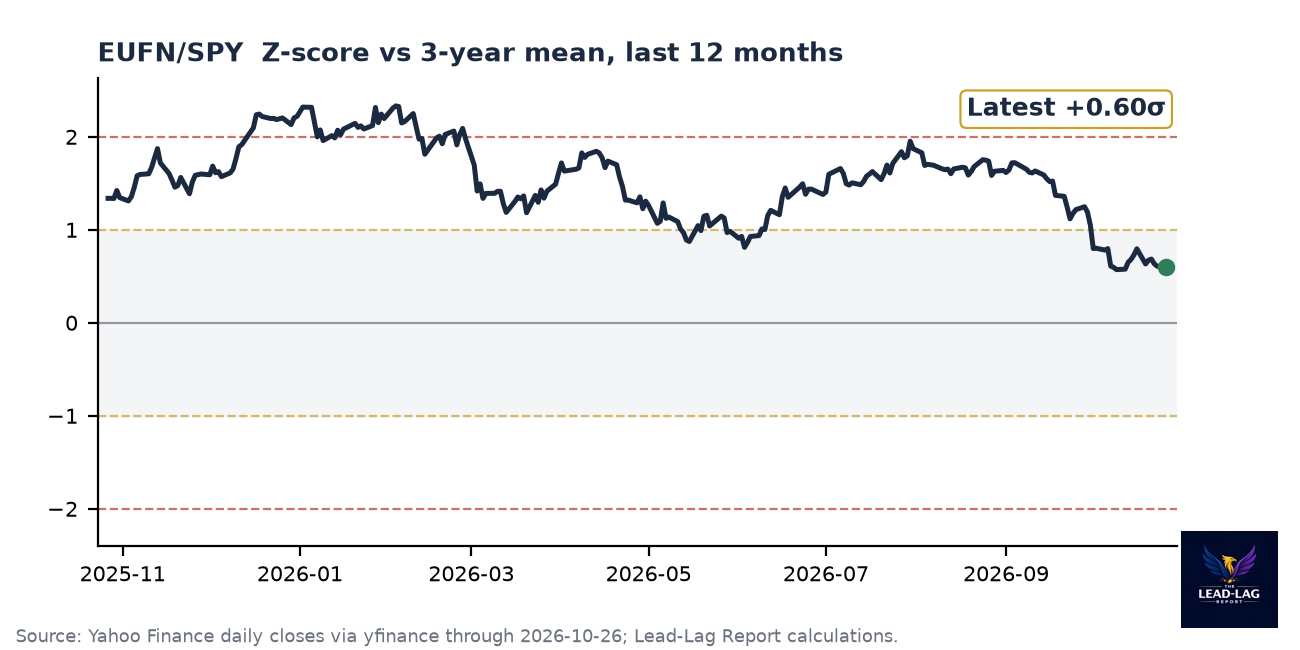
Plain-English: a leader on paper, a loser on the month.
Returns: 1M -6.64% · 3M -9.44% · 6M -3.06% · 1Y +3.52%
European financials are +0.60 sigma, with -6.64% on the month and -9.44% over three. The level is a leader only because the three-year mean is low. Discount it.
Neutral: Ratios Without a Signal
EEM/SPY · Signal strength: +0.08σ Background · RRG: lagging
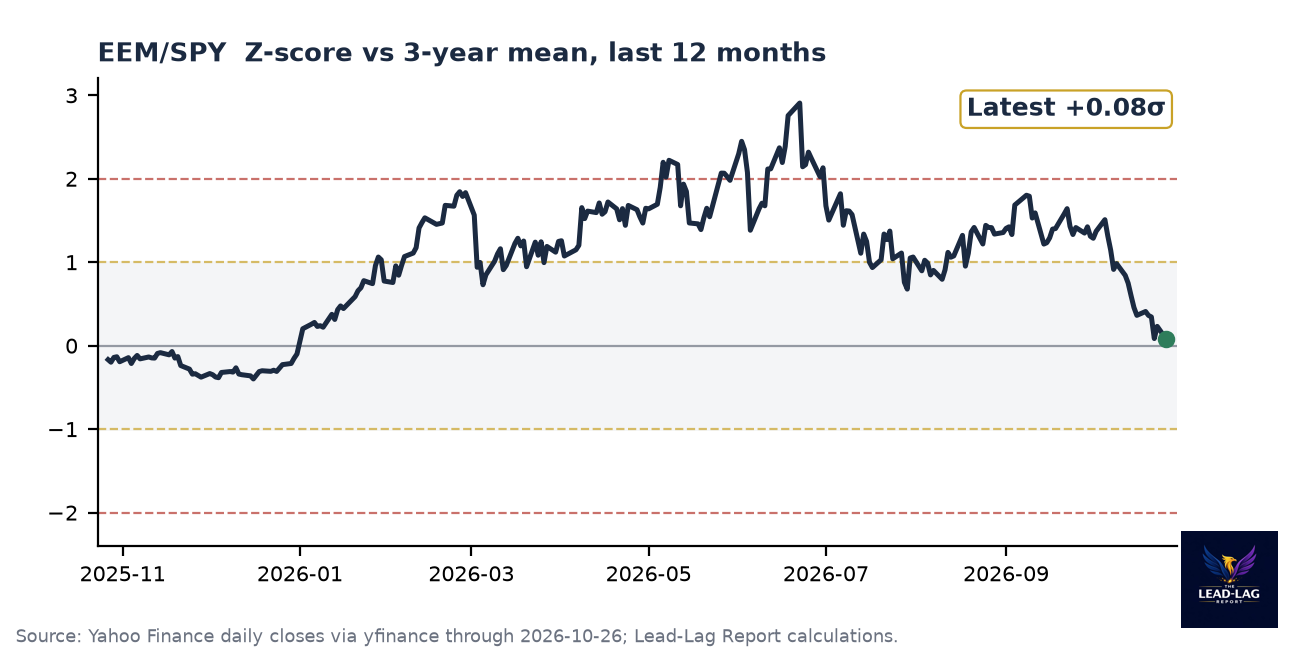
Plain-English: dead center on level, worst month among the equity ratios outside media.
Returns: 1M -8.35% · 3M -5.99% · 6M -9.52% · 1Y +0.14%
Emerging markets fell to +0.08 sigma from +0.41, with -8.35% on the month. AP noted Brazilian stocks tumbling Monday per AP. Neutral level, ugly momentum, RRG lagging.
LQD/GOVT · Signal strength: -0.17σ Background · RRG: lagging
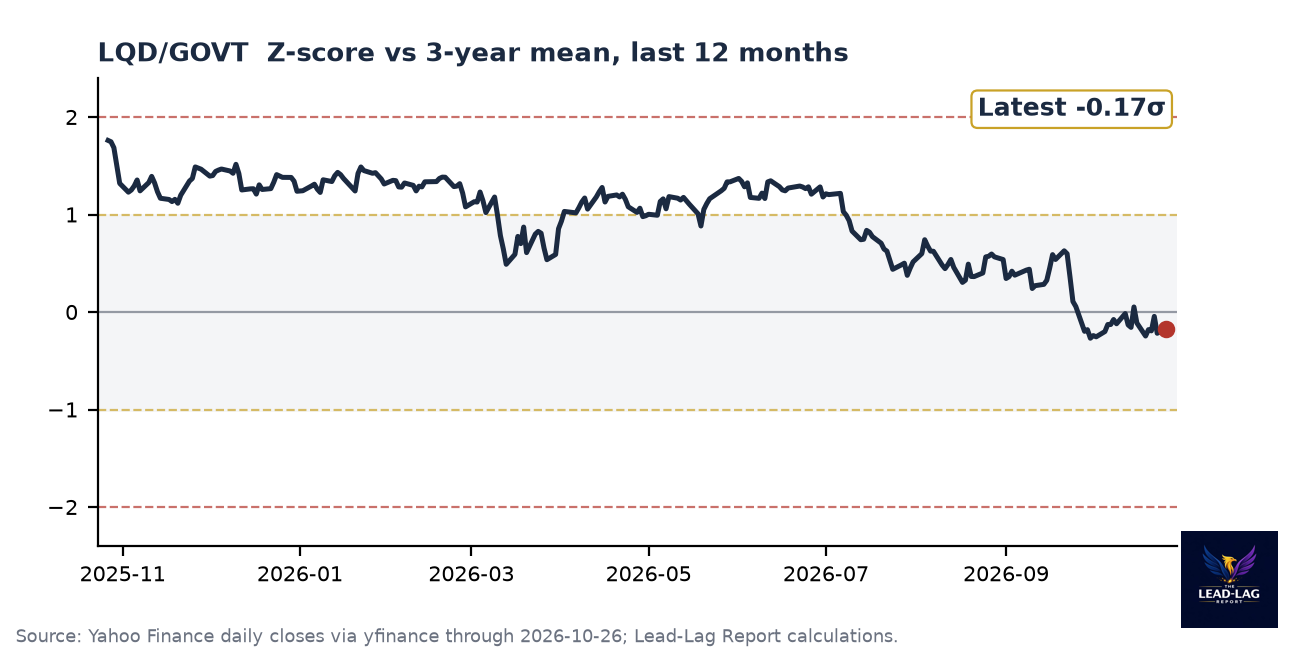
Plain-English: investment grade is flat against Treasuries.
Returns: 1M -0.20% · 3M -0.65% · 6M -1.53% · 1Y -2.22%
Investment grade against Treasuries is -0.17 sigma, essentially flat on the month at -0.20%. Spreads are not the story in high grade yet, even with Meta's credit default swaps at record wides per CNBC.
GLD/SPY · Signal strength: -0.18σ Background · RRG: lagging
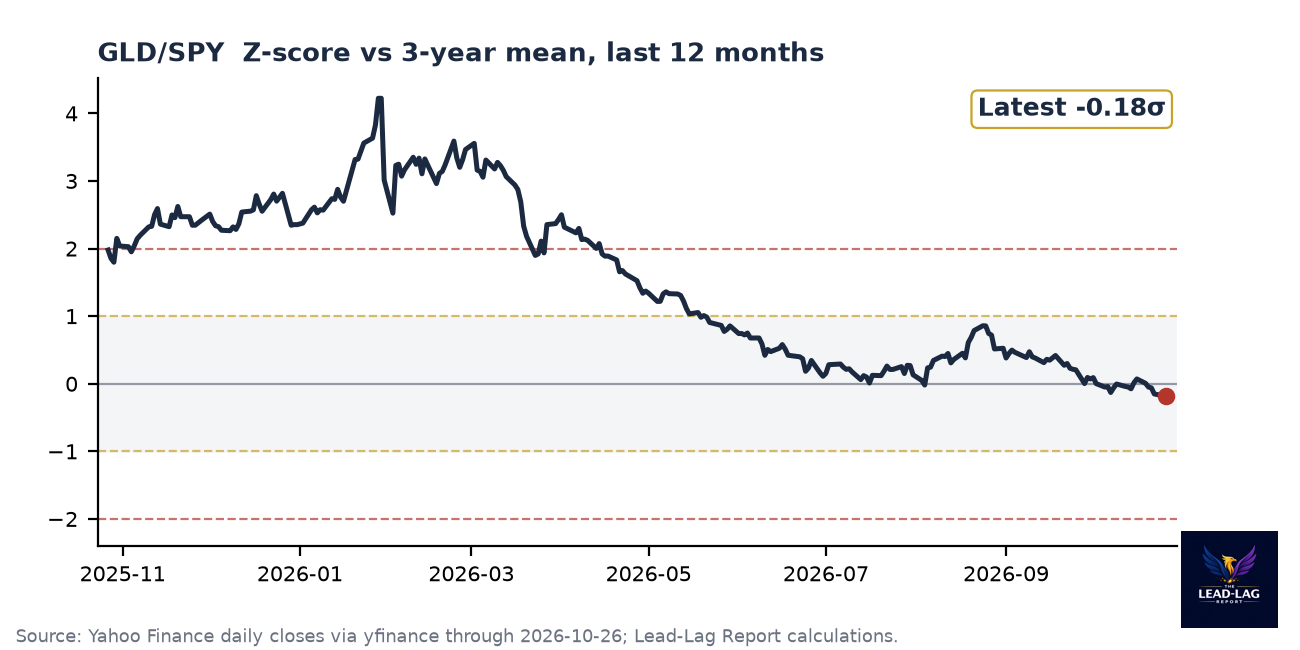
Plain-English: neutral level after a hard week for gold.
Returns: 1M -5.77% · 3M -4.75% · 6M -21.21% · 1Y -14.71%
Gold against the S&P 500 is -0.18 sigma, with -5.77% on the month and -21.21% over six. GLD fell 3.13% last week. In a genuine flight to safety gold usually rises with Treasuries; this week it did the opposite, which argues the defensive bid is about equity risk, not currency or systemic fear.
XLV/SPY · Signal strength: -0.27σ Background · RRG: leading
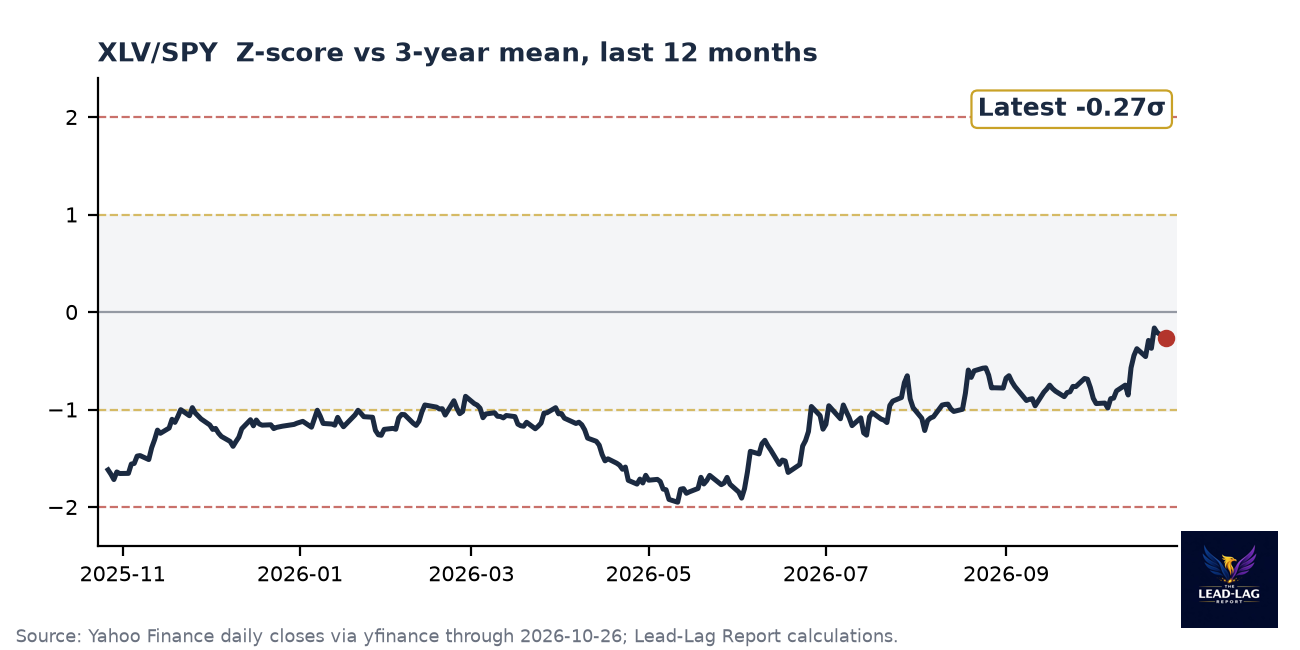
Plain-English: neutral level, steady defensive momentum.
Returns: 1M +5.85% · 3M +6.61% · 6M +16.36% · 1Y +9.27%
Health care improved to -0.27 sigma, with +5.85% on the month and +16.36% over six. It was the second-best sector last week at +1.52% per Morningstar. Neutral on level, leading on RRG: a quiet defensive winner.
Credit Confirmation: JNK/GOVT
Credit is still the vote that counts, and this week it abstained. JNK/GOVT is +1.06 sigma, 0.2% above the +1.0 line and 3.7% above zero. It closed at +0.99 on October 22, the day the defensive pair signal fired, then recovered. The one-month return is -1.84%, the third straight negative month. EMB/GOVT dropped to +0.96, and LQD/GOVT is flat at -0.17.
The decomposition matters. JNK rose 0.43% last week while GOVT rose more as yields fell, so the ratio slipped because Treasuries won, not because junk bonds sold off. That is the opposite of how a credit event starts. Meta's record CDS spread is a single-name warning inside investment grade, and LQD/GOVT has not moved on it. The rule set in Run #34 stands: the regime break is JNK/GOVT below 0.0 sigma. Until then, the defensive pair signal is a turbulence warning without credit's signature on it.
Laggards: Ratios Where the Denominator Is Winning
EFA/SPY · Signal strength: -0.94σ Weak · RRG: improving
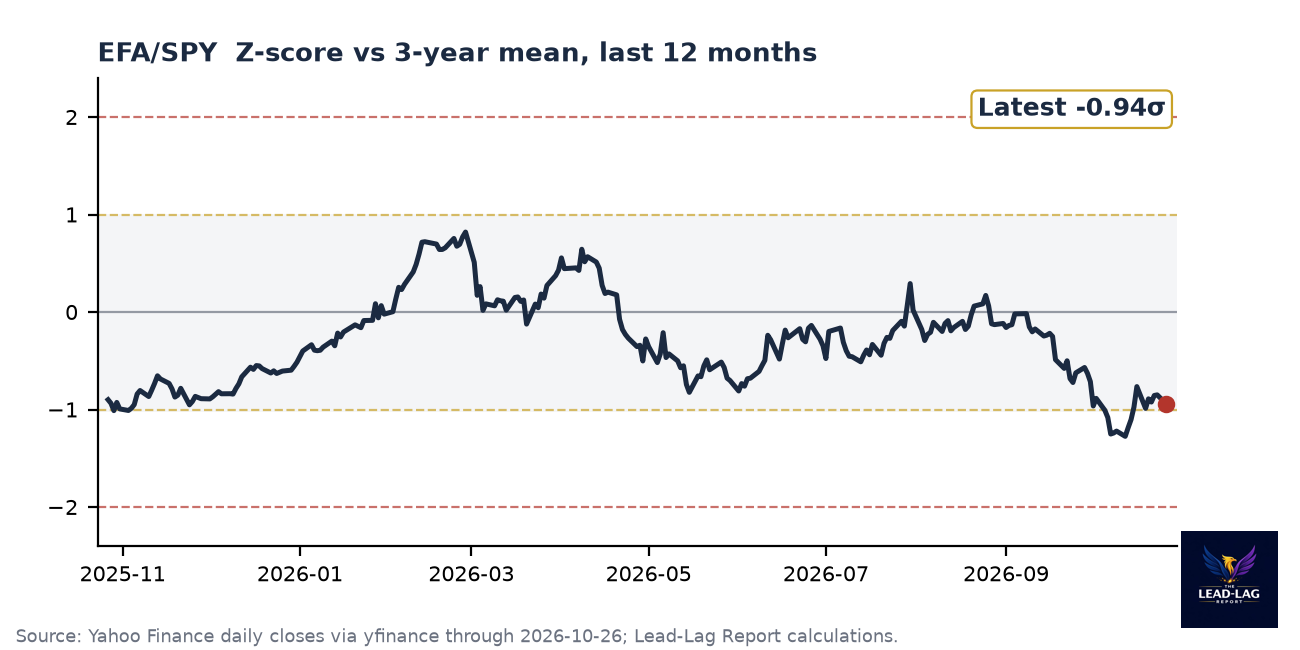
Plain-English: a mild laggard that is not getting worse.
Returns: 1M -1.75% · 3M -4.16% · 6M -4.67% · 1Y -1.96%
Developed international is -0.94 sigma, nearly unchanged, with -1.75% on the month. RRG improving. No signal.
SDY/SPY · Signal strength: -0.94σ Weak · RRG: leading
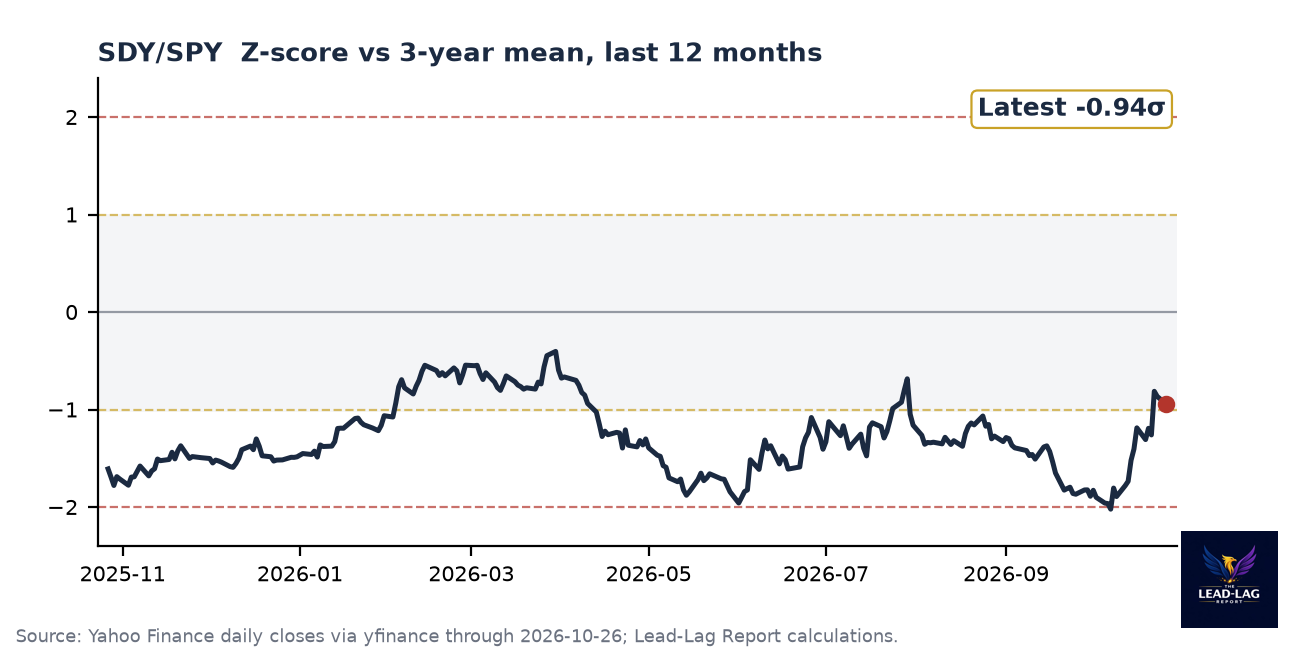
Plain-English: dividend payers had their best month in a while.
Returns: 1M +7.51% · 3M -1.37% · 6M +0.54% · 1Y +2.02%
Dividend aristocrats improved to -0.94 sigma from -1.31, with +7.51% on the month. Three of the four best one-month ratio returns in the table are defensive: utilities, staples and dividend payers.
IWM/SPY · Signal strength: -1.01σ Notable · RRG: improving
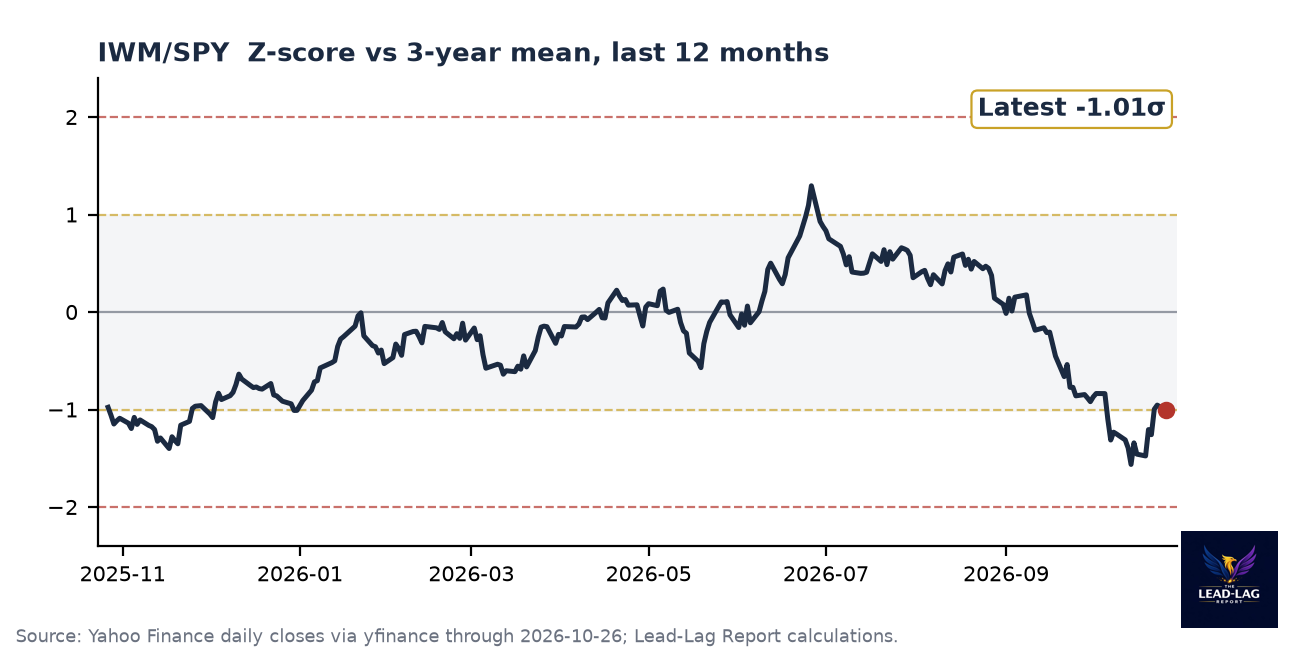
Plain-English: small caps closed a third of their gap in one week.
Returns: 1M -1.00% · 3M -8.14% · 6M -6.61% · 1Y -1.80%
Small caps improved to -1.01 sigma from -1.48, with IWM up 2.10% on the week against -0.14% for SPY. Lower yields helped the most rate-sensitive equities. This was a Run #34 miss.
XLB/SPY · Signal strength: -1.10σ Notable · RRG: improving
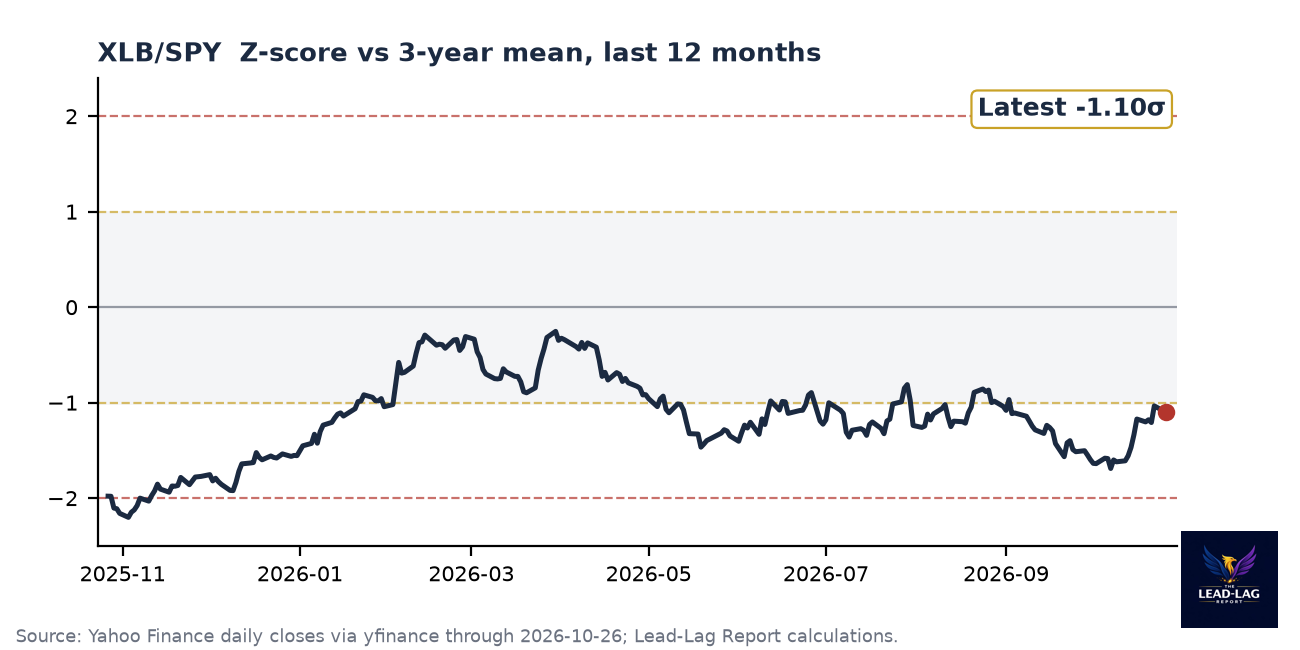
Plain-English: a notable laggard, slowly improving.
Returns: 1M +3.98% · 3M -3.02% · 6M -7.39% · 1Y +2.89%
Materials improved to -1.10 sigma from -1.20, with +3.98% on the month.
XLP/SPY · Signal strength: -1.11σ Notable · RRG: leading
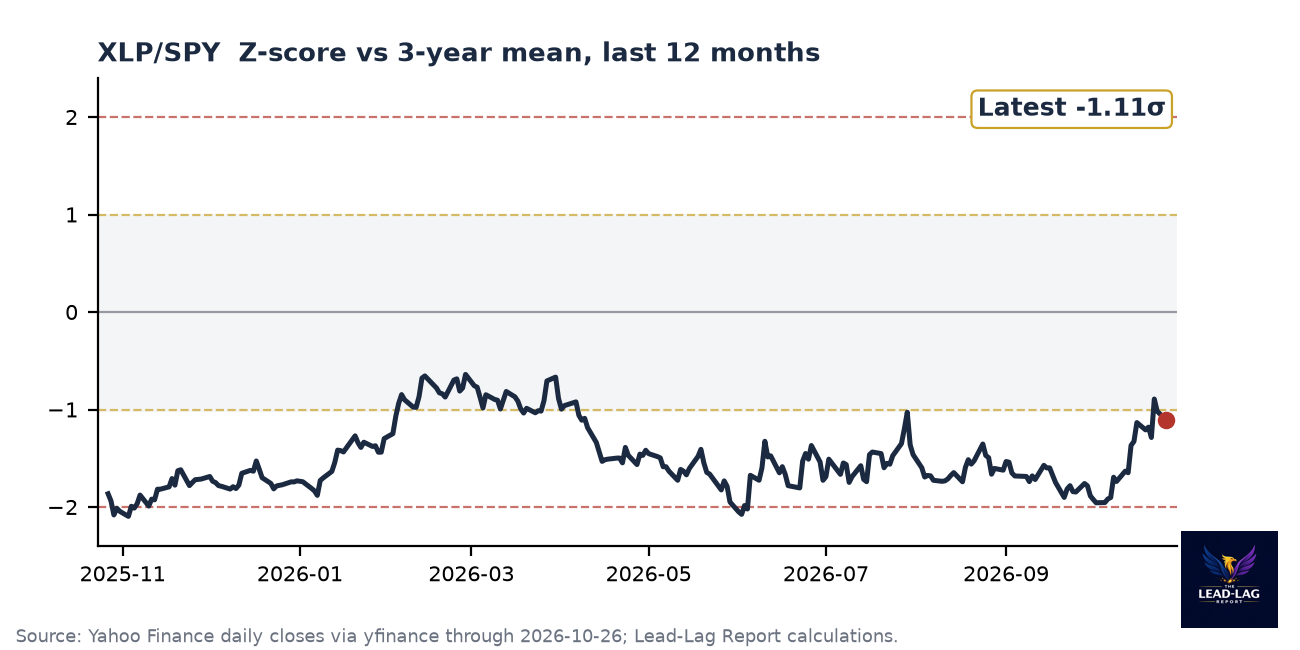
Plain-English: a laggard on level with a top-three month.
Returns: 1M +8.03% · 3M +1.35% · 6M -0.59% · 1Y +0.03%
Staples sit at -1.11 sigma, improved from -1.21, with +8.03% on the month. RRG leading.
Lumber/Gold · Signal strength: -1.15σ Notable · RRG: lagging
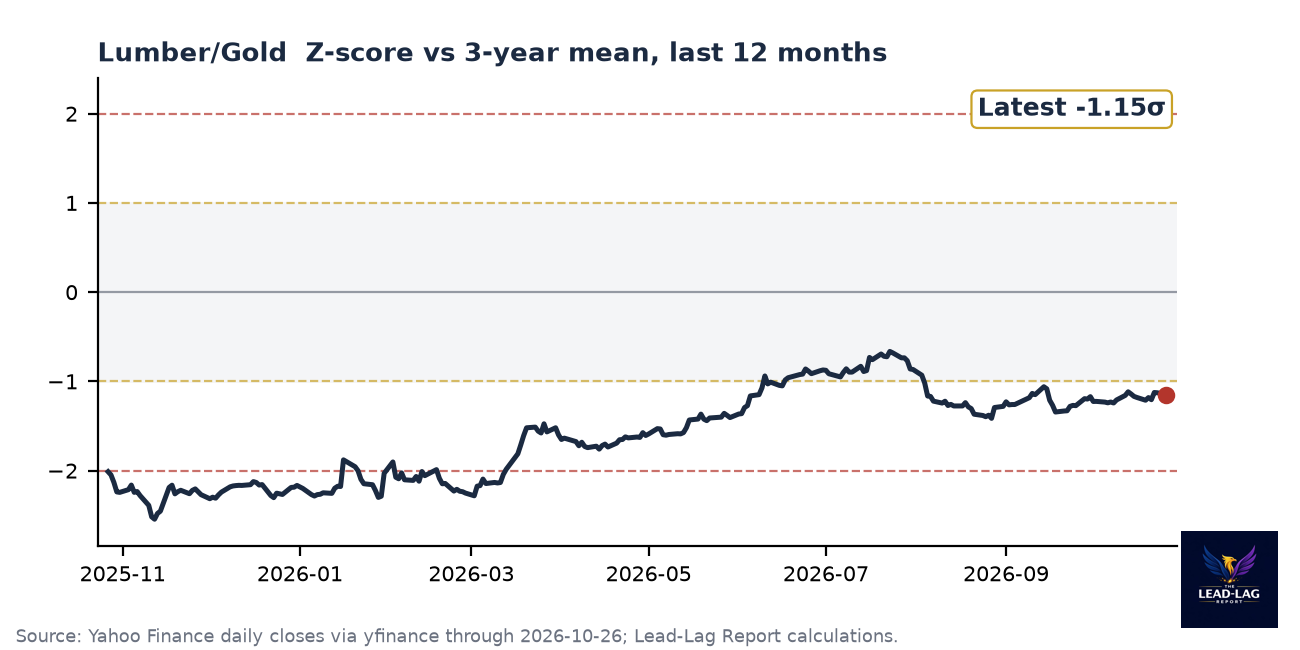
Plain-English: a notable laggard, down about a fifth in three months.
Returns: 1M +2.48% · 3M -20.36% · 6M +4.24% · 1Y -10.25%
Lumber against gold is -1.15 sigma, with +2.48% on the month but -20.36% over three. Lumber futures closed at 515.5 on the continuous contract, down 21.2% over three months.
XLF/SPY · Signal strength: -1.27σ Notable · RRG: leading
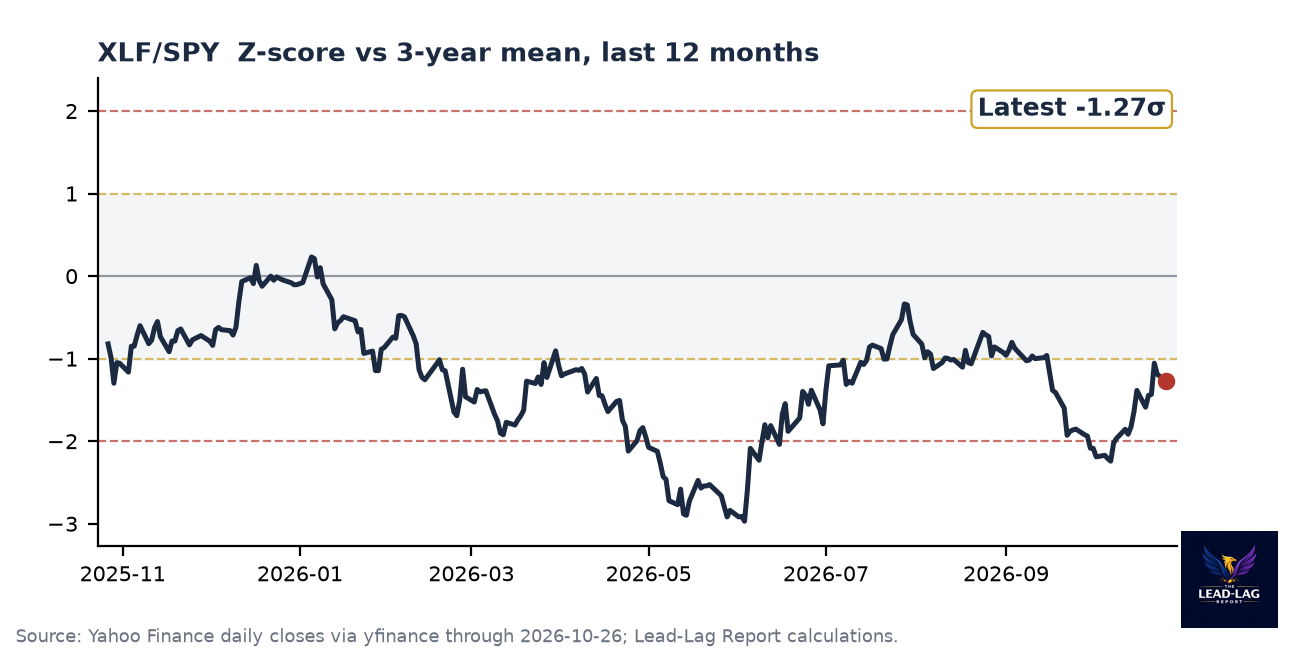
Plain-English: financials improved by a third of a sigma.
Returns: 1M +2.95% · 3M -3.85% · 6M +1.83% · 1Y -6.21%
Financials improved to -1.27 sigma from -1.59, with +2.95% on the month. RRG moved to leading.
TLT/SPY · Signal strength: -1.53σ Significant · RRG: improving
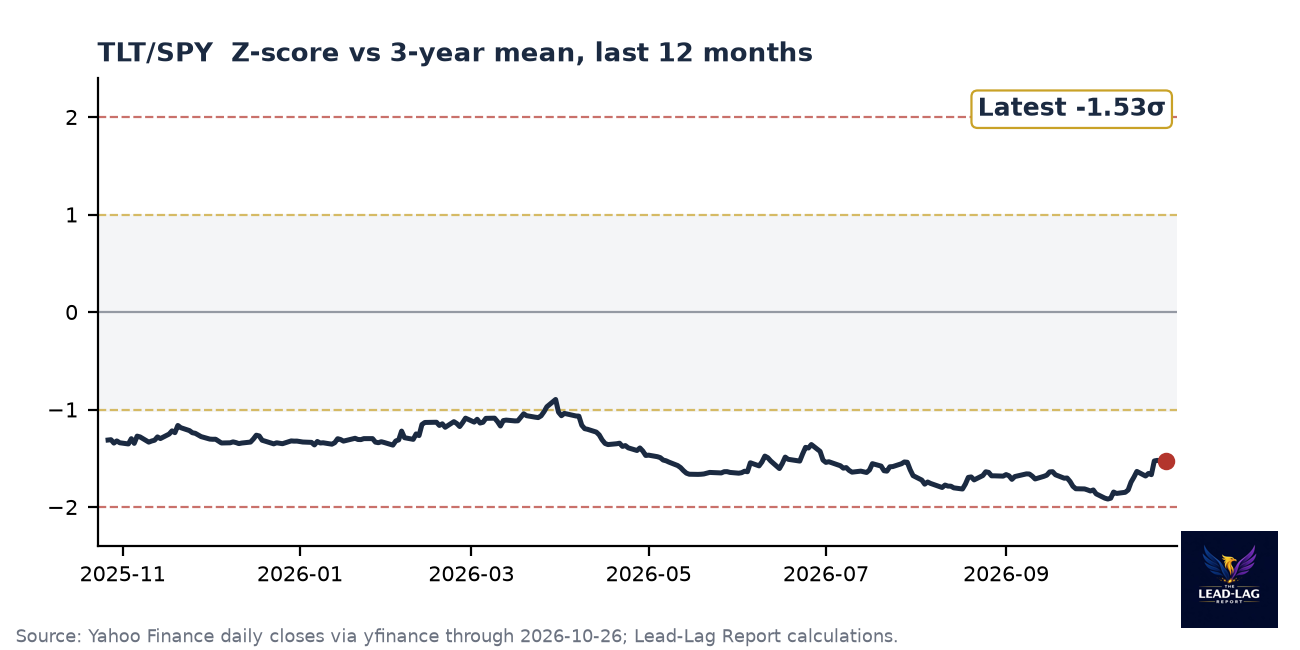
Plain-English: long Treasuries are winning again, from a deep hole.
Returns: 1M +4.20% · 3M -4.38% · 6M -10.53% · 1Y -18.20%
Long Treasuries improved to -1.53 sigma from -1.68, with +4.20% on the month. The ten-year fell from 5.14% to 4.99% on the yfinance series, including its strongest one-day rally in about 15 months on October 22 per Wealth Enhancement Group. Run #34's call for a negative month missed.
XLRE/SPY · Signal strength: -1.60σ Significant · RRG: improving
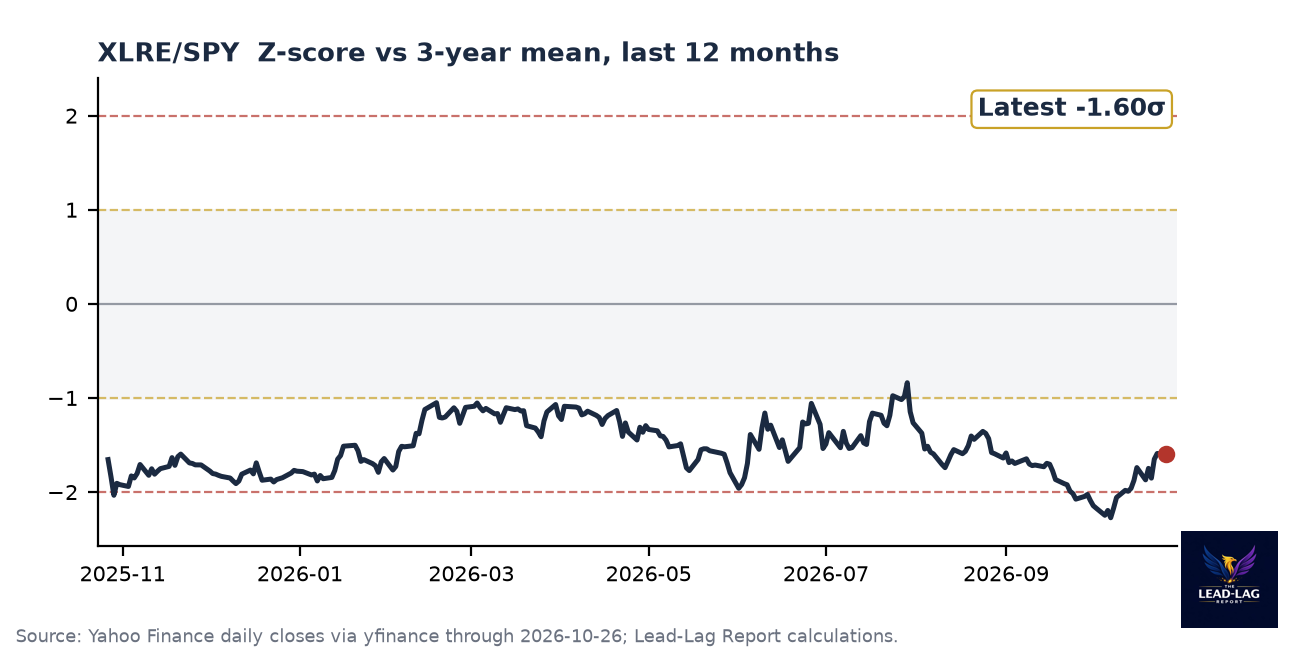
Plain-English: real estate is rallying with lower yields.
Returns: 1M +3.79% · 3M -9.54% · 6M -7.81% · 1Y -9.05%
Real estate improved to -1.60 sigma from -1.87, with +3.79% on the month. Lower yields and the cell-tower rally, plus a jump in cell-tower stocks on the SpaceX wireless report per Reuters, did most of the work.
XLU/SPY · Signal strength: -1.95σ Significant · RRG: improving
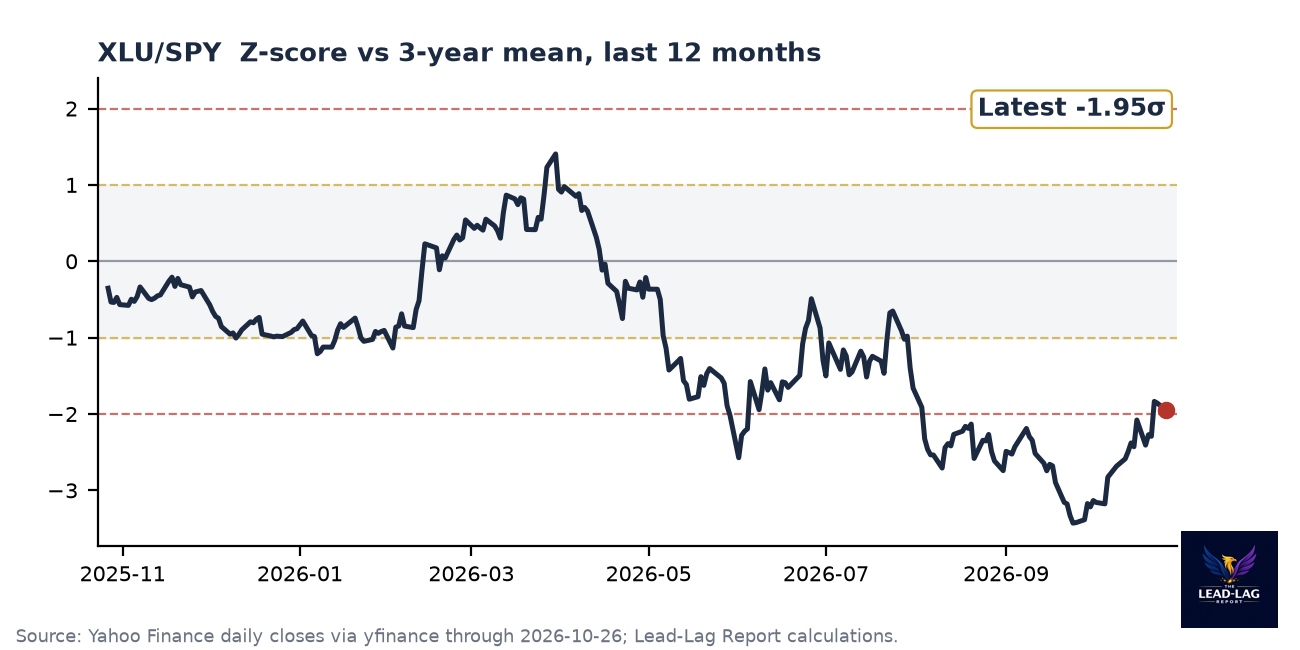
Plain-English: utilities left the extreme band on a huge month.
Returns: 1M +8.54% · 3M -10.82% · 6M -13.31% · 1Y -16.16%
Utilities improved to -1.95 sigma from -2.41, with +8.54% on the month, leaving the extreme band for the first time since August. The weekly four-week rate of change hit +9.33% on October 23. The level is still deeply negative over three months at -10.82%. Run #34's call to stay below -2.0 sigma missed by 0.05.
XLY/SPY · Signal strength: -2.11σ Extreme · RRG: improving
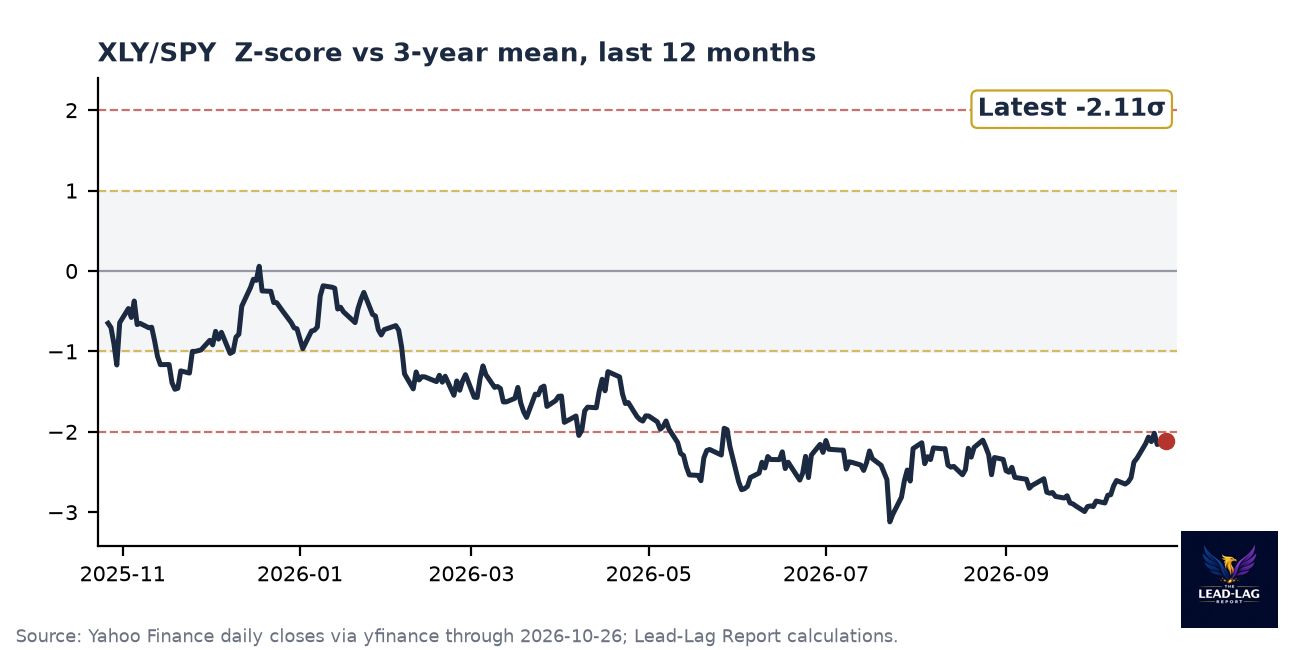
Plain-English: still extreme, with a positive month.
Returns: 1M +4.15% · 3M +0.80% · 6M -10.28% · 1Y -15.13%
Consumer discretionary is -2.11 sigma, little changed, with +4.15% on the month. Still extreme.
XLI/SPY · Signal strength: -2.11σ Extreme · RRG: improving
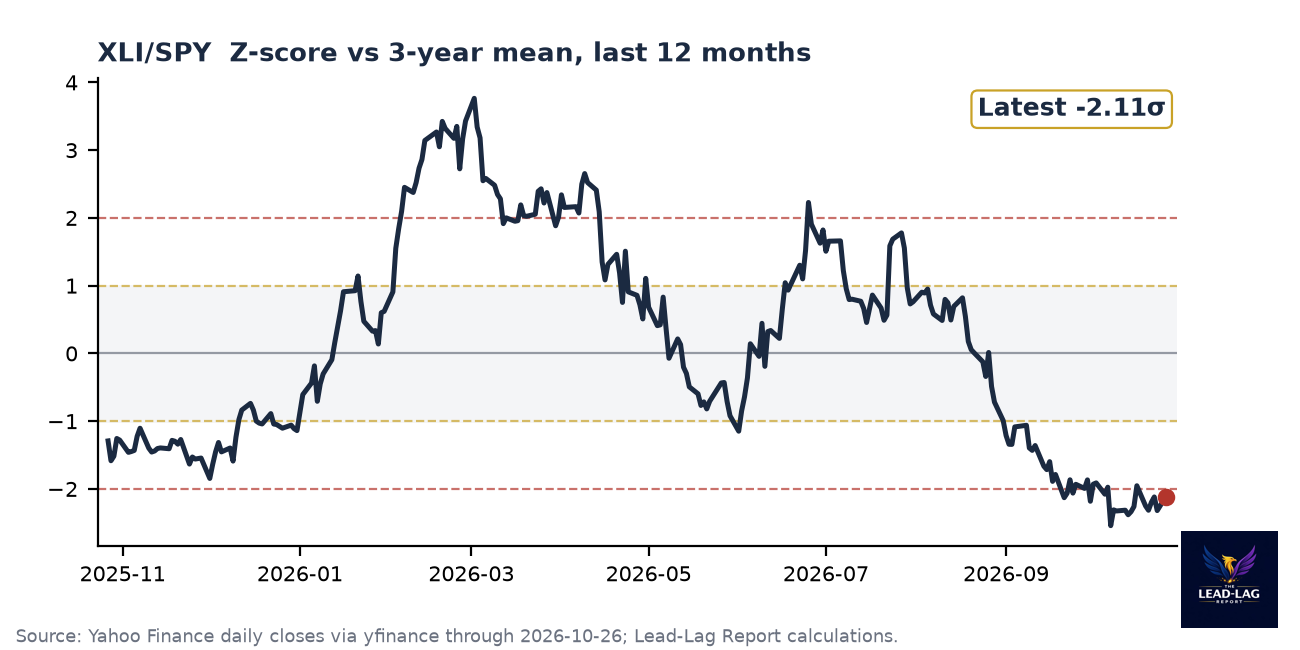
Plain-English: still extreme, momentum barely better.
Returns: 1M -1.27% · 3M -11.73% · 6M -9.69% · 1Y -4.57%
Industrials are -2.11 sigma from -2.25, with -1.27% on the month and -11.73% over three. Industrials were the second-worst sector last week at -2.07% per Morningstar. Still extreme.
XLC/SPY · Signal strength: -2.78σ Extreme · RRG: lagging
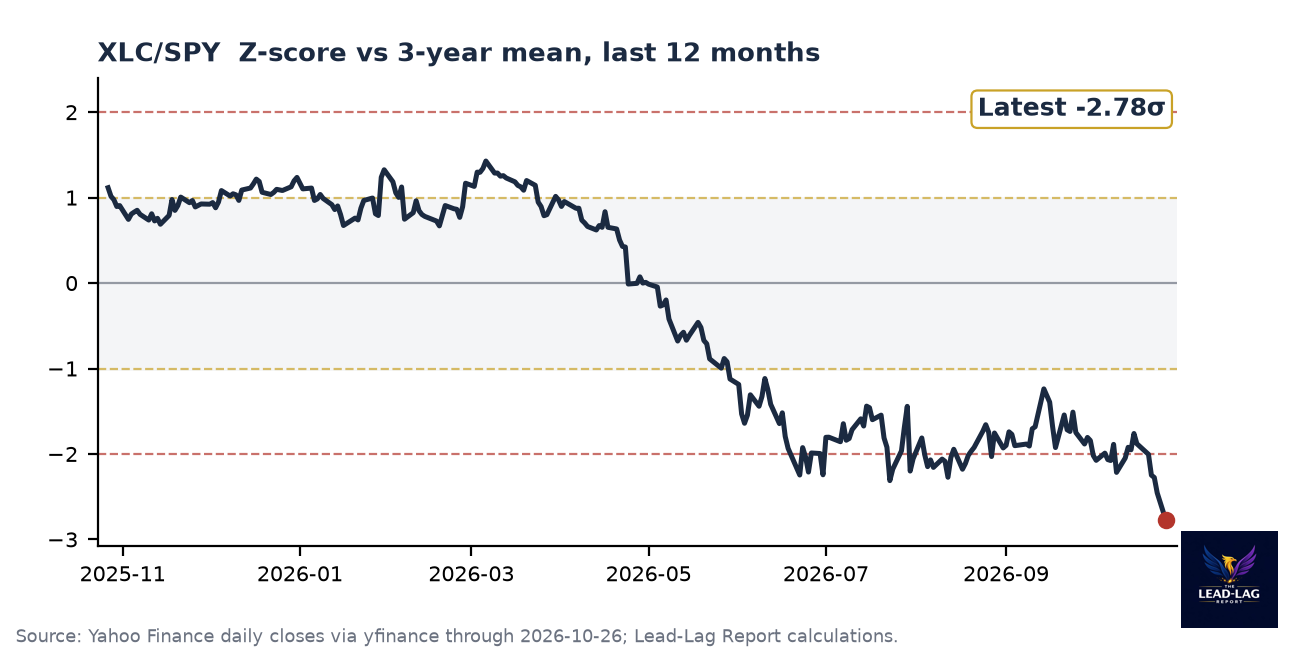
Plain-English: communication services broke down hardest in the table.
Returns: 1M -7.35% · 3M -5.60% · 6M -16.09% · 1Y -20.35%
Communication services collapsed to -2.78 sigma from -1.97, with -5.53% against SPY in five sessions and -7.35% on the month. Meta fell more than 9% for the week after reporting negative free cash flow for the first time, per CNBC, Netflix cut its advertising forecast per Stocktwits, and AT&T and T-Mobile sank nearly 8% on a report that SpaceX wants to launch a wireless carrier, per Reuters. XLC hit its lowest level since June 2025 on Monday per CNBC.
Lumber/Gold Scenario
Lumber/Gold is -1.15 sigma with lumber futures at 515.5, down 21.2% over three months. Reaching -2.0 sigma would need the ratio to fall another 32%, a move that would take a lumber collapse and a gold rally at the same time. The realistic range is -1 to -1.5 sigma. A housing commodity losing a fifth of its value in a quarter fits the growth-scare reading in bonds.
The Steelman Counter-Case
The best case against me is that this week's defensive surge was mechanical. The ten-year fell about 15 basis points in a week on the yfinance series, and utilities, staples and real estate are bond proxies. Strip out the yield move and you may have a sector rotation inside a market that ended the week down 0.14% and then rallied 0.7% on Monday as AI names rebounded on Anthropic's IPO filing, per Yahoo Finance. The S&P 500 is 1.8% from a record. On this view the defensives are a rates trade that reverses the day yields bounce.
The bear on my thesis also has the single-signal base rate on his side. After 22 utilities surges the median three-month SPY return was +4.52%, better than average. The joint-signal sample is 15 events with seven from two bear markets. If I drop those seven, four of the remaining eight saw an 8% drawdown. That is still about double the base rate, but the confidence interval on eight observations is wide enough that a skeptic can call it noise.
Third, credit has not confirmed. Among the four calm-entry episodes, February 2026 avoided an 8% drawdown and SPY ended the window up 10.12%. If JNK/GOVT turns back up from +1.06, this could repeat that pattern. I am not calling the destination; the thesis is about the path, and the falsifiers below can show me wrong quickly.
What Would Change My View
The thesis, that defensives are pricing turbulence the index is not, is wrong if any of these happens by the date given:
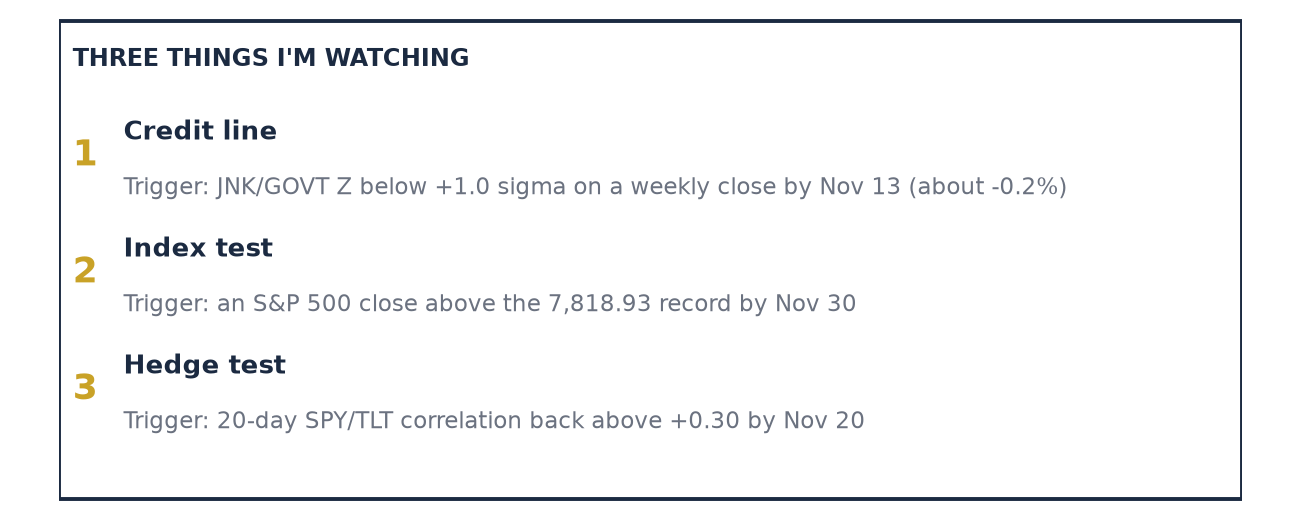
- The S&P 500 closes above its 7,818.93 record on any day through November 30 without first falling 5% from the October 26 close of 7,676.77.
- The XLU/SPY four-week rate of change turns negative on the November 13 weekly close or earlier, which would mean the defensive bid has fully reversed.
- The 20-day SPY/TLT correlation returns above +0.30 by November 20 while SPY rises, which would say this was a rates trade and not a risk trade.
The Week in Context
The FOMC meets today and tomorrow, with the decision on October 28. The Fed raised its target range to 3-3/4 to 4 percent on September 16 on a 12 to 0 vote, per federalreserve.gov, with no dissents. Futures price about a 90% chance of a hold this week and 76.2% odds of a December increase, per Seoul Economic Daily citing CME FedWatch. MNI notes that hawkish dissents in favor of a hike are likely even with a hold.
Markets: the S&P 500 fell 0.5% last week and the Nasdaq 0.7%, while the Dow rose 0.4% for a third weekly gain, per Reuters. Monday the S&P 500 rose 0.7% to 7,676.77, per AP. Energy, up 1.56%, and health care, up 1.52%, led last week; communication services, down 2.8%, and industrials, down 2.07%, lagged, per Morningstar. The ten-year ended near 4.99% per Schwab. Alphabet and Microsoft report Wednesday and Amazon Thursday, with about one-third of the S&P 500 reporting this week. Data in this edition runs through the October 26 close, with an update through the October 27 close above.
Forward Calls: Testable Predictions for Run #36
Six calls, scored against the next edition's close:
- [XLE/SPY] The Z-score stays above +1.5 sigma. Reasoning: Brent near $116 and continued supply attacks keep the energy leg supported.
- [XLC/SPY] The Z-score stays below -2.0 sigma. Reasoning: a 0.78 sigma cushion and Alphabet earnings on Wednesday make a full recovery in one week unlikely.
- [TLT/SPY] The 1M return stays positive. Reasoning: stocks and long bonds are negatively correlated again, and a hold this week removes an upside rate shock.
- [JNK/GOVT] The Z-score stays above 0.0 sigma. Reasoning: the slip is coming from the Treasury leg, and the line is 3.7% away.
- [XLP/SPY] The 1M return stays positive. Reasoning: the defensive pair signal historically persists past the first week.
- [XLK/SPY] The Z-score stays above +1.0 sigma. Reasoning: the level needs a 6.5% relative decline to breach it.
Notes on Method
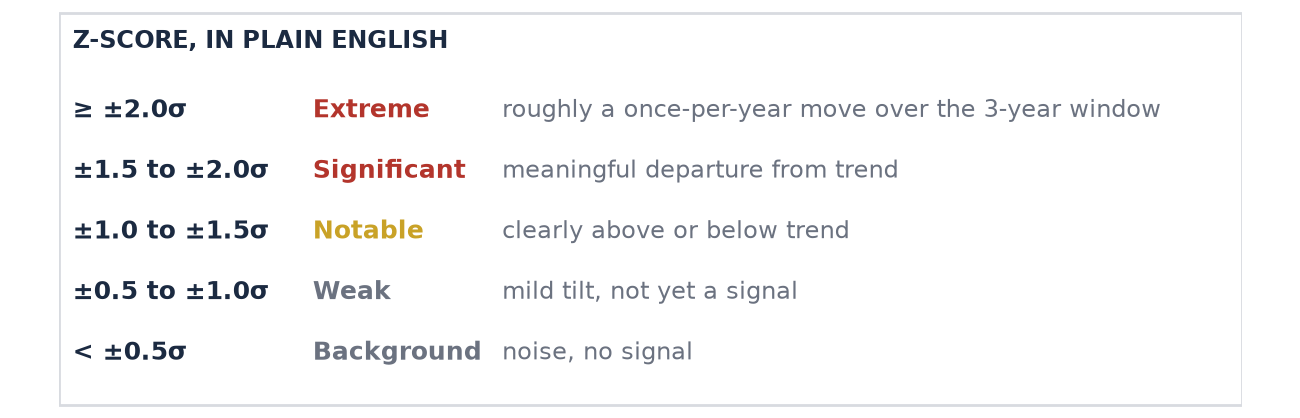
- Z-scores are the ratio's current level against its trailing 756-session mean and standard deviation. Returns are ratio changes over 1, 3, 6 and 12 calendar months.
- Single signal: XLU/SPY four-week rate of change on Friday closes at or above +8%, de-clustered at 91 days, 22 completed episodes since 1999.
- Joint signal: XLU/SPY and XLP/SPY 21-session returns both at or above +7%, de-clustered at 91 days, 15 completed episodes. Forward window 63 sessions; drawdown is the lowest SPY close inside the window against the signal-day close. Baseline uses all 63-session SPY windows since 2000.
- Stock-bond correlation is the rolling 20-session correlation of SPY and TLT daily returns. Ten-year yields are from the yfinance ^TNX series.
- All prices are yfinance daily closes through October 26, 2026; the update section uses closes through October 27, 2026.
Sources
- Federal Reserve FOMC statement, September 16, 2026: federalreserve.gov
- FRED S&P 500 series: fred.stlouisfed.org
- AP, How major US stock indexes fared Monday 10/26/2026: apnews.com
- CNBC, Next week brings major risks for the stock market: cnbc.com
- CNBC, Stock market news for Oct. 26, 2026: cnbc.com
- CNBC, Oil prices, October 26: cnbc.com
- Reuters via WHBL, Wall St dips after AI-led selloff; SpaceX worries hit telecoms: whbl.com
- Morningstar, Weekly Market Update: morningstar.com
- Seoul Economic Daily, U.S. economists see Fed holding rates: sedaily.com
- MNI, FOMC preview: mnimarkets.com
- Wealth Enhancement Group, Week in Review October 23: myfw.com
- Moneycontrol, Commodity Corner: moneycontrol.com
- Reuters via News & Observer, Wall Street closes lower to end rocky week: newsobserver.com
- Yahoo Finance, Stock market today, October 26: finance.yahoo.com
- Stocktwits via Yahoo Finance, AI Roundup: finance.yahoo.com
- Schwab, Market Update: schwab.com
- AP, How major US stock indexes fared Tuesday 10/27/2026: apnews.com
- Portfolio Terminal, Stock market close October 27, 2026: portfolio-terminal.com
- Reuters via Kansas City Star, Oil eases on Middle East diplomacy hopes, October 27: kansascity.com
- eOption, Market Review October 27, 2026: eoption.com
- Federal Reserve, FOMC statement, October 28, 2026: federalreserve.gov
- CNBC, Fed holds rates steady despite concerns over inflation, October 28, 2026: cnbc.com
Disclaimer
The Lead-Lag Report is provided by Lead-Lag Publishing, LLC. All opinions and views mentioned in this report constitute our judgments as of the date of writing and are subject to change at any time. Information within this material is not intended to be used as a primary basis for investment decisions and should also not be construed as advice meeting the particular investment needs of any individual investor. Trading signals produced by the Lead-Lag Report are independent of other services provided by Lead-Lag Publishing, LLC or its affiliates, and positioning of accounts under their management may differ. Please remember that investing involves risk, including loss of principal, and past performance may not be indicative of future results. Lead-Lag Publishing, LLC, its members, officers, directors and employees expressly disclaim all liability in respect to actions taken based on any or all of the information on this writing.