A 14% Yield That Kept 80% Of The Nasdaq's Upside: Inside QQQI
QQQI pays a 14.28% distribution rate and captured 80% of QQQ's up months, but on Friday's 3.5% Nasdaq-100 drop it fell 3.29%.


HIGH YIELD SPOTLIGHT
A 14% Yield That Kept 80% Of The Nasdaq's Upside: Inside QQQI
The 30-day SEC yield is negative 0.06%. Both numbers are honest, and Friday's selloff showed what the difference means in practice.
MICHAEL A. GAYED, CFA | OCT 31, 2026
Key Highlights
- Yield: 14.28% distribution rate on the September monthly payment of $0.6339, while the 30-day SEC yield was negative 0.06%, both per NEOS1 as of Sep 30
- Upside kept: Captured 80% of QQQ's up-month returns and 75% of its down-month returns across 33 months, versus 72% and 65% for JEPQ, per my calculations from daily closes
- Return: $10,000 invested at the Feb 1, 2024 open became about $15,427 through Oct 30 with distributions reinvested, versus $15,006 for JEPQ and $16,604 for QQQ, per Yahoo Finance price history2
- Structure: Sells and buys NDX index options taxed under Section 1256 (60/40), and the fund says its distributions have been classified as return of capital, per NEOS1
- Size and cost: $15.28 billion in net assets and a 0.68% expense ratio as of Oct 29, per NEOS1
Every week, we'll profile a high yield investment fund that typically offers an annualized distribution of 6-10% or more. With the S&P 500 yielding less than 2%, many investors find it difficult to achieve the portfolio income necessary to meet their needs and goals. This report is designed to help address those concerns.
The Nasdaq-100 was the easy trade for most of two years. Then October arrived. On Friday the Nasdaq Composite fell 2.86% to 25,437.00, its largest one-day percentage drop since June 5, and it now sits 7.8% below its Oct 6 closing high. The chip index lost 7.2% on the day3. QQQI fell 3.29% that day against 3.47% for QQQ2. At the same time the 10-year Treasury yield was 4.98% on Oct 294. Growth investors are wondering what a high multiple is worth when cash pays this much. Income investors are asking a different question: can you collect a fat monthly check from the most volatile large-cap index without giving away the whole rally?
That is the pitch of the NEOS Nasdaq-100 High Income ETF (QQQI), and it has grown to $15 billion. Fifteen billion dollars in under three years says investors like the pitch. I wanted to know whether the numbers justify it, so I rebuilt the track record from daily closes instead of relying on the marketing page. The short version: the fund did what it claims on upside capture, it did better than its best-known rival over the full period, and it carries a tax and yield-accounting wrinkle that every buyer should understand before the first purchase.
Fund Background
QQQI began trading on Jan 29, 2024, charges a 0.68% management fee that equals its total expense ratio, and held $15,278,254,718 in net assets on Oct 29, all per NEOS1. It pays monthly. The October distribution was $0.6343, paid Oct 23, and the September payment of $0.6339 is what NEOS expresses as a 14.28% distribution rate as of Sep 30. Its NAV on Oct 29 was $53.42, exactly matching the market price, per Yahoo Finance price history2, a premium of 0.00%. For an ETF this large that is what you want to see: the shares trade where the portfolio is worth.
The strategy is not a plain covered call. According to NEOS1, the fund holds constituents of the Nasdaq-100 Index and uses a data-driven option program that may include both sold and purchased NDX index options. The purchased options are the part that matters. When you only sell calls, the fund gives away upside above the strike. When you also buy higher-strike calls, you rebuild some of that upside, at the cost of paying for the protection. Think of it as a call spread overlay rather than a naked sale. The fund also uses index options classified as Section 1256 contracts, which NEOS says are subject to lower 60/40 tax rates, and the fund is actively managed to harvest tax losses where it can. The page says its distributions have been classified as a return of capital and may comprise option premiums, dividends, capital gains and interest.
That last sentence is the one to read twice. A return of capital classification is not the same as the fund returning your own money in the colloquial sense. For this kind of structure it reflects how the tax character is built on a book basis, and NEOS warns that the figure on a 19a-1 notice is a preliminary estimate that can change for tax purposes. But the practical effect is real: return of capital lowers your cost basis, which can mean a larger taxable gain when you eventually sell. I will come back to it under Disadvantages.
What Is Inside The Portfolio
NEOS lists only the top 10 holdings on its page and does not publish a total count, so I will not guess at a number. What I can say is what the structure implies. The equity sleeve follows the Nasdaq-100, which means the same mega-cap names that drive QQQ, meaning the largest technology and communication companies in the market. Concentration in the largest names is a feature of the index, not an accident of the fund. Overlaid on that is the options book, which is where the income and the tax treatment come from.
That matters for the risk analysis. A fund like this does not diversify your Nasdaq exposure. It reshapes the payoff of that exposure, trading some of the right tail for a steady monthly cash flow. If you already hold QQQ in a taxable account and are thinking of replacing part of it with QQQI for income, you are not adding a new asset class. You are changing how much of the same asset you keep when it rallies and how much you give back when it falls.
Historical Performance
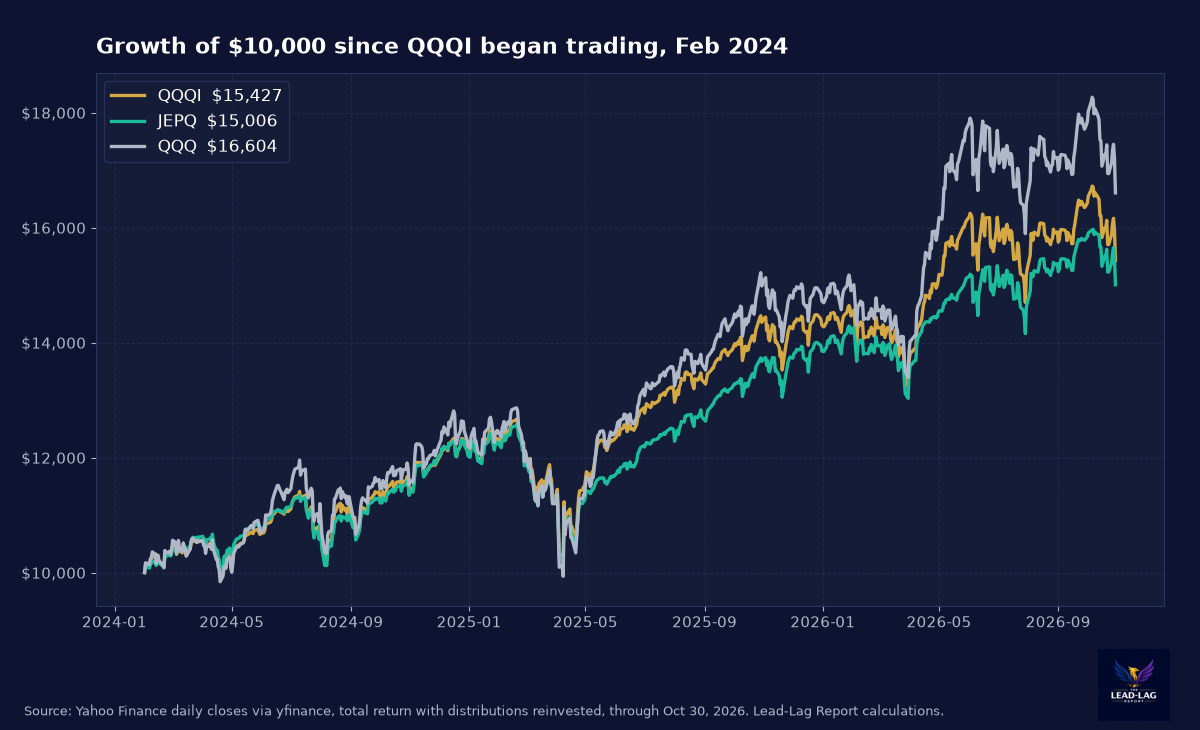
Since QQQI began trading, with distributions reinvested, the fund returned 54.3% through Oct 30, per Yahoo Finance price history2 and my calculations. The comparison group matters. The JPMorgan Nasdaq Equity Premium Income ETF (JEPQ) returned 50.1% over the same window, and QQQ returned 66.0%. In dollar terms, $10,000 became about $15,427 in QQQI, $15,006 in JEPQ and $16,604 in QQQ. So the income wrapper cost about 11.7 percentage points of total return against the plain index, and it beat the best-known rival by about 4.2 points.
The headline hides the shape of the road. Price alone is up just 4.3% since Feb 1, 2024. The rest of the 54.3% is distributions. This is the defining fact about every high-yield option income fund: your return arrives as cash, and the share price is roughly flat. If you spend the distributions, you own a stable-NAV income product with a lot of equity risk underneath. If you reinvest, you own a slower-compounding version of the Nasdaq.
The recent record is less flattering. Over the last year QQQI returned 7.5%, JEPQ 9.7% and QQQ 10.8%. Year to date QQQI is up 7.9% against 8.3% for JEPQ and 12.8% for the index, and over the last three months QQQI returned 1.6% against 2.7% for JEPQ and 1.1% for QQQ. The wrapper looks best in choppy markets and worst in smooth rallies, which is what the math of selling upside predicts.
Volatility And Capture
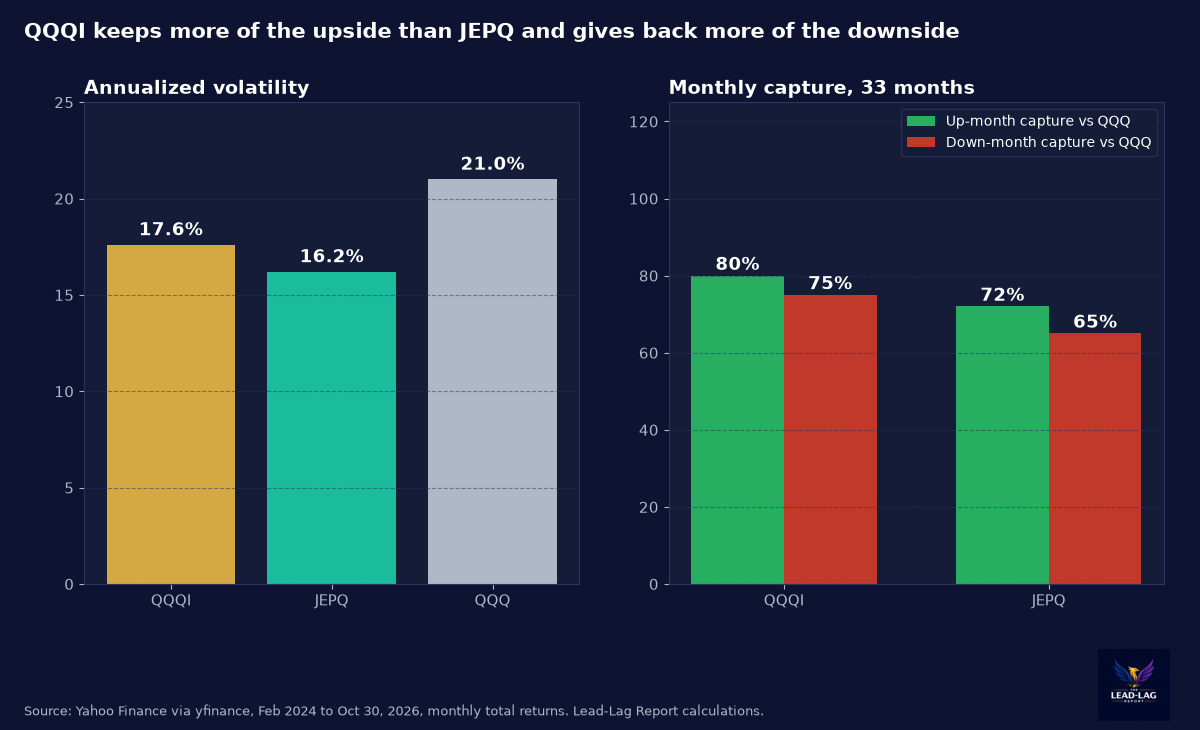
I measured two things. The first is annualized volatility of daily total returns since Feb 2024: 17.6% for QQQI, 16.2% for JEPQ and 21.0% for QQQ. QQQI is about 16% less volatile than the index it holds, a meaningful reduction, but it is not a bond substitute and it is slightly more volatile than JEPQ.
The second is monthly capture. In the 21 months QQQ rose, QQQI averaged 80% of QQQ's gain. In the 12 months QQQ fell, QQQI averaged 75% of QQQ's loss. JEPQ's numbers are 72% and 65%. So QQQI kept more of the upside than JEPQ and also gave back more of the downside. That is the call-spread trade-off showing up in the data: you pay for retained upside with less cushion when the index falls. Neither fund protects you in a real selloff. The worst drawdown for QQQI was 20.0% in April 2025, against 22.8% for QQQ, a gap of only 2.8 points.
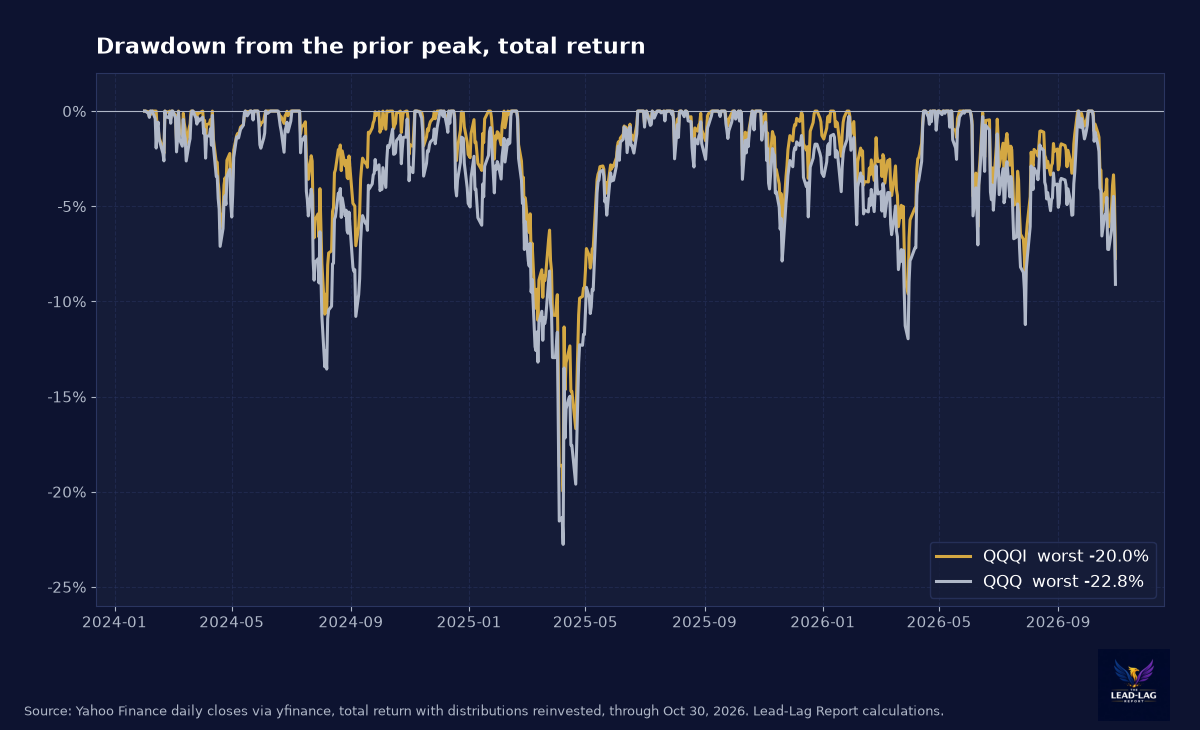
Look at how closely the two lines move together. The cushion is real in the sense that it shows up in most months, but it is thin when it matters most. Friday was a live example: an 18 basis point cushion on a day the index dropped almost 3.5%.
Macro Environment
The setup now is not the one the fund was born into. QQQI launched in a world of falling rate expectations and a rising Nasdaq. Today the 10-year yield is close to 5% and the index has stumbled, with the Nasdaq Composite closing at 25,437.00 on Oct 30, 7.8% below its Oct 6 record close, as AI spending worries hit Intel and Amazon3. Oil is elevated as well, with WTI crude at $102 a barrel and Brent at $114.88 on Oct 295. That is the kind of regime in which option premiums are well supported, because realized and implied volatility are both elevated, and where a call-spread overlay earns its keep relative to owning the index naked.
The risk is the opposite scenario. If the Nasdaq-100 resumes a smooth run higher, the overlay will keep surrendering part of the move, as it has in every strong stretch since launch. And if volatility compresses sharply, option premiums shrink, and the monthly distribution comes under pressure. The best evidence for that is in the distribution history, which I cover next. My view is that QQQI fits a defensive-growth sleeve better than a core one. If you think tech has a rough stretch ahead but do not want to sell it, this is a reasonable way to own it for income. If you think the next leg is a melt-up, you will resent the 11.7 points the wrapper has already cost.
Distribution Policy
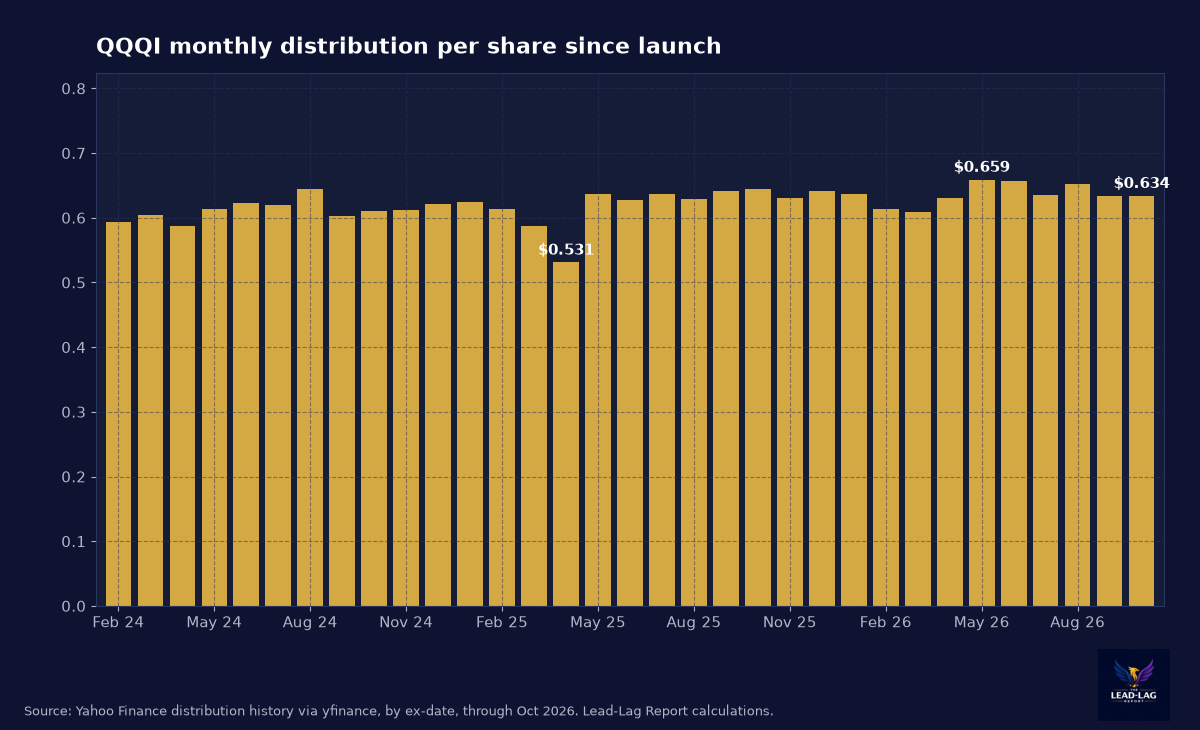
QQQI has paid 33 monthly distributions from February 2024 through October 2026, per Yahoo Finance price history2. They ranged from $0.531 per share in April 2025 to a high of $0.659 in May 2026. The last twelve payments summed to $7.631, or an average of about $0.636 a month, which is 14.8% of the Oct 30 price of $51.66. The October payment of $0.634 was within a penny of that average.
Two features stand out. First, the distribution is variable. NEOS does not promise a fixed amount, and the April 2025 payment was almost 20% below the May 2026 high. The check floats with option premiums, which means it depends on volatility. Second, the variation has been small recently. The last twelve payments have a standard deviation of about a penny and a half. A stream that stable for a year, in a market that swung hard in October, is evidence of discipline in how NEOS builds the option book.
Then there is the negative SEC yield. NEOS reports a 30-day SEC yield of negative 0.06% as of Sep 30, per NEOS1, against a 14.28% distribution rate. The two numbers measure different things. The SEC yield is a standardized calculation of net investment income, meaning dividends from the stocks less expenses, and it does not count option premium as income. The distribution rate counts what was actually paid. A negative SEC yield does not mean the fund is losing money. It means almost none of the cash you receive is stock dividends. Almost all of it is option premium and realized gains, which is why it is classified as return of capital for now.
Advantages
The upside capture beats JEPQ's. At 80% of QQQ's up months, QQQI keeps most of the growth you hold the fund for, with a monthly check on top.
The cost is moderate for what you get. A 0.68% expense ratio for an actively managed option program with tax-loss harvesting is moderate, and the premium to NAV was zero on Oct 29 on a $15 billion fund, so there is no hidden entry cost.
The tax design can help in a taxable account. Section 1256 treatment applies a 60/40 split to gains on the index options, and a return of capital classification defers the tax until sale. For high-bracket investors who want income now and taxes later, that is the strongest feature of the product.
Disadvantages
You give up a lot of the index. Over 33 months QQQI trailed QQQ by 11.7 points of total return, and over the last year it trailed JEPQ as well. If you hold it through a long Nasdaq rally, the opportunity cost grows every month.
The tax benefit has a bill attached. Return of capital reduces your cost basis. If you receive about $7.63 a share a year on a $52 fund and treat all of it as return of capital, your basis falls quickly, and a sale can trigger a large capital gain even if the share price has barely moved. NEOS itself warns that final tax character is reported on Form 1099-DIV and can differ from the preliminary estimate. Talk to a tax professional before you hold it in a taxable account, and do not rely on the estimates.
The distribution is not guaranteed. It has ranged from $0.531 to $0.659, and a period of very low volatility would pressure it. A 14% yield looks like fixed income to a casual reader. It is closer to a volatility harvest sitting on top of an equity index, and that is a fundamentally different risk.
Finally, there is crowding. A fund with $15 billion in assets that trades large index options is a big participant in the NDX options market. I cannot measure the impact on its own execution from public data, but scale tends to reduce flexibility. Treat that as an open question.
Conclusion
QQQI does what it says. It has kept 80% of the Nasdaq-100's up months, trailed the index by a defined amount, beaten its best-known competitor over the full period, and paid a monthly distribution that has been steady for a year. It is not a bond replacement, and it is not tax-free income. The 14% number is a combination of option premium and realized gains on a volatile equity index, delivered as return of capital, and the negative SEC yield says as much.
It suits an investor who wants to stay in the Nasdaq, needs the cash flow, and understands the basis tax trade-off. It does not suit someone who thinks the next move in tech is a melt-up, someone who needs a fixed payout, or someone who has not had a conversation with their tax adviser. Short-term, QQQI is well positioned for a choppy tape with rich option premiums. Long-term, it is a good way to own the Nasdaq-100 if you value the check more than the last 12 points of upside.
Annual paying members get a free print copy of The Price of a Quiet Yen or Intermarket Analysis and Investing, Third Edition (retail value up to $44.95, U.S. shipping): leadlagreport.com/annual. If you have read either book, an honest Amazon review helps other readers find it: The Price of a Quiet Yen and Intermarket Analysis and Investing.
Notes
- NEOS Investments, NEOS Nasdaq-100 High Income ETF (QQQI) fund page, data as of Sept. 30 and Oct. 29, 2026. https://neosfunds.com/qqqi/
- Yahoo Finance, QQQI, JEPQ and QQQ daily price and distribution history, through Oct. 30, 2026. Total returns and capture ratios are Lead-Lag Report calculations. https://finance.yahoo.com/quote/QQQI/history/
- Reuters (via The Kansas City Star), "Wall Street closes sharply lower as AI cash burn fears spark tech selloff," Oct. 30, 2026. https://www.kansascity.com/news/business/article317845088.html
- U.S. Department of the Treasury, Daily Treasury Par Yield Curve Rates, October 2026. https://home.treasury.gov/resource-center/data-chart-center/interest-rates/TextView?type=daily_treasury_yield_curve&field_tdr_date_value_month=202610
- Reuters (via The Lufkin Daily News), "Oil prices fall as diplomacy hopes outweigh escalation fears in Middle East war," Oct. 29, 2026. https://lufkindailynews.com/news_reuters/business/oil-prices-fall-as-diplomacy-hopes-outweigh-escalation-fears-in-middle-east-war/article_fcd43c59-f222-5393-bb5b-d93e064c5cfe.html
The Lead-Lag Report is provided by Lead-Lag Publishing, LLC. All opinions and views mentioned in this report constitute our judgments as of the date of writing and are subject to change at any time. Information within this material is not intended to be used as a primary basis for investment decisions and should also not be construed as advice meeting the particular investment needs of any individual investor. Trading signals produced by the Lead-Lag Report are independent of other services provided by Lead-Lag Publishing, LLC or its affiliates, and positioning of accounts under their management may differ. Please remember that investing involves risk, including loss of principal, and past performance may not be indicative of future results. Lead-Lag Publishing, LLC, its members, officers, directors and employees expressly disclaim all liability in respect to actions taken based on any or all of the information on this writing.