
The Fed Hiked in September. The Money Supply Grew the Fastest Since 2022.
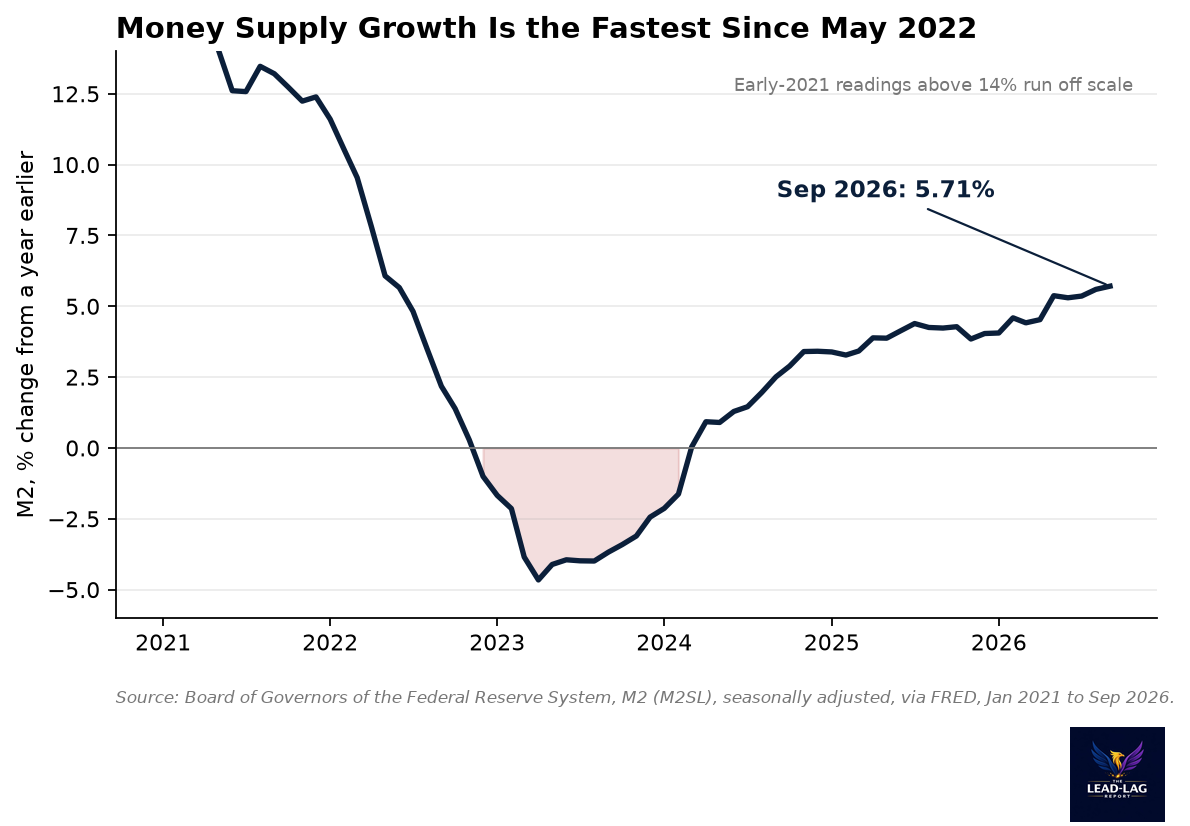
M2 grew 5.71% from a year earlier in September, the fastest since May 2022, while bank reserves fell $128 billion in two weeks as the Treasury's cash account filled.


Today’s Lead-Lag Report post is sponsored by TappAlpha

The Stock-Bond See-Saw Is Breaking. Where Does Income Come From Now? Live roundtable, Tuesday, November 3, 1:00 to 2:00 PM ET
The Fed hiked in September for the first time since 2023, and the 10-year Treasury has pushed above 5%. Bonds pay real income again, but there's a catch: when rates and inflation drive markets, stocks and bonds have tended to fall together, as they did in 2022. That leaves advisors with a harder question than how much yield to chase: where should client income come from when the bond sleeve may not cushion a stock sell-off?
Join Michael A. Gayed, CFA, publisher of The Lead-Lag Report, Si Katara, Founder and CEO of TappAlpha, and three practicing RIAs, Paul Schatz of Heritage Capital, Ricky Biel of Favor Wealth and Christian Ravsten of Foxstone Financial, for a 60-minute roundtable on rates, bonds and option-based income. No slides, just a frank conversation with time for audience questions.
On the agenda:
- Why the stock-bond relationship tends to change at higher yields, and what it means for 60/40 portfolios
- How to weigh 5% bond yields against equity income and option-based strategies
- How three RIA practices are explaining income trade-offs to clients right now
Registration is free. 1.0 CFP CE credit hour requested; CFP Board approval is pending. Register free here.
DISCLAIMER – PLEASE READ: Sponsored by TappAlpha. Views expressed are those of the speakers and are not investment advice. This is sponsored advertising content for which Lead-Lag Publishing, LLC has been paid a fee. The information provided in the link is solely the creation of TappAlpha. Lead-Lag Publishing, LLC does not guarantee the accuracy or completeness of the information provided in the link or make any representation as to its quality, and expressly disclaims any responsibility for action taken in connection with the information provided in the link. This message is educational only and is not an offer to sell or a solicitation of an offer to buy any security.
The Fed raised rates in September. The money supply grew faster anyway.
On September 17 the Federal Reserve raised the top of its target range to 4.00%, its first increase since 2023.[1] That is supposed to slow the growth of money and credit.
So far it has not. M2, the broad measure of money that includes cash, checking, savings and retail money funds, grew 5.71% from a year earlier in September.[2] That is the fastest pace since May 2022, and M2 now stands at a record $23.41 trillion.[2]
That is the setup going into the first week of November. Policy is tighter on paper. Money is still expanding. And underneath both, the plumbing that connects the Treasury, the Fed and the banks is shifting in a way most investors never look at.
The money supply is accelerating
A year ago M2 was $22.15 trillion.[2] In September it was $23.41 trillion, an increase of about $1.26 trillion, by my calculation. The month-to-month pace has run between 0.43% and 0.53% for three straight months.[2]
For context, the money supply actually shrank from a year earlier in every month from December 2022 through February 2024.[2] That contraction was one of the cleaner signals that the 2022 tightening was biting. Growth then turned positive in 2024 and has climbed steadily since.
The level matters too. M2 is now about 7.5% above its 2022 peak of $21.77 trillion, by my calculation.[2] The money that was drained in 2023 has been fully replaced and then some.
One quick reality check. Money that grows is not the same as money that moves. The velocity of M2, nominal GDP divided by the money stock, was 1.417 in the third quarter, essentially flat for two years.[3] So the extra money is not turning over faster. It is simply there, in deposits and money funds.
The Fed stopped shrinking 11 months ago
Part of the reason is the Fed's own balance sheet. Total Fed assets bottomed at $6.54 trillion on December 3, 2025.[4] As of October 28, 2026 they were $6.75 trillion, up about $210 billion or 3.2%, by my calculation.[4]
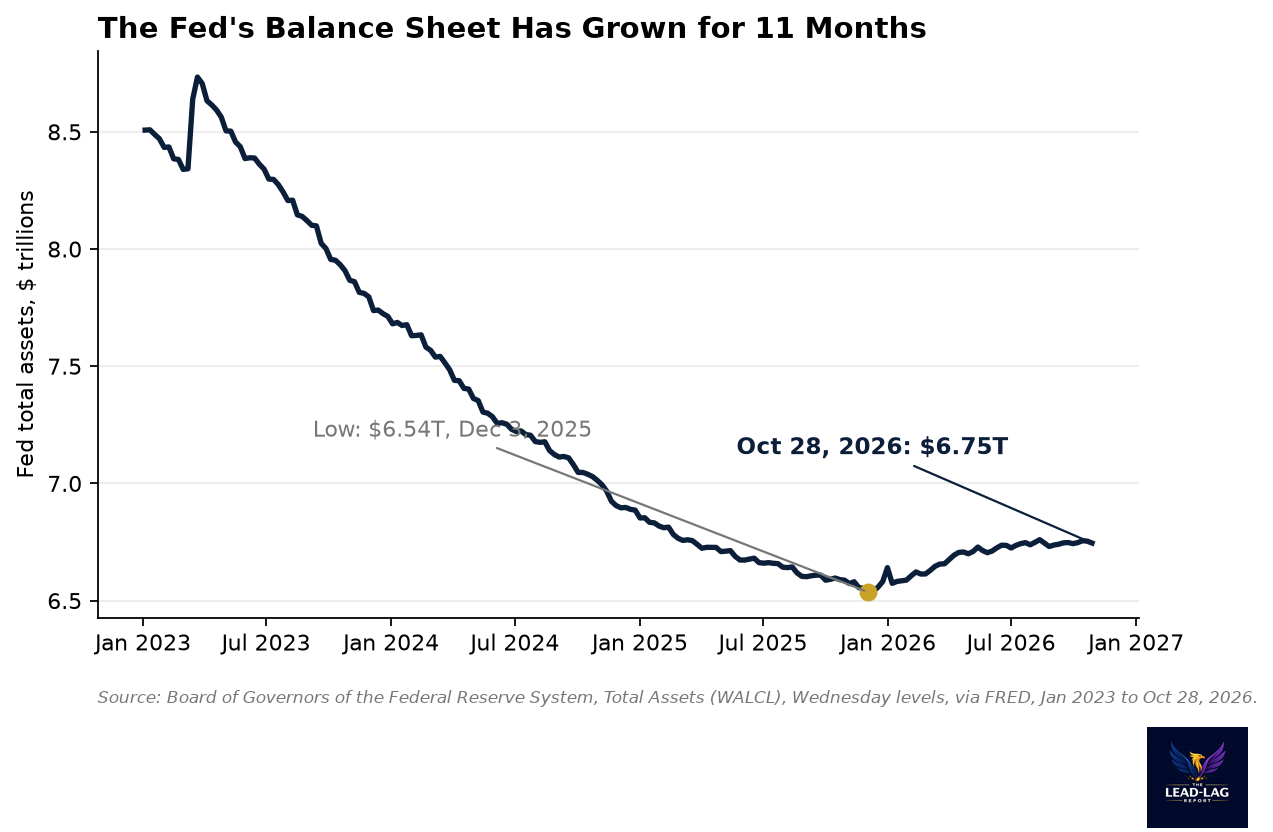
That is a small number next to the roughly $2.43 trillion of shrinkage from the April 2022 peak to that low, by my calculation.[4] But direction matters more than size here. For most of 2023, 2024 and 2025, the Fed was pulling money out of the system every week. For the past 11 months it has not been.
So the Fed is pushing on the price of money with the rate hike while no longer pulling on the quantity. Those two signals point in different directions, and the money supply data are following the second one.
The plumbing shifted in two weeks
Here is the part that matters for the next month.
Between October 14 and October 28, the Treasury's cash account at the Fed rose by $116 billion, to $1,000 billion.[5] Over the same two weeks, bank reserves at the Fed fell by $128 billion, to $2.89 trillion.[6] That is the lowest reserve level of 2026.[6] The Fed's total balance sheet barely moved, down $10 billion.[4]
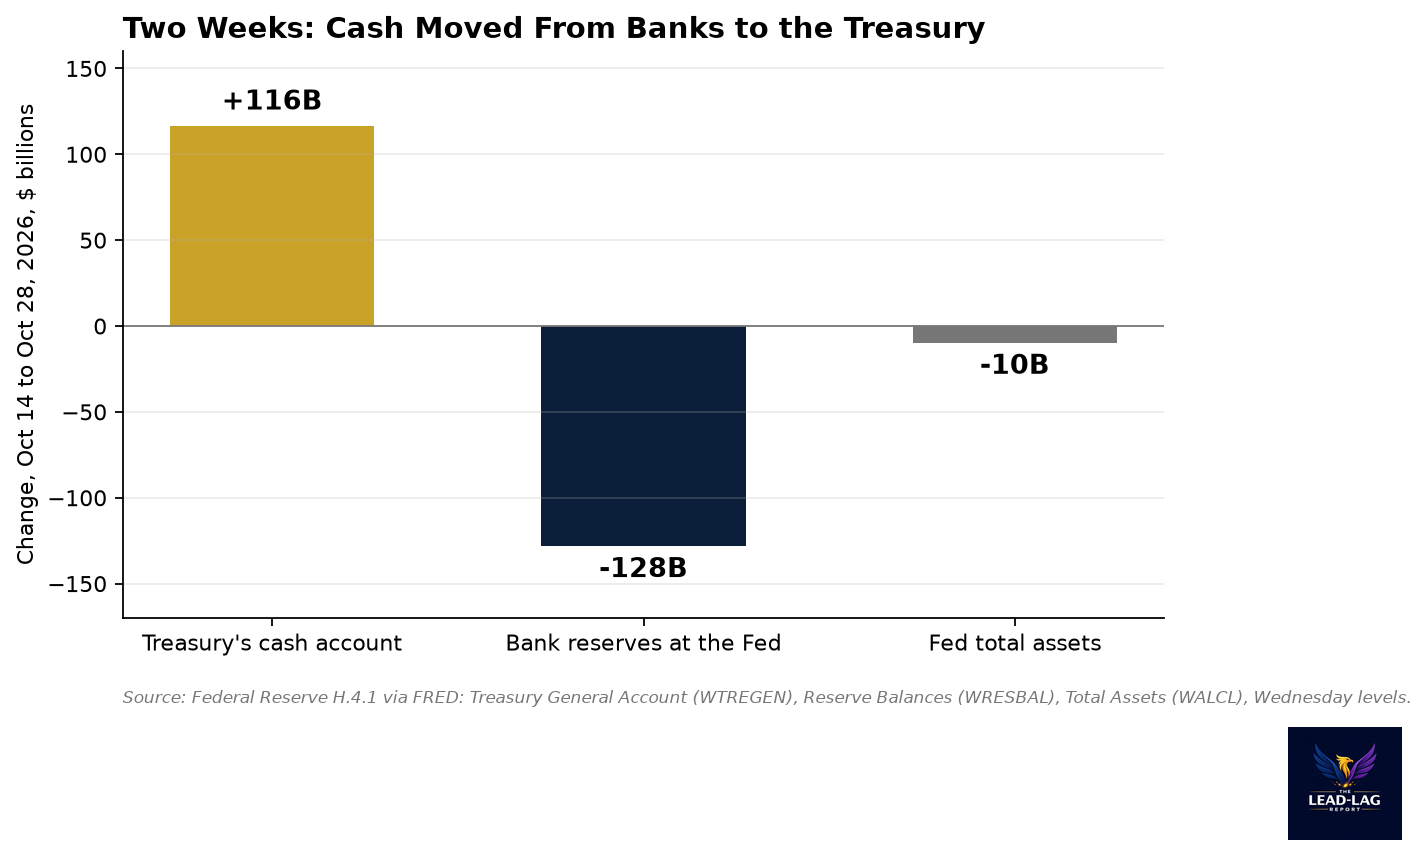
When the Treasury collects taxes or sells more debt than it spends, the cash lands in its account at the Fed and leaves the banking system. In past years the Fed's overnight reverse repo facility acted as a cushion: money funds parked cash there, and that pool absorbed the drain first. That cushion is gone. Reverse repo usage was $0.18 billion on October 28 and $4.38 billion on October 30.[7] In practical terms, close to zero.
So every dollar the Treasury pulls in now comes more directly out of bank reserves. Reserves are still large by historical standards. But they are the system's working cash, and they are moving in the opposite direction from the broad money supply.
What I would not conclude
I would not conclude that the September hike failed. Monetary policy works with long and variable lags, and one hike six weeks ago says little about where money growth goes in 2027.
I also would not read the reserve drop as stress. Treasury cash swings around tax dates and auctions all the time, and a two-week move can reverse in the next two weeks. One data point is not a trend.
And I would not treat M2 as a timing tool. The 2023 contraction was a meaningful signal, but money supply growth has a loose and slow relationship with inflation and asset prices.
Two readings
There are two honest ways to read this.
The first is that the hike is fighting uphill. Money is growing near 6%, the Fed is no longer shrinking its balance sheet, and a 10-year Treasury yield near 5% is doing more tightening than the policy rate.[8] On that reading, inflation pressure stays sticky and the Fed has more work to do.
The second is that the plumbing is about to do some of the Fed's work for it. With the reverse repo cushion empty, a growing Treasury cash balance drains reserves directly. If that continues, funding markets tighten without another vote at the Fed.
Both can be partly true. The question is which one shows up first in the data.
What this means for advisors
For advisors, the practical point is that clients are earning real yield on cash for the first time in a while, and the money supply data say a lot of households are holding it. Money funds and deposits are part of M2. When that pool keeps growing, the conversation with clients shifts from whether to own cash to how much, for how long and what it is meant to fund.
The markers to watch are straightforward. The October M2 figure, due later this month, shows whether growth is still accelerating. The weekly Fed balance sheet, released every Thursday, shows whether reserves keep falling as the Treasury's account fills. If reserves keep sliding while money growth stays near 6%, the two signals are pulling apart, and that gap usually closes through funding markets first.
Notes
[1] Federal Funds Target Range, Upper Limit, Board of Governors of the Federal Reserve System via FRED, series DFEDTARU: https://fred.stlouisfed.org/series/DFEDTARU. Raised from 3.75% to 4.00% effective September 17, 2026; prior increase in the series was July 27, 2023, to 5.50%.
[2] M2, seasonally adjusted, Board of Governors of the Federal Reserve System via FRED, series M2SL: https://fred.stlouisfed.org/series/M2SL. $23,413.9 billion (Sep 2026), $23,300.9 billion (Aug 2026), $23,177.4 billion (Jul 2026), $22,149.2 billion (Sep 2025), $21,770.7 billion (Mar 2022, 2022 peak). Year-over-year growth 5.71% in Sep 2026; the last reading at or above that was 6.07% in May 2022. Month-over-month and peak comparisons by my calculation.
[3] Velocity of M2 Money Stock, Federal Reserve Bank of St. Louis via FRED, series M2V: https://fred.stlouisfed.org/series/M2V. 1.417 (Q3 2026), 1.420 (Q2 2026), 1.413 (Q3 2025), 1.397 (Q3 2024).
[4] Total Assets (Less Eliminations from Consolidation), Wednesday level, Federal Reserve H.4.1 via FRED, series WALCL: https://fred.stlouisfed.org/series/WALCL. $8,965,487 million (Apr 13, 2022, peak), $6,535,781 million (Dec 3, 2025, low since 2025), $6,755,639 million (Oct 14, 2026), $6,745,635 million (Oct 28, 2026).
[5] U.S. Treasury, General Account, Wednesday level, Federal Reserve H.4.1 via FRED, series WTREGEN: https://fred.stlouisfed.org/series/WTREGEN. $883,373 million (Oct 14, 2026), $999,727 million (Oct 28, 2026).
[6] Reserve Balances with Federal Reserve Banks, Wednesday level, Federal Reserve H.4.1 via FRED, series WRESBAL: https://fred.stlouisfed.org/series/WRESBAL. $3,022,140 million (Oct 14, 2026), $2,893,770 million (Oct 28, 2026), the lowest weekly reading of 2026.
[7] Overnight Reverse Repurchase Agreements: Treasury Securities Sold by the Federal Reserve, Federal Reserve Bank of New York via FRED, series RRPONTSYD: https://fred.stlouisfed.org/series/RRPONTSYD. $0.176 billion (Oct 28, 2026), $4.375 billion (Oct 30, 2026).
[8] Market Yield on U.S. Treasury Securities at 10-Year Constant Maturity, Board of Governors via FRED, series DGS10: https://fred.stlouisfed.org/series/DGS10. 4.99% (Oct 27, 2026), 5.05% (Oct 28, 2026), 4.98% (Oct 29, 2026).
The Lead-Lag Report is provided by Lead-Lag Publishing, LLC. All opinions and views mentioned in this report constitute our judgments as of the date of writing and are subject to change at any time. Information within this material is not intended to be used as a primary basis for investment decisions and should also not be construed as advice meeting the particular investment needs of any individual investor. Trading signals produced by the Lead-Lag Report are independent of other services provided by Lead-Lag Publishing, LLC or its affiliates, and positioning of accounts under their management may differ. Please remember that investing involves risk, including loss of principal, and past performance may not be indicative of future results. Lead-Lag Publishing, LLC, its members, officers, directors and employees expressly disclaim all liability in respect to actions taken based on any or all of the information on this writing.