This 15.6% Yielder Trades At 62 Cents On The Dollar. The Dollar Keeps Shrinking.
FS KKR's new variable distribution annualizes to 15.6% at a 38% discount to NAV. The catch: the NAV itself has fallen 25% in ten quarters.

Today's Lead-Lag Report post is sponsored by Relative Sentiment
The Relative Sentiment Tactical Allocation ETF is a flexible, multi-asset fund that invests across stocks, bonds, commodities, precious metals, and currencies. Its approach is guided by a research-based factor called relative sentiment — which tracks how optimistic or cautious professional investors are compared to individual investors. Studies show professionals tend to have an edge over time, and this ETF seeks to capture that insight by increasing exposure to areas where institutions are more optimistic and reducing exposure where they're more cautious. Relative sentiment often complements trend-following strategies, helping create portfolios that may be more balanced and less prone to sharp swings.
The Fund's investment objectives, risks, charges and expenses must be considered carefully before investing. This and other important information is contained in the Prospectus and SAI, which may be obtained by following the links or by calling +1.215.882.9983. Please read the prospectus carefully before investing.
Investments involve risk. Principal loss is possible.
The Fund is distributed by PINE Distributors LLC.
ETFAC-4976143-11/25
DISCLAIMER – PLEASE READ: This is sponsored advertising content for which Lead-Lag Publishing, LLC has been paid a fee. The information provided in the link is solely the creation of Relative Sentiment. Lead-Lag Publishing, LLC does not guarantee the accuracy or completeness of the information provided in the link or make any representation as to its quality. All statements and expressions provided in the link are the sole opinion of Relative Sentiment. and Lead-Lag Publishing, LLC expressly disclaims any responsibility for action taken in connection with the information provided in the link.
Key Highlights
- Yield: 15.6% annualized on the current $0.44 quarterly distribution ($1.76 against an $11.31 price), variable by design
- Discount: 38.2% to NAV ($11.31 price vs $18.30 NAV as of June 30, 2026)
- NAV trend: down 25% in ten quarters, from $24.46 at year-end 2023 to $18.30
- Earnings: GAAP net investment income fell from $0.57 to $0.44 per share over four quarters; first-quarter investment income was down 24% year over year
- Balance sheet: net debt to equity of 131% at March 31, which the company says it brought back within its target range by midyear
Every week, we'll profile a high yield investment fund that typically offers an annualized distribution of 6-10% or more. With the S&P 500 yielding less than 2%, many investors find it difficult to achieve the portfolio income necessary to meet their needs and goals. This report is designed to help address those concerns.
Sixty-Two Cents, And A Payout That Finally Tells The Truth
Yesterday I profiled Blue Owl Capital Corporation at 78 cents on its stated book value and called it the uncomfortable middle of the private credit credibility trade. FS KKR sits a rung lower on the same ladder. The business development company complex has spent the past year repricing quarterly marks after the First Brands and Tricolor failures, and the market has been hardest on funds whose net asset values fell faster than their share prices. That is exactly the pattern here: a stock at $11.31 against a June 30 book value of $18.30, which works out to 62 cents on the dollar.
The reason to look at FS KKR Capital Corp (FSK) now is not the headline yield, though a freshly re-based distribution that annualizes to 15.6% certainly gets your attention. The reason is that the dividend is no longer a promise at all. It is a pass-through of whatever GAAP net investment income the portfolio produced the prior quarter, so the payout now moves with the earnings underneath it. You are buying a 38% discount to a book that has shrunk 25% in ten quarters, and getting paid a variable distribution that has already been cut twice this year. That is either a value trade or a melting ice cube, and this column is about how to tell the difference.
Fund Background
FSK is a business development company externally managed by FS/KKR Advisor LLC, the middle market lending partnership between KKR's credit platform and FS Investments, formed in the 2021 combination of four BDCs. It trades on the NYSE under the ticker FSK with a market capitalization of roughly $3.13 billion. The company reports $11.4 billion of portfolio investments at fair value, making it one of the largest publicly traded middle market lenders.
The June 30, 2026 quarter, from the company's own reporting:
- Total investment income of $290 million, down $14 million from the prior quarter
- GAAP net investment income of $0.44 per share and adjusted NII of $0.43
- A net loss of $0.13 per share, including $0.56 per share of net realized and unrealized losses
- Net investment income yield of 9.6% on NAV
- Net debt to equity of 131% at March 31 (122% at December 31), which the company says it reduced back within its target range during the quarter
- Two new non-accrual investments totaling $104 million at cost and $91 million at fair value
For full-year 2025 the fund recorded net losses of $624 million, or $2.30 per share. Against that backdrop, the sponsor complex has been actively restructuring the capital stack: a $150 million tender offer from KKR affiliates, a $150 million convertible preferred issuance, and a $300 million share repurchase program. The preferred stock now stands ahead of the common, and its most recent quarterly preferred dividend of $0.315972 per preferred share is a fixed claim the common distribution does not enjoy.
Portfolio Composition
The composition story in 2026 is a book that is shrinking and souring at the margin. Total investment income has fallen from $400 million in the first quarter of 2025 to $304 million in the first quarter of 2026 to $290 million in the second quarter, a 24% year-over-year decline in the top line. When a middle market lender's revenue falls by a quarter in five quarters, it is telling you something about spreads on new and repriced loans, and the trend matters more than any single print.
Credit migration is the second thread. The second quarter added two non-accrual positions representing $104 million at cost, and the quarter's $0.56 per share of net realized and unrealized losses shows the marks continuing to work lower. Non-accruals at the fair value level remain small relative to an $11.4 billion portfolio, but the direction is not in dispute: this is a credit book being marked down, not up, and the net investment income yield of 9.6% on NAV is the earnings engine that everything else depends on.
Historical Performance
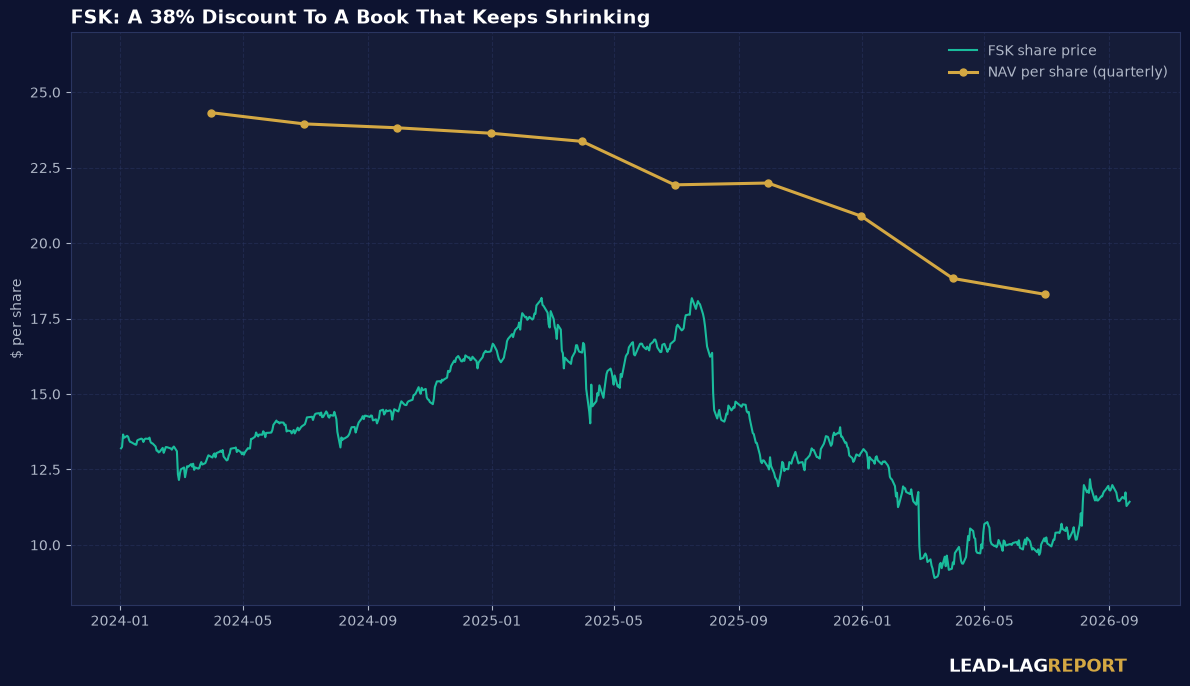
The price and NAV histories tell the whole story in two lines.
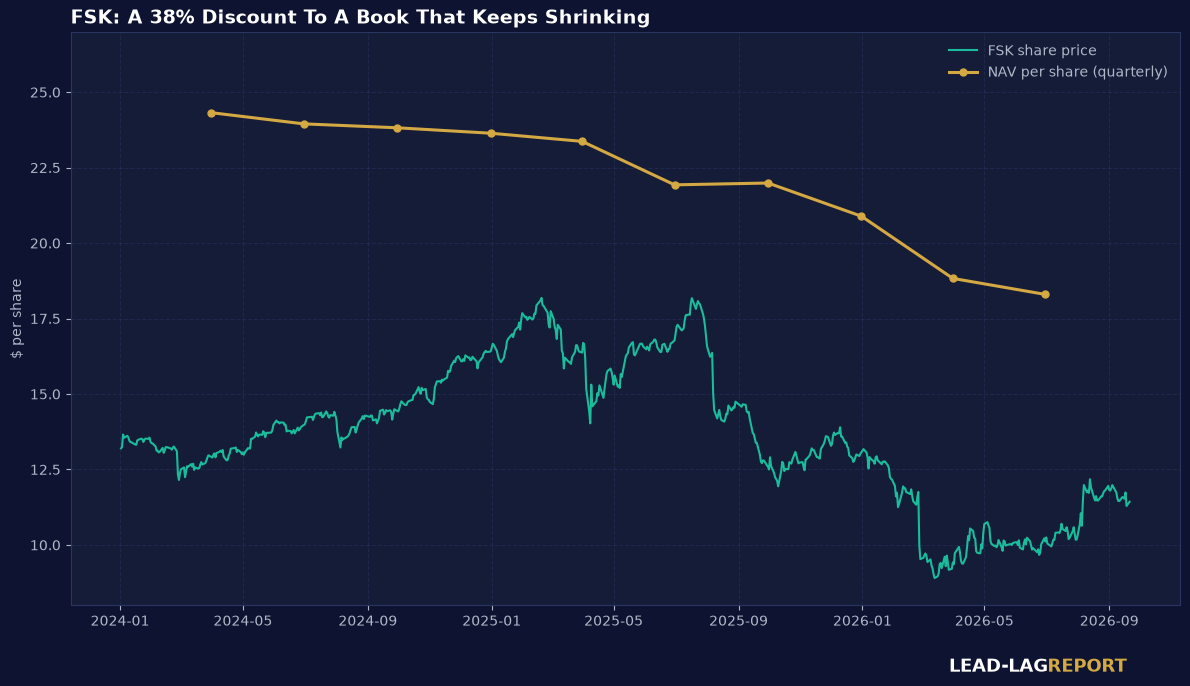
The NAV has declined every quarter of the past ten: $24.46 at year-end 2023, $23.64 at year-end 2024, $20.89 at year-end 2025, and $18.30 at June 30, 2026. The worst single step was the first quarter of 2026, when the book was marked from $20.89 to $18.83, a $2.06 reduction in a single quarter. The share price has followed with a lag, and the stock's 52-week range of $9.72 to $16.31 brackets a September 22 close of $11.31 that is down 14.2% year to date.
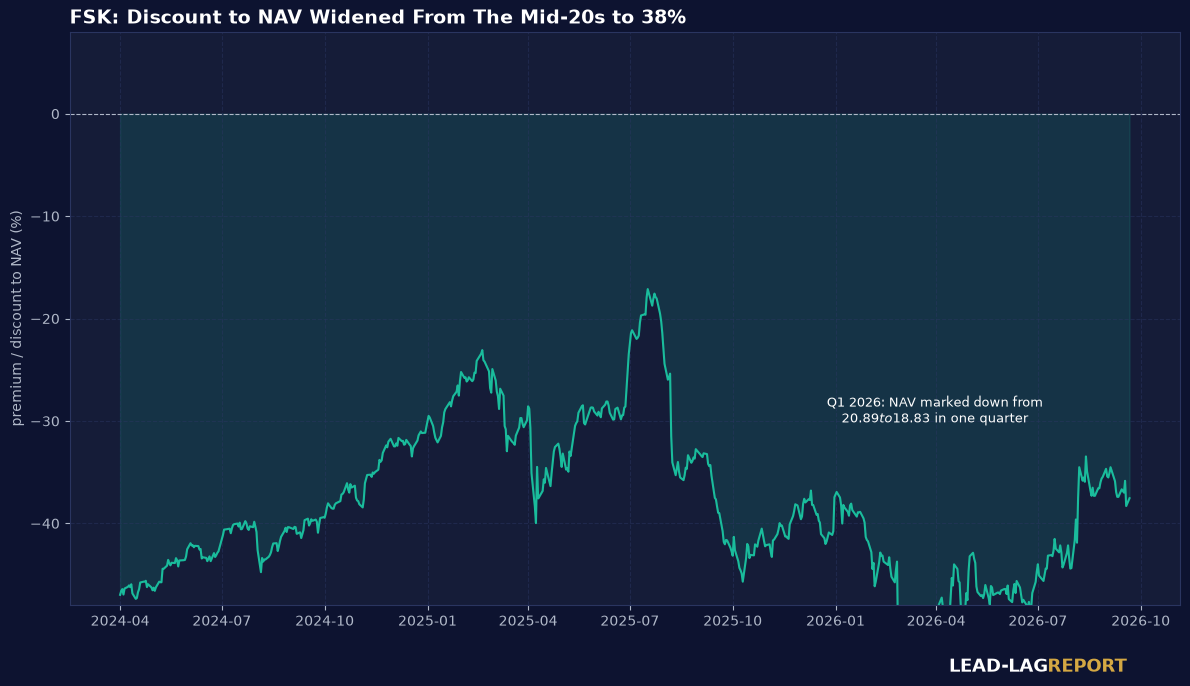
The discount itself has been widening on and off for two years, from the low twenties to 38%. Notice what that means mechanically: a holder who bought the discount thesis a year ago at a 25% gap has watched the gap widen and the book beneath it shrink at the same time. The discount is only a cushion if the NAV eventually stops falling.
Volatility Comparison
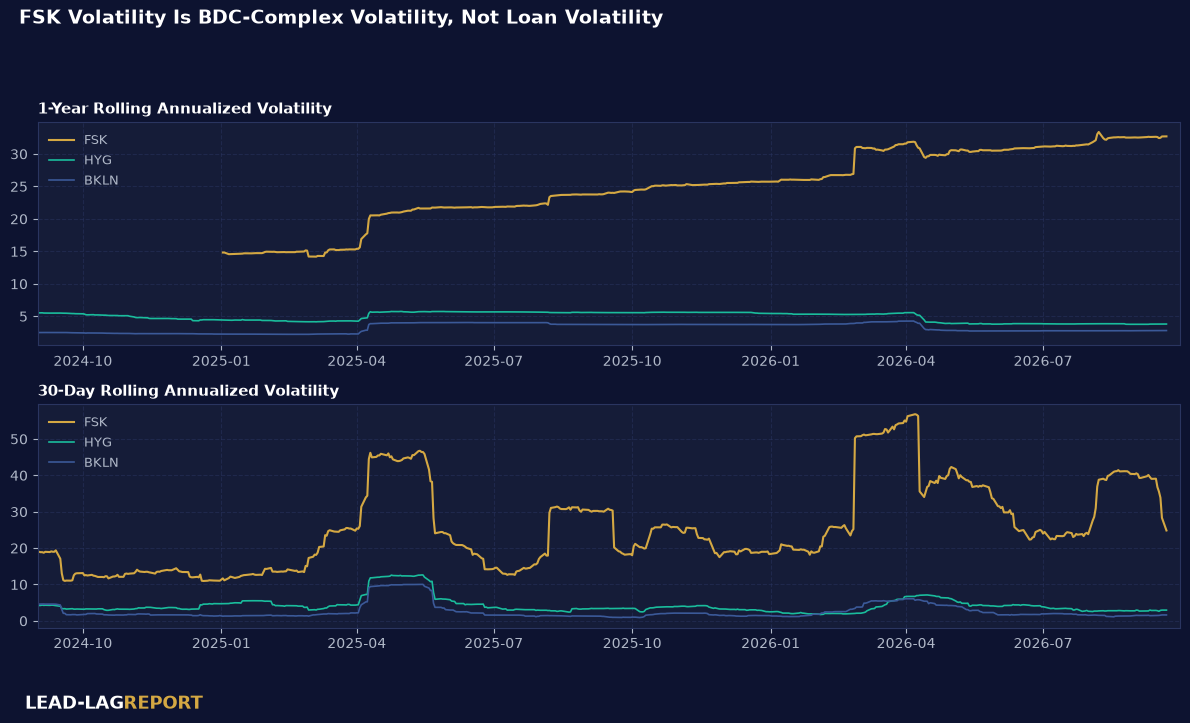
Measured against HYG and BKLN, the two largest traded proxies for leveraged loan and high yield credit, FSK's price volatility behaves like an equity, not a bond fund. That is the nature of a closed-end structure with a fixed share count: the price is set by discount sentiment, which swings with every quarterly mark and every non-accrual headline. The underlying loans are illiquid and appraised quarterly, but the shares trade by the second, and the gap between those two clocks is where the volatility lives.
Macro Environment
The macro backdrop for this fund is the ongoing private credit repricing. After the 2025 blowups put manager-produced marks under public scrutiny, the market has applied a simple heuristic: the wider and faster a BDC's NAV has fallen, the wider the discount it must offer. FSK's ten consecutive quarterly NAV declines put it on the wrong side of that heuristic, fairly or not.
The earnings picture is the part I would watch most closely. Net investment income per share has fallen from $0.57 to $0.44 over four quarters, and the top line is shrinking alongside it. The sponsor's countermeasures, the KKR tender, the preferred issuance that repaired leverage, and the buyback authorization, are real capital-allocation signals, but they address the capital structure, not the spread compression that drives earnings. If investment income keeps declining, the pass-through dividend declines with it, and the 15.6% forward figure becomes a memory rather than a forecast. The intermediate-term risk/reward here is acceptable only for investors who treat the discount as compensation for mark risk they have consciously chosen to bear.
Distribution Policy
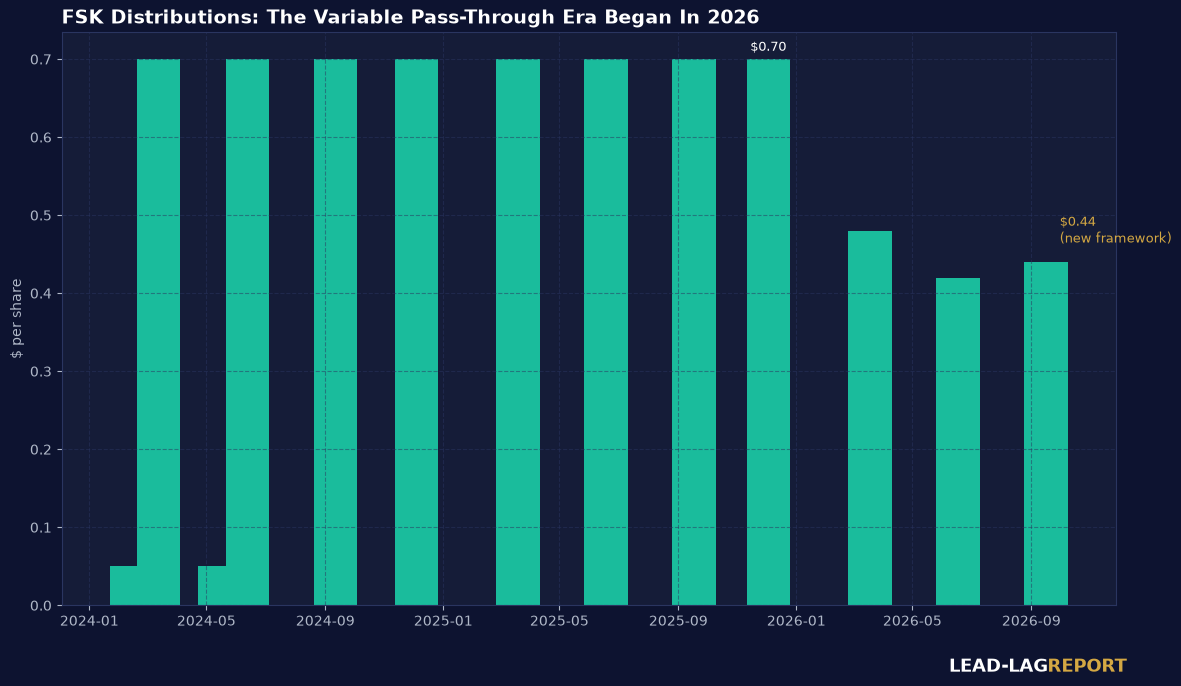
Everything about the distribution changed in 2026. Through 2025 the fund paid $0.70 per quarter, a fixed payout that outran what the portfolio earned. The new framework pays out 100% of the prior quarter's GAAP net investment income, nothing more. The result was an immediate reset: $0.48 declared for the first quarter, $0.42 for the second, and $0.44 for the third, payable October 2 to holders of record September 16.
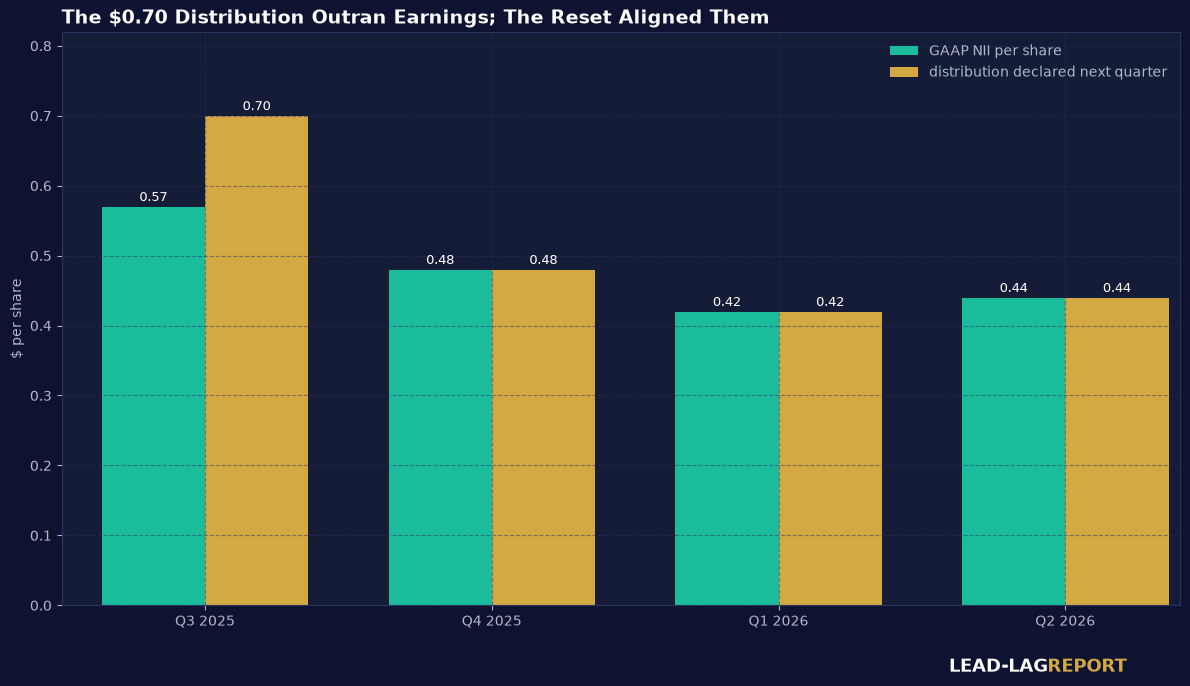
The chart above is the whole argument for the new policy: the $0.70 distribution was roughly 23% above what the portfolio actually earned in the quarter that preceded it, and the reset aligned the two lines. The forward yield of 15.6% is simply four times the most recent $0.44 payment divided by the share price. It is a run-rate, not a commitment, and treating it as guaranteed income is the single biggest mistake an income investor could make with this fund.
Advantages
You are being paid to accept mark risk. A 38% discount to book is a wide margin of safety if even three-quarters of the stated NAV is ultimately real, and the distribution provides substantial income while the question resolves.
The variable distribution is more honest than the old fixed one. A payout equal to 100% of prior-quarter earnings cannot systematically hand back your own capital to sustain an illusion, which was precisely the failure mode of the $0.70 era.
There is sponsor skin in the game. The KKR tender, the $300 million buyback authorization, and the preferred recapitalization all signal that the manager believes the assets are worth more than 62 cents on the dollar, and the buyback is mechanically accretive to NAV when shares trade this far below book.
Disadvantages
The book keeps shrinking. A 25% NAV decline over ten quarters is not a rounding error, and every quarter of continued markdowns converts discount-cushion math into a treadmill where the price follows the NAV down.
Earnings are compressing. Investment income fell 24% year over year in the first quarter and fell again in the second, which means the pass-through distribution is likely to drift lower, not higher, until the top line stabilizes.
Credit is migrating the wrong way. Two new non-accruals in a single quarter, $104 million at cost, is not a crisis in an $11.4 billion portfolio, but it is the direction of travel that ended the $0.70 dividend in the first place.
The preferred stands ahead of you. A $150 million convertible preferred with a fixed dividend now ranks ahead of the common distribution, and leverage that touched 131% debt to equity at March 31 leaves less room to absorb further NAV declines.
Conclusion
FSK is the deepest value framing in today's BDC complex: 62 cents on the dollar for an $11.4 billion middle market loan book, with a distribution that now honestly reports what the portfolio earns. The bear case does not require a credit crash. It only requires the NAV to keep falling at anything like its recent pace, in which case your total return is roughly the distribution minus the erosion.
Short-term, the income mechanics are sound: the pass-through design means the payout is covered by definition, and the buyback and tender put a bid under the discount. Long-term, this is a bet on mark credibility in middle market credit, and ten straight NAV declines are the standing argument against it. Income investors who need a predictable check should not own a variable payer at all. Value investors willing to read a quarterly mark and size the position for a NAV shock are, at 62 cents, being paid enough to consider it.
The Lead-Lag Report is provided by Lead-Lag Publishing, LLC. All opinions and views mentioned in this report constitute our judgments as of the date of writing and are subject to change at any time. Information within this material is not intended to be used as a primary basis for investment decisions and should also not be construed as advice meeting the particular investment needs of any individual investor. Trading signals produced by the Lead-Lag Report are independent of other services provided by Lead-Lag Publishing, LLC or its affiliates, and positioning of accounts under their management may differ. Please remember that investing involves risk, including loss of principal, and past performance may not be indicative of future results. Lead-Lag Publishing, LLC, its members, officers, directors and employees expressly disclaim all liability in respect to actions taken based on any or all of the information on this writing.