An 11.7% Junk Yield Where A Quarter Of The Check Is Your Own Money
BlackRock's HYT pays $0.0779 monthly, an 11.7% yield at its widest discount in a year. But about a quarter of the check is return of capital.

Today's Lead-Lag Report post is sponsored by Relative Sentiment
The Relative Sentiment Tactical Allocation ETF is a flexible, multi-asset fund that invests across stocks, bonds, commodities, precious metals, and currencies. Its approach is guided by a research-based factor called relative sentiment — which tracks how optimistic or cautious professional investors are compared to individual investors. Studies show professionals tend to have an edge over time, and this ETF seeks to capture that insight by increasing exposure to areas where institutions are more optimistic and reducing exposure where they're more cautious. Relative sentiment often complements trend-following strategies, helping create portfolios that may be more balanced and less prone to sharp swings.
The Fund's investment objectives, risks, charges and expenses must be considered carefully before investing. This and other important information is contained in the Prospectus and SAI, which may be obtained by following the links or by calling +1.215.882.9983. Please read the prospectus carefully before investing.
Investments involve risk. Principal loss is possible.
The Fund is distributed by PINE Distributors LLC.
ETFAC-4976143-11/25
DISCLAIMER – PLEASE READ: This is sponsored advertising content for which Lead-Lag Publishing, LLC has been paid a fee. The information provided in the link is solely the creation of Relative Sentiment. Lead-Lag Publishing, LLC does not guarantee the accuracy or completeness of the information provided in the link or make any representation as to its quality. All statements and expressions provided in the link are the sole opinion of Relative Sentiment. and Lead-Lag Publishing, LLC expressly disclaims any responsibility for action taken in connection with the information provided in the link.
Key Highlights
- Yield: 11.7% on the $0.0779 monthly managed distribution ($0.9348 annualized against an $7.95 price)
- Discount: 10.41% to NAV as of September 18 (CEFConnect), versus a 52-week average of 6.31% and a 52-week widest of 10.65%
- Distribution source: roughly 73% net investment income and 27% return of capital in the recent monthly allocation; 68% and 32% for the fiscal year to date
- Structure: $1.578 billion net assets, 20.54% effective leverage, 3.49-year effective duration, 7.01% average portfolio coupon
- Event: a rights offering announced December 15, 2025 preceded the slide from near-par to today's wide discount
Every week, we'll profile a high yield investment fund that typically offers an annualized distribution of 6-10% or more. With the S&P 500 yielding less than 2%, many investors find it difficult to achieve the portfolio income necessary to meet their needs and goals. This report is designed to help address those concerns.
An 11.7% Check, A Quarter Of Which Is Your Own Money
High yield closed-end funds live and die by three numbers: the discount, the leverage, and what the distribution is actually made of. Earlier today I profiled a business development company at 62 cents on its stated book value, where the question was whether the private marks were real. This afternoon's fund flips the question entirely, because a bond CEF's portfolio is marked daily against traded prices. The book is real. The question is whether the payout is.
BlackRock Corporate High Yield Fund (HYT) pays $0.0779 every month, good for an 11.7% yield on the September 22 close of $7.95, and the fund trades at a 10.41% discount to NAV, at the wide end of its 52-week range. The catch sits in the fund's own 19(b) disclosures: about a quarter of each recent monthly check is return of capital rather than investment income. For an income investor, understanding what that split means for a fund bought below NAV is the difference between a well-covered yielder and a slow leak.
Fund Background
HYT is a non-diversified, closed-end management investment company managed by BlackRock Advisors, seeking high current income and capital appreciation through a portfolio of below-investment-grade corporate bonds. It is one of the oldest and largest names in the taxable high yield CEF space, with $1.578 billion in net assets, $2.004 billion in total assets, and 163.05 million shares outstanding.
The structural facts, from CEFConnect as of September 18 and the fund's own disclosures:
- Share price of $8.00 on September 18 ($7.95 at the September 22 close) versus an NAV of $8.93, a 10.41% discount
- Effective leverage of 20.54%, or $444.92 million of effective leveraged assets
- Average portfolio coupon of 7.01% and effective duration of 3.49 years
- A monthly managed distribution of $0.0779 per share, held flat across the recent monthly allocation notices
- A 12-month NAV total return of 5.14% and a five-year average annual NAV total return of 3.87%
- Net asset value of $9.65 versus an $8.90 closing price at December 31, 2025
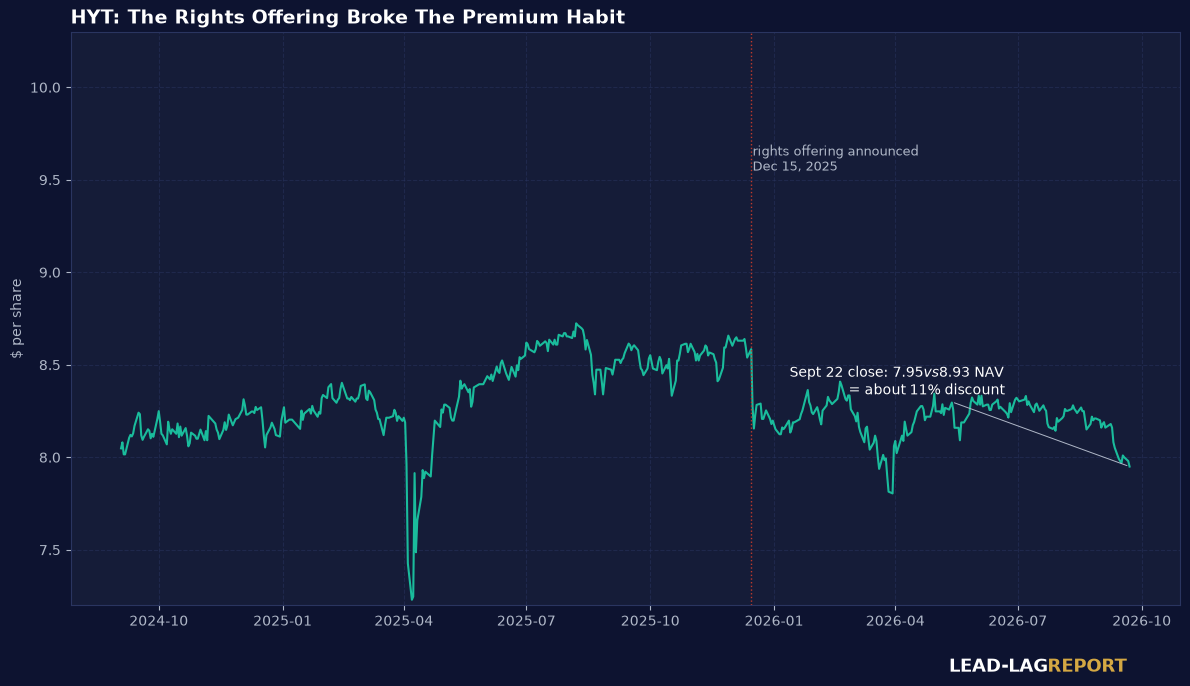
In January 2026 the fund completed a rights offering, announced December 15, 2025, which raised equity at a subscription price floored relative to NAV. Rights offerings are how leveraged CEFs grow asset bases without issuing shares at permanent discounts, but they reliably knock the share price off its pedestal for a while, and this one preceded HYT's slide from near-par to the widest discount in its 52-week window.
Portfolio Composition
By design, this is a concentrated, short-duration junk book: effective duration of 3.49 years against an average coupon of 7.01%, run with a modest 20.54% of effective leverage. Short duration is the fund's distinguishing feature within the high yield CEF peer group, and it is why HYT has historically held NAV drawdowns tighter than longer-duration peers when rates move. The differences that matter among junk CEFs are how long they run and how much they borrow, and HYT runs short and borrows comparatively little.
What the composition does not do is escape credit beta. A leveraged book of below-investment-grade paper will track the high yield cycle, and the 5.14% one-year NAV total return shows a year in which income did its job while the underlying asset class produced a modest total result. The monthly 19(b) allocation notices are the window into the income engine, and the split between earned income and return of capital is the heart of this analysis.
Historical Performance
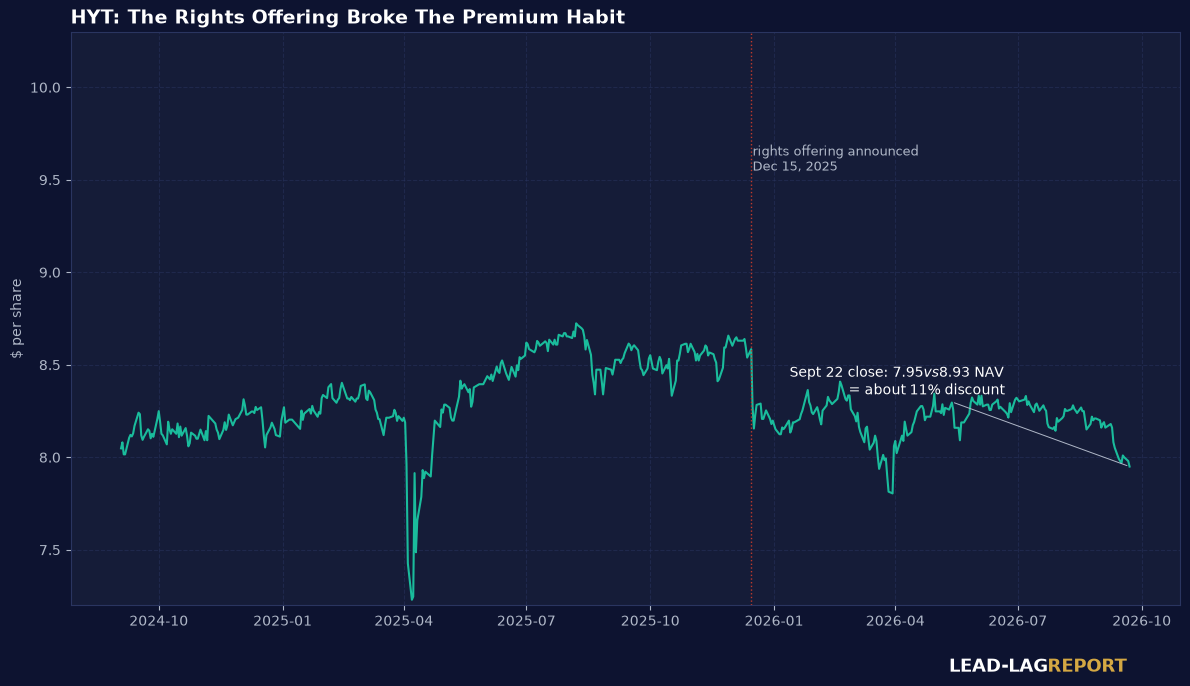
The price history shows the rights offering as the inflection. Before it, HYT traded around par, at $8.90 against a $9.65 NAV at year-end 2025, a 7.77% discount. After it, the fund bled to the September 18 print of $8.00 against $8.93, and the September 22 close of $7.95 puts the discount near 11%. The 52-week price range of $7.95 to $9.57 means the stock has just touched its low, a fact that cuts both ways: sentiment is at its worst in a year, and momentum has no friends.
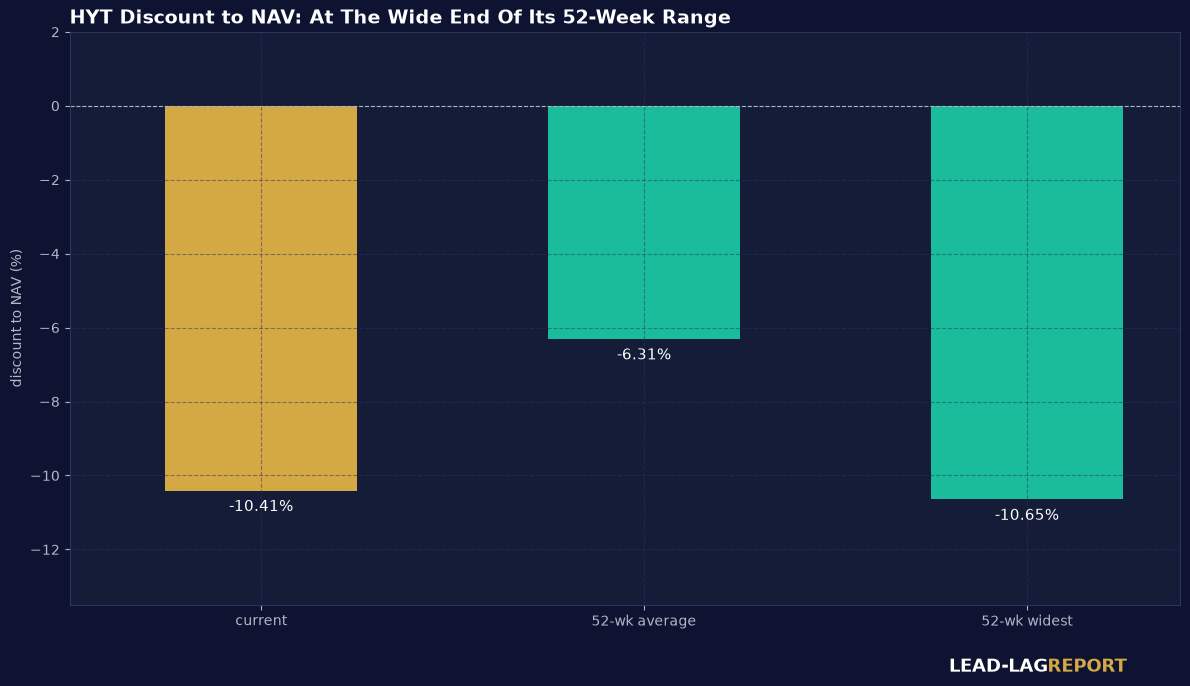
On NAV, the fund has delivered a 5.14% one-year total return and a 3.87% five-year annualized pace, with year-to-date NAV up 2.65% against a price up only 0.35%. The gap between those two year-to-date numbers is the discount widening, and it is the second time in this piece that the same theme appears: the portfolio is doing its job while the market re-rates the wrapper.
Volatility Comparison
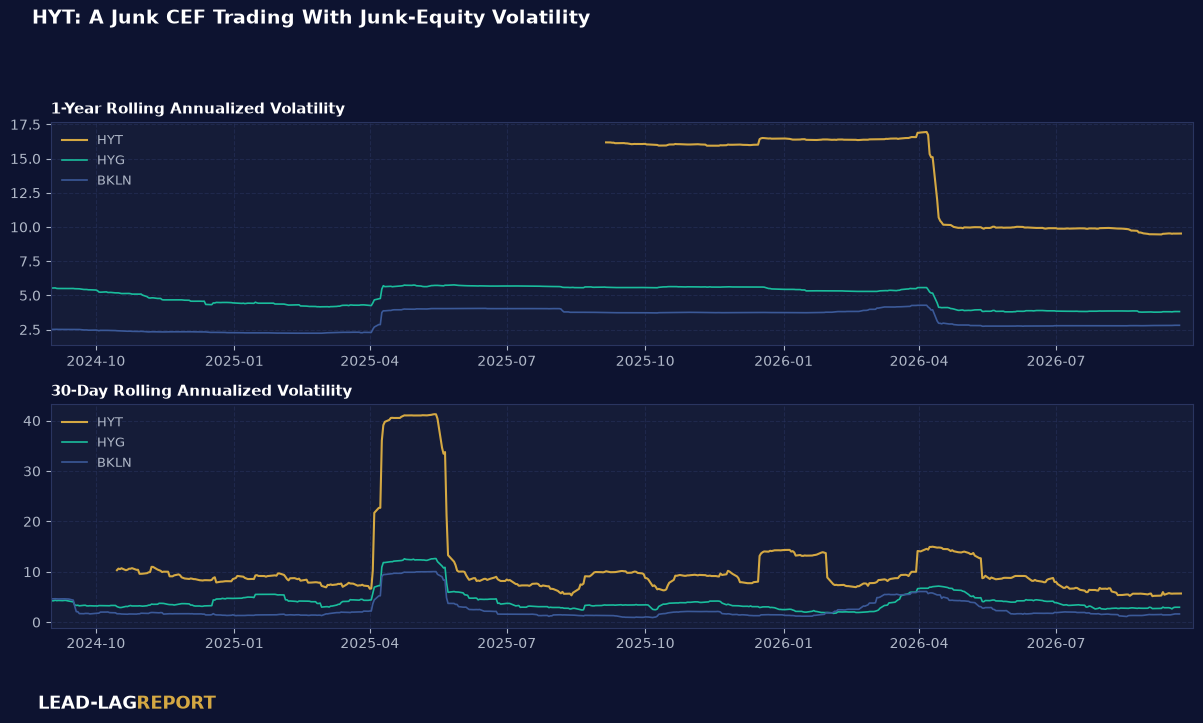
Against HYG, the high yield ETF benchmark, and BKLN, the leveraged loan proxy, HYT's price volatility runs persistently higher, and the reason is structural. HYG and BKLN are open-ended wrappers that trade within pennies of NAV, while HYT is a fixed-share CEF whose price also carries the premium/discount cycle on top of underlying credit volatility. The fund's short duration tames rate risk, but the leverage and the closed-end wrapper add a layer of price noise the ETFs do not have.
Macro Environment
The high yield backdrop for a fund like this is a carry story with two moving parts: the fund's borrowing cost, which floats with short rates, and its asset income, anchored by the 7.01% average portfolio coupon. The Fed's September rate hike lifts the cost side of that spread, while shorter-duration assets reprice their coupons upward with a lag. What hurts HYT specifically is a spread-widening event that hits both its junk book and its discount at once, the kind of move leveraged junk CEFs cannot dodge. With the discount already at its 52-week widest, some of that scenario is arguably in the price.
That is the macro setup I would frame for income investors: nothing about the current environment breaks this fund. Rising short rates lift its borrowing costs, but the short-duration book reprices upward too, and short-duration paper is the right place in the credit stack if the cycle turns.
Distribution Policy
HYT operates a managed distribution plan, meaning the $0.0779 monthly payout is set by policy rather than by realized income, with the composition disclosed monthly under the 19(b) rules. The recent monthly allocation estimate broke the $0.0779 into $0.057109 of net investment income and $0.020791 of return of capital, roughly a 73/27 split, and the fiscal year through August 31 shows a cumulative 68/32 split.
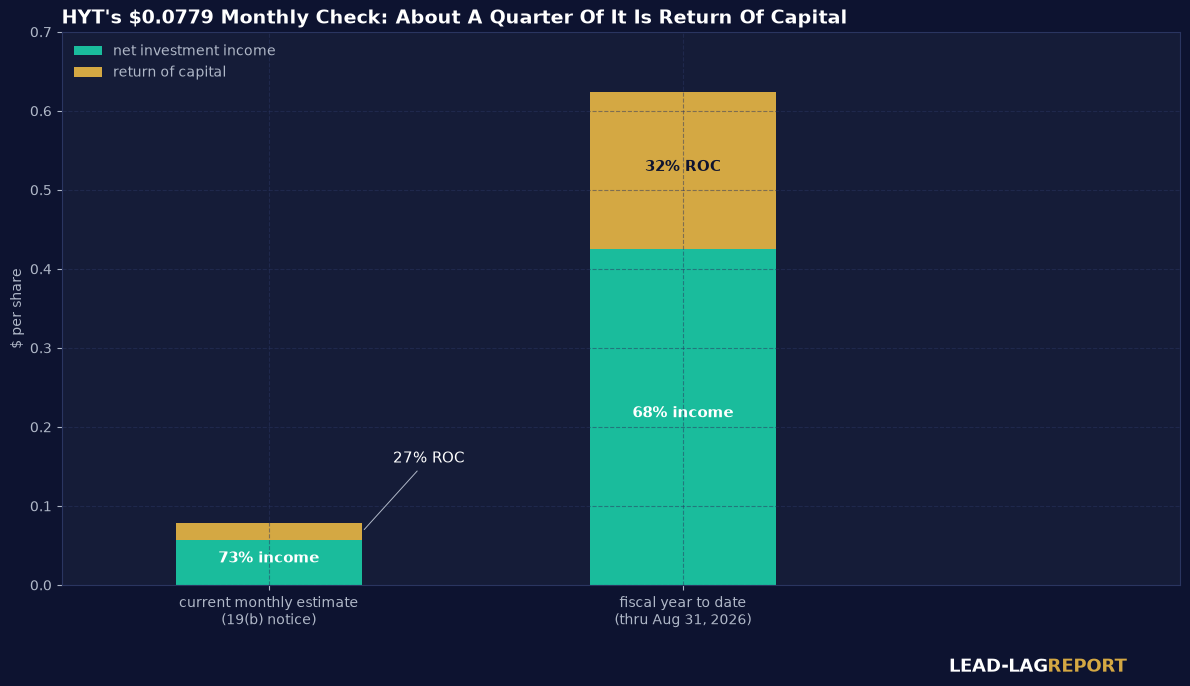
Return of capital is not automatically a defect, and the distinction matters most for a fund trading at a discount. When a CEF distributes a dollar while its shares trade at 90 cents of NAV, each distribution transfers value from departing NAV to the remaining holders, making the ROC mathematically accretive per share. The honest framing is that ROC at a discount is tolerated erosion of the base, not free income: it is why the NAV has drifted from $9.65 at year-end 2025 toward $8.93 today even as the market repriced the wrapper wider. Investors should treat the true income yield as the roughly 8.5% the investment-income component produces, and regard the rest as a managed return of the discount's own silver.
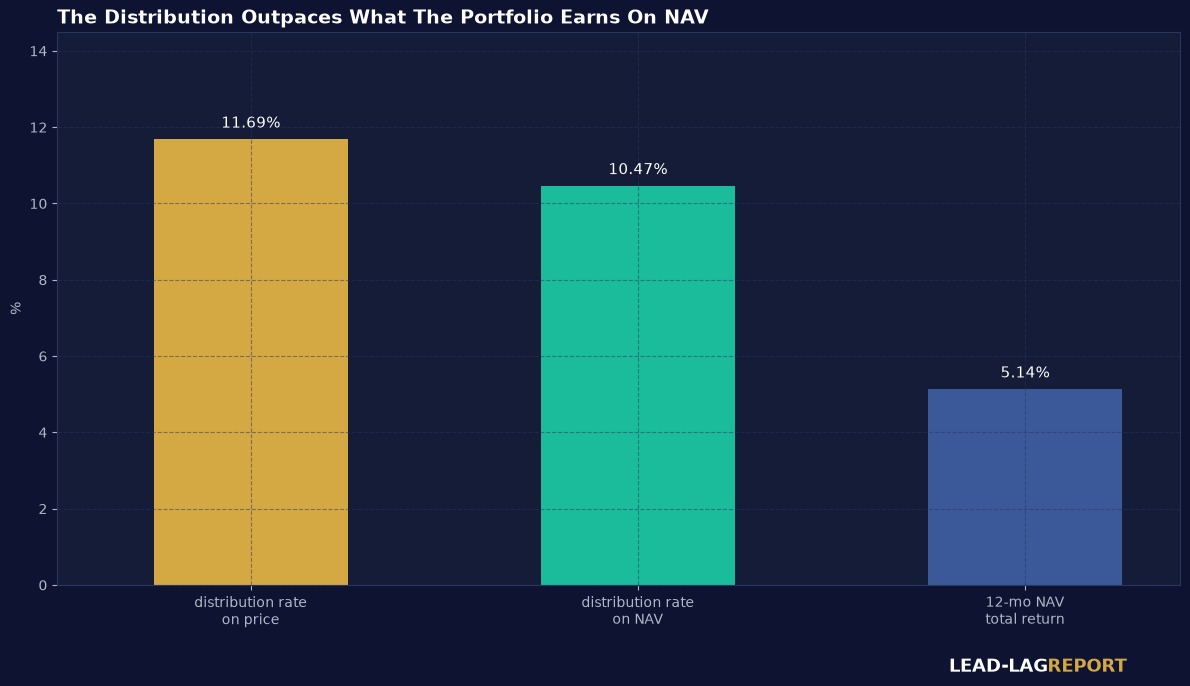
The chart above is the sustainability picture in one image: an 11.69% distribution rate on price and 10.47% on NAV against a 5.14% one-year NAV total return. The gap is the funded portion, and it is the single number I would re-check each month when the 19(b) notices publish.
Advantages
The discount is at its widest point in a year while the NAV has kept rising. Buying a fund 10% below a daily-marked bond book is the cleanest margin of safety the CEF complex offers, because here, unlike in private credit, the marks are not estimates.
Short duration plus modest leverage is the right risk shape for this part of the cycle. A 3.49-year duration with 20.54% leverage gives you high yield carry with far less rate risk than the long-duration CEF peer set.
The distribution is stable and monthly. A managed $0.0779 has held flat through the recent notices, and the monthly frequency compounds income efficiently for investors drawing cash.
Disadvantages
About a quarter of the distribution is return of capital. That is a slower NAV bleed rather than covered income, and the five-year annualized NAV total return of 3.87% against a double-digit distribution rate tells you the payout has exceeded portfolio results for a long time.
The discount can stay wide. CEF discounts are cheap for a reason and often stay cheap, and a rights offering that satisfied the leverage math has left the share price at its 52-week low with no mean-reversion guarantee.
Fee drag on a leveraged wrapper compounds. The expense load includes leverage costs that index alternatives do not carry, and for pure high yield beta, HYG does the job cheaper, with less volatility to boot.
Conclusion
HYT is a daily-marked, short-duration junk book selling at its widest discount in a year, paying a monthly check that is three-quarters earned income and one-quarter managed give-back. The bear case is not credit Armageddon; it is simply that ROC-funded distributions and a persistent discount slowly hollow out the total-return story while the headline yield flatters it.
Short-term, the setup favors patient income buyers: the discount is at 10.4% against a 6.3% one-year average, the NAV is rising year to date, and monthly cash arrives like clockwork. Long-term, treat this as an income-plus-mean-reversion trade sized to survive the discount staying wide, and mark the 19(b) income split each month as your tripwire: if ROC creeps materially above a third, the payout is out-running the book and the story has changed. Investors who need pure earned income should prefer the ETF wrappers; investors who want paid to wait out a wide discount on an honest book could reasonably own this one.
The Lead-Lag Report is provided by Lead-Lag Publishing, LLC. All opinions and views mentioned in this report constitute our judgments as of the date of writing and are subject to change at any time. Information within this material is not intended to be used as a primary basis for investment decisions and should also not be construed as advice meeting the particular investment needs of any individual investor. Trading signals produced by the Lead-Lag Report are independent of other services provided by Lead-Lag Publishing, LLC or its affiliates, and positioning of accounts under their management may differ. Please remember that investing involves risk, including loss of principal, and past performance may not be indicative of future results. Lead-Lag Publishing, LLC, its members, officers, directors and employees expressly disclaim all liability in respect to actions taken based on any or all of the information on this writing.