
If The Federal Reserve Won't Cut, Turn Up The Volume. Introducing The Leveraged Version Of The Tech-Volatility Harvest.
TDAX applies a ~1.3× daily leveraged wrapper to TDAQ's Nasdaq-100 0DTE covered call engine, with weekly distributions. A look at the current volatility regime and why the setup fits this wrapper.

How TDAX Applies A ~1.3× Daily Wrapper To The Same Nasdaq-100 0DTE Covered Call Engine — And Why The Current Volatility Regime Is Exactly The Setup It's Built For
Key Highlights
- The Federal Reserve held the federal funds rate at 3.50–3.75% on
June 17, 2026, removed the cut bias from its statement, and the
median dot for year-end 2026 sits at 3.85% — implying a possible
hike rather than a cut before year-end. - Goldman Sachs Research has pushed the first projected rate cut to
June 2027. The volatility regime that funds premium-harvest
strategies is now structurally supported for the foreseeable
horizon. - The Nasdaq-100 VIX closed at 27.98 on July 2, 2026 — 41.7%
above one year ago and roughly 12 points wide of the S&P 500 VIX
(15.90). Tech volatility is where the risk premium is. - TDAX — the TDAQ LIFT ETF — targets approximately 130% of the
daily performance of TDAQ, the TappAlpha Innovation 100 Growth &
Daily Income ETF. It applies leverage to the same daily 0DTE covered
call engine on the Nasdaq-100, and it distributes weekly — not
monthly. - Since its January 7, 2026 inception, TDAX has grown to $43.3M in
AUM with a 23.63% distribution rate and 20.63% trailing
12-month distribution yield, making it the fastest-growing fund in
the T² Lift™ series.
TDAX 30-Day SEC Yield: 1.43% | TDAQ 30-Day SEC Yield: -0.23% (as of
6/30/26)
Standardized performance: TDAX:
https://www.tappalphafunds.com/etfs/tdax
| TDAQ:
https://www.tappalphafunds.com/etfs/tdaq
Click here for the TSYX prospectus, the TDAX prospectus, or the TDAQ prospectus.
The performance data quoted represents past performance. Past
performance does not guarantee future results. The investment return and
principal value of an investment will fluctuate so that an investor's
shares, when sold or redeemed, may be worth more or less than their
original cost and current performance may be lower or higher than the
performance quoted. Performance current to the most recent month-end can
be obtained above. Returns less than one year are not annualized.
Short term performance, in particular, is not a good indication of the
fund's future performance, and an investment should not be made based
solely on returns. The Fund does not have a track record of reporting to
investors or widely available research coverage which may result in
price volatility.
Market performance is the price at which shares in the ETF can be
brought or sold on the exchanges during trading hours, while the net
asset value (NAV) represents the value of each share's portion of the
fund's underlying assets and cash at the end of the trading day.
Two weeks ago in this space I wrote about TDAQ — TappAlpha's
Nasdaq-100 covered call ETF — and the structural case for harvesting
the volatility risk premium in tech when the Federal Reserve has just
told the market there are no rate cuts coming. That case has only
strengthened. The Nasdaq-100 VIX has drifted higher, not lower, in the
two weeks since. The spread between tech vol and broad-market vol has
widened, not compressed. And the Fed's June dot plot — a median
year-end 2026 fed funds rate of 3.85%, above current levels — has done
nothing but harden the market's expectation that the accommodative
pivot is now an 18-month wait, at minimum. (Federal
Reserve,
FRED)
Which surfaces a follow-up question I've been getting from advisors and
income-oriented allocators over the past two weeks: If the volatility
risk premium in the Nasdaq-100 is as durable and as rich as you say it
is — why not lean into it harder?
The instinct is not wrong. And the product built for exactly that
instinct now exists. It is called TDAX — the TDAQ LIFT ETF — and
it applies approximately 130% daily leverage to TDAQ's covered call
engine. Same underlying strategy. Same Nasdaq-100 volatility premium
harvest. Weekly distributions instead of monthly. And a set of tradeoffs
that need to be understood clearly before anyone considers it. This
piece walks through the mechanics, the current market setup, and where
TDAX fits — and just as importantly, where it does not.
The Same Engine, Turned Up
TDAX is the second fund in TappAlpha's newly-launched T² Lift™
Series, which itself is the leveraged wrapper around the Core+ Series.
(TappAlpha)
The Core+ Series — TSPY (S&P 500) and TDAQ (Nasdaq-100) — writes
daily 0DTE covered calls against the underlying index ETF. The T² Lift™
Series does the same thing, at approximately 1.3× the daily exposure.
Mechanically, TDAX seeks 130% of the daily performance of TDAQ. TDAQ
holds QQQM — Invesco's Nasdaq-100 ETF — and writes out-of-the-money
call options against it every trading day, with each option expiring at
the close of that same session. TDAX layers ~1.3× daily leverage on top
of that structure. The theta-decay engine runs at the same cadence. The
premium collected is amplified. And because leverage is being applied to
both the underlying index exposure and the options overlay, the
distributions arrive faster and larger — hence the shift from monthly
(TDAQ) to weekly (TDAX).
The distribution numbers make the amplification concrete. TDAQ,
unlevered, is currently posting a distribution rate of 16.98% and a
12-month trailing distribution yield of 15.93%.
(TappAlpha)
TDAX, at 1.3× the daily exposure, posts a distribution rate of
23.63% and a 12-month trailing distribution yield of 20.63%.
(TappAlpha)
The math is not a mystery. Leverage the strategy roughly 1.3×, get
roughly 1.3× the harvested premium.
But that math is one-directional. Leverage amplifies the downside as
well. And the downside — for reasons that have nothing to do with
TappAlpha's strategy and everything to do with how leveraged ETFs
mechanically function — needs to be understood before the upside math
means anything.
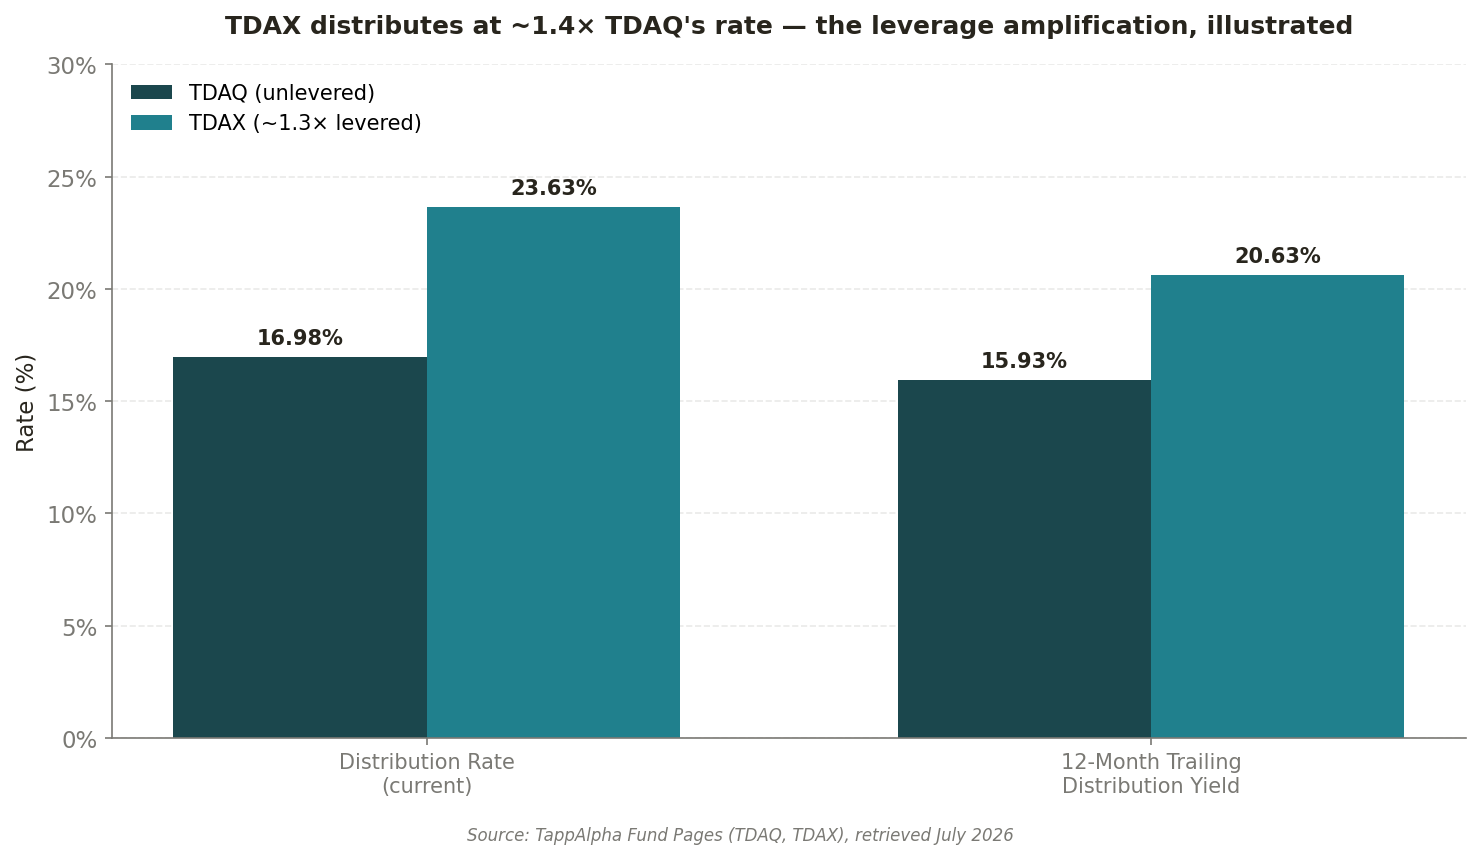
Figure 1: Distribution rates for the two Nasdaq-100 covered call
vehicles in the TappAlpha lineup. TDAX's 23.63% rate reflects ~1.3×
the daily premium harvest of TDAQ's underlying 0DTE overlay. (Source:
TappAlpha Fund Pages)
Click here for the TSYX prospectus, the TDAX prospectus, or the TDAQ prospectus.
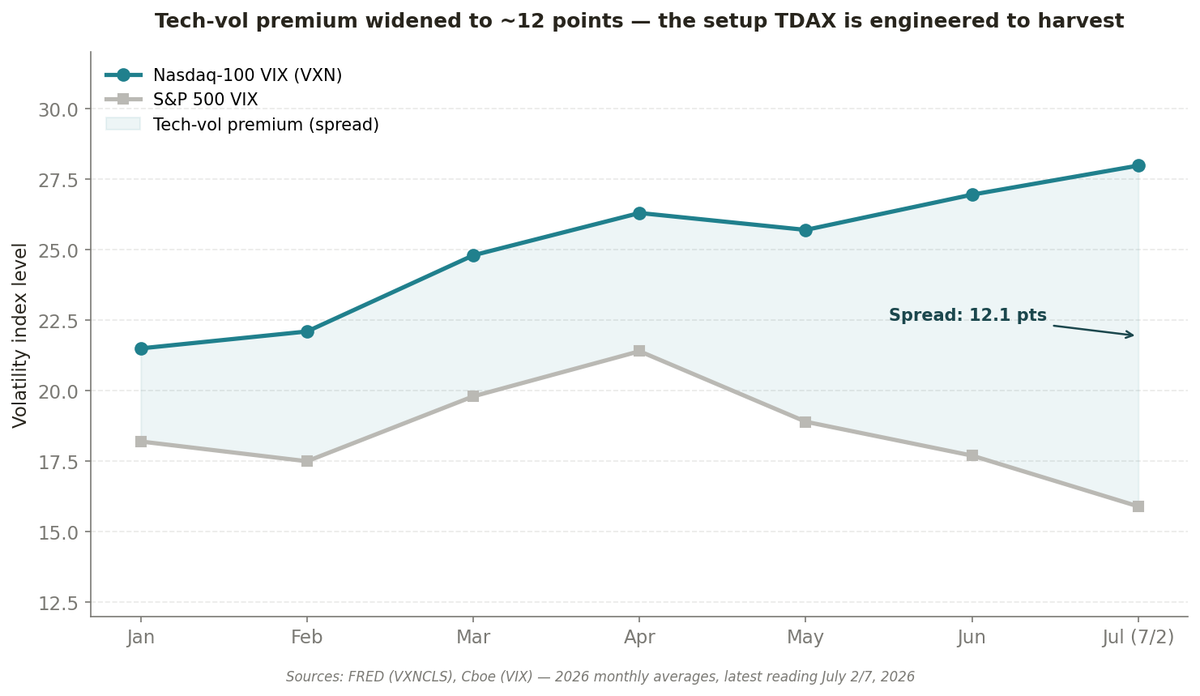
The Volatility Setup In One Chart
The reason to have this conversation now — rather than six months ago
or six months from now — is the current cross-section of volatility,
which is telling income investors something unusually specific.
The S&P 500 VIX closed at 15.90 on July 7, 2026. (Business
Insider)
That is a calm reading — below the 17.5 long-run average and well
inside the "MID" band that has dominated the last two years. The
Nasdaq-100 VIX, over the same window, closed at 27.98 on July 2.
(FRED) That
is a 41.7% increase versus one year ago, and it represents a roughly
12-point spread over the broad-market VIX — one of the widest
tech-vs-broad vol dislocations of the current cycle.
That spread is not noise. It reflects specific, identifiable pricing: AI
capex skepticism, mega-cap concentration risk, and earnings-driven
dispersion that is concentrated in the tech complex to a degree it is
not concentrated in the broader index. Options sellers on the Nasdaq-100
are being paid materially more, per unit of underlying exposure, than
options sellers on the S&P 500. When you layer 1.3× daily leverage on
top of that spread, the per-day premium harvest amplification is the
entire point of the wrapper.
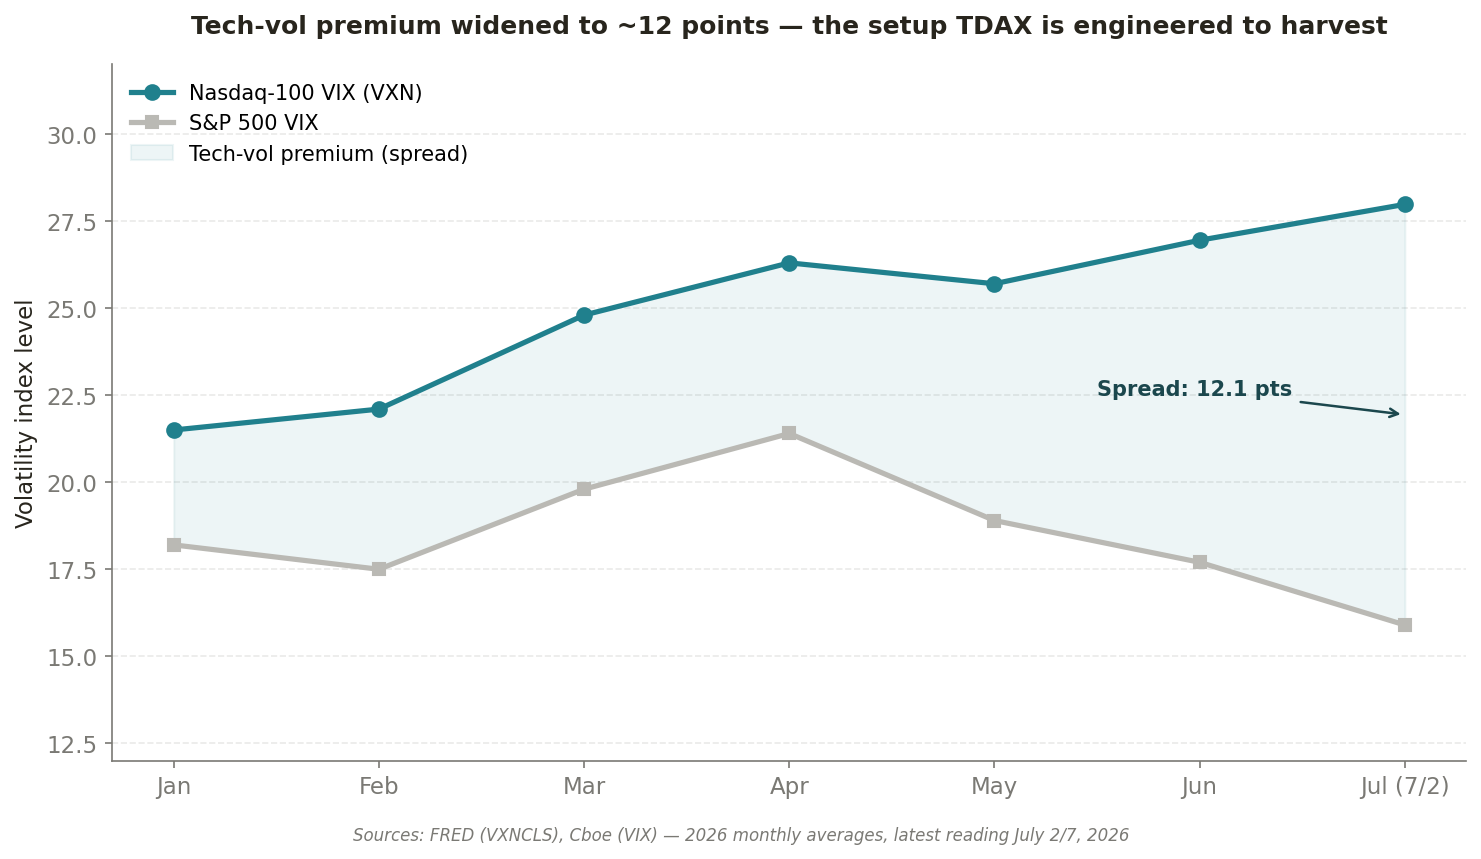
Figure 2: The tech-vol premium — the spread between the Nasdaq-100
VIX and the S&P 500 VIX — has widened to roughly 12 points, one of the
widest readings of the cycle. This is where the leveraged wrapper
harvests its incremental premium. (Sources: FRED VXNCLS, Cboe VIX)
Click here for the TSYX prospectus, the TDAX prospectus, or the TDAQ prospectus.
The Daily-Reset Mechanic That Everyone Needs To Understand
Leveraged ETFs do not deliver 1.3× the underlying's return over a
month, a quarter, or a year. They deliver approximately 1.3× the
underlying's daily return, and then the leverage resets at the end of
each trading day. (Leverage
Shares,
CMC
Markets)
Over longer holding periods, the daily reset produces a path-dependency
effect that is well-known in the derivatives literature and often
misunderstood by retail investors. In a trending market — one that
moves consistently in a single direction — the daily reset compounds
in favor of the leveraged holder, and returns can exceed a naïve 1.3×
calculation. In a choppy or mean-reverting market — one that
oscillates around a range with elevated realized volatility — the
daily reset produces what is called volatility decay: a mathematical
drag on returns that scales with the square of the leverage and the
variance of the underlying. (SIAM Financial
Mathematics)
The formula, for those who want it, is roughly: long-run leveraged
return ≈ (Leverage × Index Return) − (½ × Leverage × (Leverage − 1) ×
Index Variance). The second term is the decay penalty. At 1.3× leverage,
the penalty is materially smaller than at 2× or 3× — the (Leverage ×
(Leverage − 1)) term is 0.39 for a 1.3× fund versus 2.0 for a 2× fund
and 6.0 for a 3× fund — but it is not zero. It is a real feature of
any daily-reset leveraged product, and it needs to be priced into any
allocation decision.
What this means practically: TDAX is not a buy-and-hold-for-a-decade
product. It is a tactical wrapper, and the daily-reset mechanic is one
of the reasons it distributes weekly — the fund is engineered to
return capital and premium to investors on a cadence that matches its
intended holding profile.
For allocators who understand this — and who see the current 12-point
tech-vol spread as a durable feature of the
hawkish-Fed-meets-sticky-inflation regime rather than a passing anomaly
— the leveraged wrapper is a considered tool. For allocators who
don't, TDAQ (unlevered) remains the more forgiving vehicle and delivers
15.93% trailing distribution yield without any leverage layer.
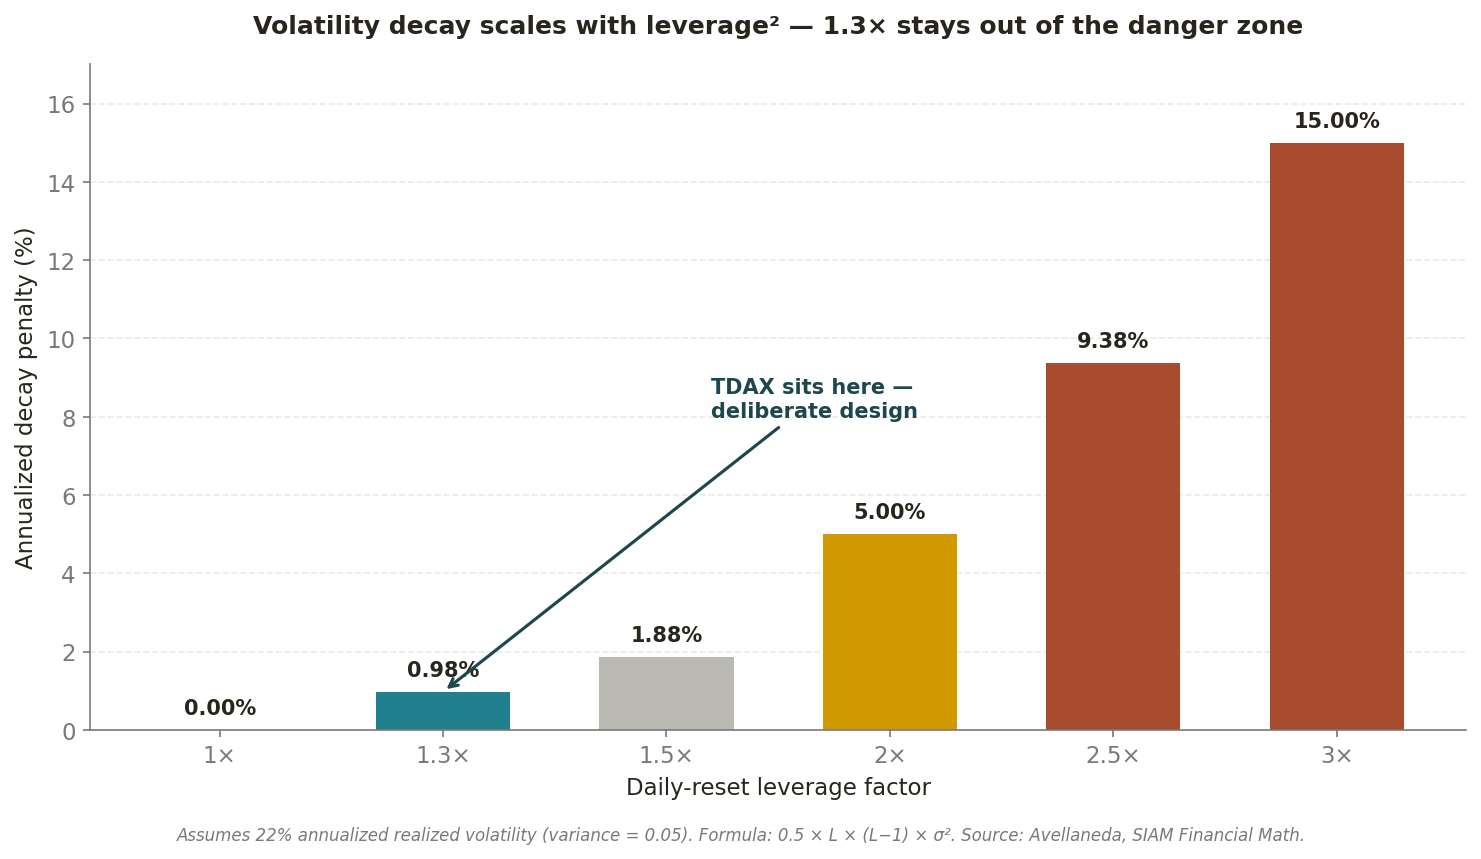
Figure 3: The volatility-decay penalty on daily-reset leveraged
products scales with (Leverage × (Leverage − 1)). At 1.3×, the penalty
is materially smaller than at 2× or 3×, which is a deliberate design
choice of the T² Lift™ Series.
Why 1.3× And Not 2× Or 3×
The leverage number is not arbitrary. The T² Lift™ Series was engineered
at ~1.3× specifically to be additive to a Core+ allocation without
pushing the volatility-decay penalty into a range that would swamp the
incremental premium harvest during choppy periods.
Consider a mean-reverting market with an annualized realized variance of
~0.05 (roughly consistent with a 22% realized vol regime, which is
where the Nasdaq-100 has been running). The decay penalty on a 1.3× fund
in that environment is roughly (½ × 1.3 × 0.3 × 0.05) = 0.98% per
year. Meaningful, but not catastrophic. The same regime applied to a
hypothetical 3× fund produces a penalty of roughly (½ × 3 × 2 × 0.05) =
15% per year, which is why 3× products are widely understood to be
trading vehicles rather than allocation vehicles.
TDAX sits deliberately in the middle: enough leverage to materially
amplify the premium harvest and the distribution rate, but not enough to
make the decay math dominate the return profile. Combined with the
weekly-distribution cadence — which mechanically deleverages the
investor's economic exposure every seven days by paying out realized
premium — the design is coherent for its target use case.
Where This Fits — And Where It Doesn't
TDAX is best understood as a sleeve within a broader income
allocation, not a core position. For advisors already using TDAQ or
another Nasdaq-100 covered call product in the income sleeve, TDAX
offers an amplification lever for the portion of the sleeve where higher
weekly cash flow is prioritized over long-run capital preservation. For
allocators building a barbell — deep-value dividend equities on one
end, high-premium options-overlay income on the other — TDAX can
occupy the concentrated end of the options-overlay barbell.
It is not a fit for tax-inefficient retail accounts where the weekly
distributions would compound short-term ordinary income treatment across
a full tax year. It is not a fit for allocators who expect to buy and
hold for five or ten years; the daily-reset mechanic makes that a
fundamentally different holding-period question than a plain-vanilla
ETF. And it is not a fit for anyone who is not already comfortable with
the underlying Nasdaq-100 exposure and its concentration in the mega-cap
tech complex — a 10% drawdown in the Nasdaq-100 will show up as
roughly a 13% drawdown in TDAX before any premium offset.
The compliance framing matters here. TDAX is a specialized wrapper. It
rewards allocators who understand both the underlying strategy (0DTE
covered calls on the Nasdaq-100) and the leverage overlay (daily-reset
1.3× exposure with weekly distributions). For allocators who want the
same underlying strategy without the leverage overlay, TDAQ exists. For
allocators who want the same strategy on the S&P 500, TSPY (unlevered)
and TSYX (1.3× levered) exist. TappAlpha has deliberately built a matrix
so allocators can dial in the exposure that fits the mandate.
The Bigger Picture
Two weeks ago, the message was: the Fed has told you there are no rate
cuts coming, so the income has to come from somewhere else, and
volatility is the largest structural source of that income currently
priced by the listed markets. That case has strengthened. The Nasdaq-100
VIX is higher. The tech-vs-broad vol spread is wider. And the June dot
plot has ratified the market's understanding that this is a regime, not
a passing episode.
The follow-up question — if the case is that strong, why not lean into
it harder — has a real answer, and the answer is TDAX. A ~1.3× daily
wrapper on the same tech-vol premium harvest engine. Weekly
distributions. A 20.63% trailing 12-month distribution yield. Engineered
leverage that sits well below the volatility-decay danger zone. And a
set of tradeoffs — the daily-reset mechanic, the amplified drawdown
risk, the tax treatment — that need to be understood clearly before it
enters any portfolio.
The regime is telling income investors something unusually clear:
volatility, especially in tech, is here for a while. TDAQ harvests it
monthly. TDAX harvests it weekly, at ~1.3× the cadence. For allocators
who understand the wrapper, and who see the current tech-vol spread as a
durable feature rather than a temporary anomaly, the leveraged version
is a considered addition to the toolkit.
We believe the Fed will not cut for another eighteen months, and that
the volatility will not compress until they do. That is the setup. TDAX
is one way to trade it.
Disclosure
This content is sponsored by TappAlpha. The Lead-Lag Report has been
compensated for the publication of this material. The views and opinions
expressed herein are those of the author and do not necessarily reflect
the views of TappAlpha or its affiliates.
This material is for informational and educational purposes only and
should not be construed as investment advice or a recommendation to buy,
sell, or hold any securities, including TDAX.
The fund currently expects, but does not guarantee, to make
distributions on a weekly basis. Distributions may exceed the fund's
income and gains for the taxable year. Distributions in excess of the
fund's current and accumulated earnings and profits will be treated as
a return of capital.
Investors should carefully consider the investment objectives, risks,
charges and expenses of the ETFs identified on this site. This and other
important information about the Fund are contained in the prospectus,
which can be obtained at tappalphafunds.com or by calling (844)
403-2888. The prospectus should be read carefully before investing.
The performance data quoted represents past performance. Past
performance does not guarantee future results. The investment return and
principal value of an investment will fluctuate so that an investor's
shares, when sold or redeemed, may be worth more or less than their
original cost and current performance may be lower or higher than the
performance quoted. Performance current to the most recent month-end can
be obtained above. Returns less than one year are not annualized.
Short term performance, in particular, is not a good indication of the
fund's future performance, and an investment should not be made based
solely on returns. The Fund does not have a track record of reporting to
investors or widely available research coverage which may result in
price volatility.
Market performance is the price at which shares in the ETF can be bought
or sold on the exchanges during trading hours, while the net asset value
(NAV) represents the value of each share's portion of the fund's
underlying assets and cash at the end of the trading day.
Leveraged ETF Risk: TDAX seeks daily leveraged investment results
and is intended to be used as a short-term trading vehicle. The Fund
does NOT seek to achieve its stated investment objective over a period
of time greater than a single trading day. Due to the daily rebalancing
of the Fund's exposure, the Fund's performance over periods longer
than a single day will likely differ, in amount and possibly direction,
from a simple multiple of TDAQ's performance over the same period.
Investors should monitor their Fund holdings on a daily basis.
Compounding and Market Volatility Risk: The Fund has a daily
leveraged investment objective. The Fund's performance for periods
greater than a single day will be the result of each day's returns
compounded over the period. In periods of high volatility, the Fund's
return over the same period may differ significantly from the leveraged
multiple of the return of TDAQ.
Investing involves risk. Principal loss is possible. The Fund's shares
will change in value, and you could lose money by investing in the Fund.
The Fund may not achieve its investment objectives. The Fund invests in
options contracts and derivatives that provide leveraged exposure to
TDAQ, which itself provides exposure to the Nasdaq-100® Index. This
subjects the Fund to certain of the same risks as if it owned shares of
companies that comprised the Nasdaq-100® Index, even though it does not
own shares of companies in the Index. The Fund will have exposure to
declines in the Nasdaq-100® Index, amplified by its leveraged exposure
to TDAQ.
The Nasdaq-100® Index is a widely recognized benchmark index that tracks
the performance of 100 of the largest non-financial companies listed on
the Nasdaq Stock Market. These companies represent a broad range of
industries, with a notable concentration in technology-related sectors.
The Index is market-capitalization weighted and includes companies
across sectors such as information technology, consumer discretionary,
communication services, healthcare, and industrials. As of December 31,
2023, the five largest sectors in the Index were information technology,
consumer discretionary, communication services, healthcare, and
industrials. The composition of the Index can change over time due to
market capitalization shifts, periodic rebalancing, and company
eligibility changes.
Regarding volatility, the Nasdaq-100® Index, like all market indices,
has experienced periods of significant daily price movements. Its higher
concentration in growth-oriented and technology-related companies can
contribute to greater short-term volatility compared to more diversified
indices. Despite these fluctuations, the Index has demonstrated strong
long-term performance over its history.
Due to the short time until their expiration, 0DTE options are more
sensitive to sudden price movements and market volatility than options
with more time until expiration. Because of this, the timing of trades
utilizing 0DTE options becomes more critical. Even a slight delay in the
execution of 0DTE trades can significantly impact the outcome of the
trade. 0DTE options may also suffer from low liquidity, making it more
difficult for the Fund to enter into its positions each morning at
desired prices. The bid-ask spreads on 0DTE options can be wider than
with traditional options, increasing the Fund's transaction costs and
negatively affecting its returns. These risks may negatively impact the
performance of the fund.
As of the date of this prospectus, the Fund has a limited operating
history and currently has fewer assets than larger funds. Like other new
funds, large inflows and outflows may impact the Fund's market exposure
for limited periods of time. This impact may be positive or negative,
depending on the direction of market movement during the period
affected.
Distributor: Foreside Fund Services, LLC, Member FINRA.
DISCLAIMER – PLEASE READ: This is a sponsored article for which
Lead-Lag Publishing, LLC has been paid a fee. Lead-Lag Publishing, LLC
does not guarantee the accuracy or completeness of the information
provided in the article or make any representation as to its quality.
All statements and expressions provided in this article are the sole
opinion of TappAlpha and Lead-Lag Publishing, LLC expressly disclaims
any responsibility for action taken in connection with the information
provided in the discussion. The content in this writing is for
informational purposes only. You should not construe any information or
other material as investment, financial, tax, or other advice. A
participant may have taken or recommended any investment position
discussed, but may close such position or alter its recommendation at
any time without notice. Nothing contained in this article constitutes a
solicitation, recommendation, endorsement, or offer to buy or sell any
securities or other financial instruments in any jurisdiction. Please
consult your own investment or financial advisor for advice related to
all investment decisions.
Footnotes / Sources
1. Federal Reserve FOMC, "Federal Reserve issues FOMC statement,"
June 17, 2026.
2. FRED, FOMC Summary of Economic Projections for the Fed Funds Rate
— 2026 median 3.85%.
3. FRED, CBOE NASDAQ 100 Volatility Index (VXNCLS), observation for
July 2, 2026 — 27.98.
4. Business Insider, VIX Index Live Quote, observation for July 7, 2026
— 15.90.
5. TappAlpha, TDAX Fund Page, retrieved July 2026.
6. TappAlpha, TDAQ Fund Page, retrieved July 2026.
7. Leverage Shares, "Leveraged ETFs Explained: How They Work, Risks,
and Benefits."
8. CMC Markets, "Leveraged ETFs Explained: Risks, Returns and How They
Work."
9. AI BrainTech, "Analysis of the Compound Effect in Leveraged ETFs."
10. Avellaneda, M. et al., "Path-dependence of Leveraged ETF
Returns," SIAM Journal on Financial Mathematics.



