
The Five-Stock Illusion
Why the 24.7% headline collapses to 16.8% without two names. Cap-weight breadth, sector-level earnings decay, and the concentration risk the composite is quietly hiding.

Today’s Lead-Lag Report post is sponsored by Figure

Unlock Cash Without Selling Your Crypto.
With Figure’s Crypto-Backed Loan, you can borrow against your BTC, ETH, or SOL without selling a single coin — keeping your portfolio intact and your upside open.
Figure offers one of the market’s lowest fixed rates for crypto-backed loans at 8.91% (9.999% APR), letting you turn dormant digital assets into working capital. Every loan features a 50% fixed LTV, 12-month term, and zero prepayment penalties. Unlike most lenders, Figure uses decentralized MPC custody: your collateral stays in a segregated, on-chain verifiable MPC wallet, meaning you retain control and transparency. No pooled custody. No hidden rehypothecation risk.
Key benefits: 8.91% interest / 9.999% APR at 50% LTV. Bitcoin, Ethereum, or Solana collateral. 12-month term with no prepayment or deferral fees. Decentralized MPC custody, transparent and segregated. Liquidation protection to help safeguard your position during sudden market drops.
Apply now and get started with Figure’s Crypto-Backed Loan.
*The interest rate on Figure’s Crypto-Backed Loan is 8.91% (9.999% APR) at 50% LTV or 11.50% (12.62% APR) up to 75%. The advertised Annual Percentage Rate (APR) is based on a $5,000 loan amount and contemplates the payment of 1% origination fee, which would yield a monthly payment of $42.47. Rates will be higher for applications secured by assets with a higher LTV ratio. The Figure Crypto-Backed Loan has a 12 month interest-only repayment term and allows for a maximum initial LTV ratio of 75%. Interest rates change frequently so your exact interest rate will depend on the date you apply and may depend on many factors such as LTV ratio.
Figure Lending LLC dba Figure. 650 S. Tryon Street, 8th Floor, Charlotte, NC 28202. (888) 819-6388. NMLS ID 1717824. For licensing information go to www.nmlsconsumeraccess.org. Equal Opportunity Lender.
Digital currency is not legal tender, is not backed by the government, and BIA accounts are not subject to FDIC or SIPC protections. Crypto loans are offered to U.S. borrowers by Figure Lending LLC. This product is not available to U.S. residents of DC, ID, IL, KY, MD, MS, SD, TX, VT, or VA. Crypto loans are offered through Figure Markets Credit LLC to residents of the state of New York and to international customers except in restricted jurisdictions.
Figure Markets Credit LLC. 650 S. Tryon Street, 8th Floor, Charlotte, NC 28202. (888) 926-6259. NMLS ID 2559612. For licensing information, go to www.nmlsconsumeraccess.org.
Figure Payments Corporation offers self-directed investors and traders cryptocurrency services. It is neither licensed with the SEC or the CFTC nor is it a Member of NFA. Figure Payments Corporation’s NMLS ID number is 2033432, and is located at 100 West Liberty Street, Suite 600, Reno, NV., 89501. You can verify Figure Payments licensing status at the NMLS Consumer Access website. Click here for Figure Crypto’s state license and regulatory disclosures.
DISCLAIMER – PLEASE READ: This is sponsored advertising content for which Lead-Lag Publishing, LLC has been paid a fee. The information provided in the link is solely the creation of Figure. Lead-Lag Publishing, LLC does not guarantee the accuracy or completeness of the information provided in the link or make any representation as to its quality. All statements and expressions provided in the link are the sole opinion of Figure, and Lead-Lag Publishing, LLC expressly disclaims any responsibility for action taken in connection with the information provided in the link.
The Five-Stock Illusion
Earnings Breadth Says the Recession Never Left
Macro Observations is a weekly deep-dive into the exposures the consensus is quietly mispricing. Each installment takes one narrative the market treats as settled and interrogates the structural evidence that says it may not be.
Key Highlights
- S&P 500 blended earnings growth for the second quarter of 2026 is tracking at 24.7%, the second straight quarter above 20%. Strip out just two companies, Micron Technology and NVIDIA, and that figure collapses to 16.8%. Two names account for roughly a third of the entire index earnings growth rate.
- Four of the five top contributors to index earnings growth this quarter are Micron, Chevron, Exxon Mobil, and Broadcom. NVIDIA is the only Magnificent Seven member in the top five. The headline is being carried by a narrow slice of the tape.
- The good news for the bulls is real: the other 493 companies are blending to 22.8% growth, the best for that group since the fourth quarter of 2021, and negative guidance is running well below cycle averages. That is the steelman, and it deserves a hearing.
- The problem is quality, not level. Cap-weight has beaten equal-weight by roughly 23% since 2020, Health Care earnings are contracting 18.2% year over year, and the forward multiple sits at 20.3 times, above both the five and ten-year averages. This is what late-cycle index quality deterioration looks like when the average print still reads clean.
- The signal to watch is breadth confirmation. If revisions turn positive across at least six of eleven sectors for three consecutive months, the concentration worry is wrong and the broadening is genuine. Until then, the index earnings number is a composite that hides more than it reveals.
There is a difference between an index that is earning its keep and an index that has a few names doing the work while everyone congratulates the whole roster. The headline number does not tell you which one you own. You have to take it apart.
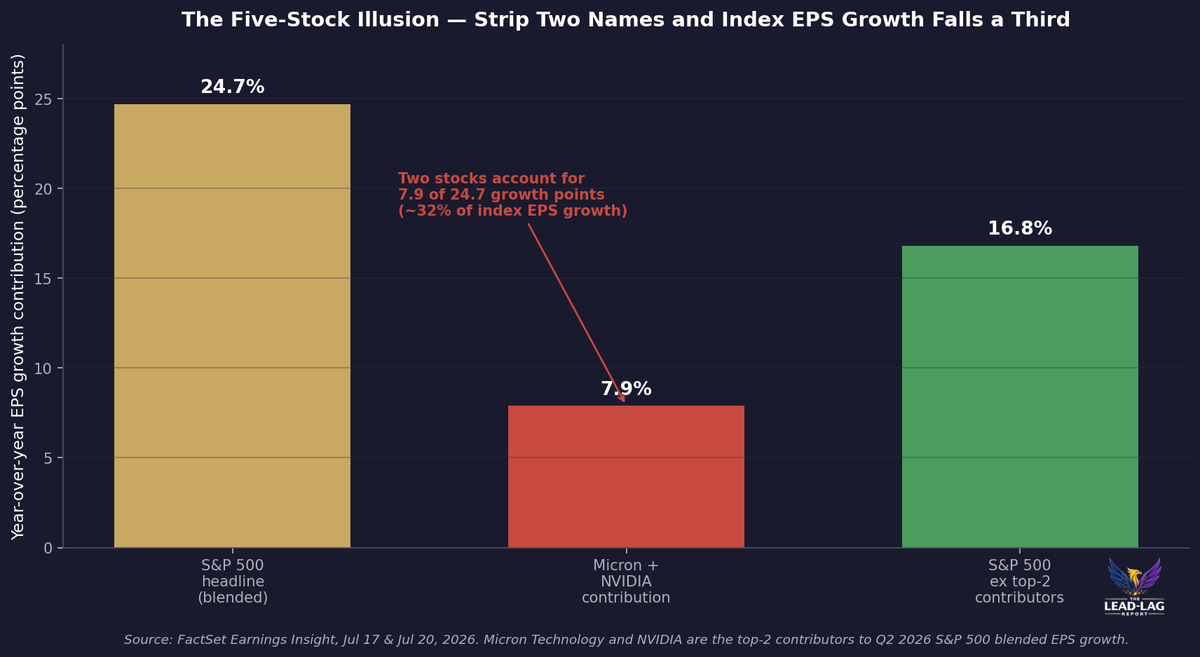
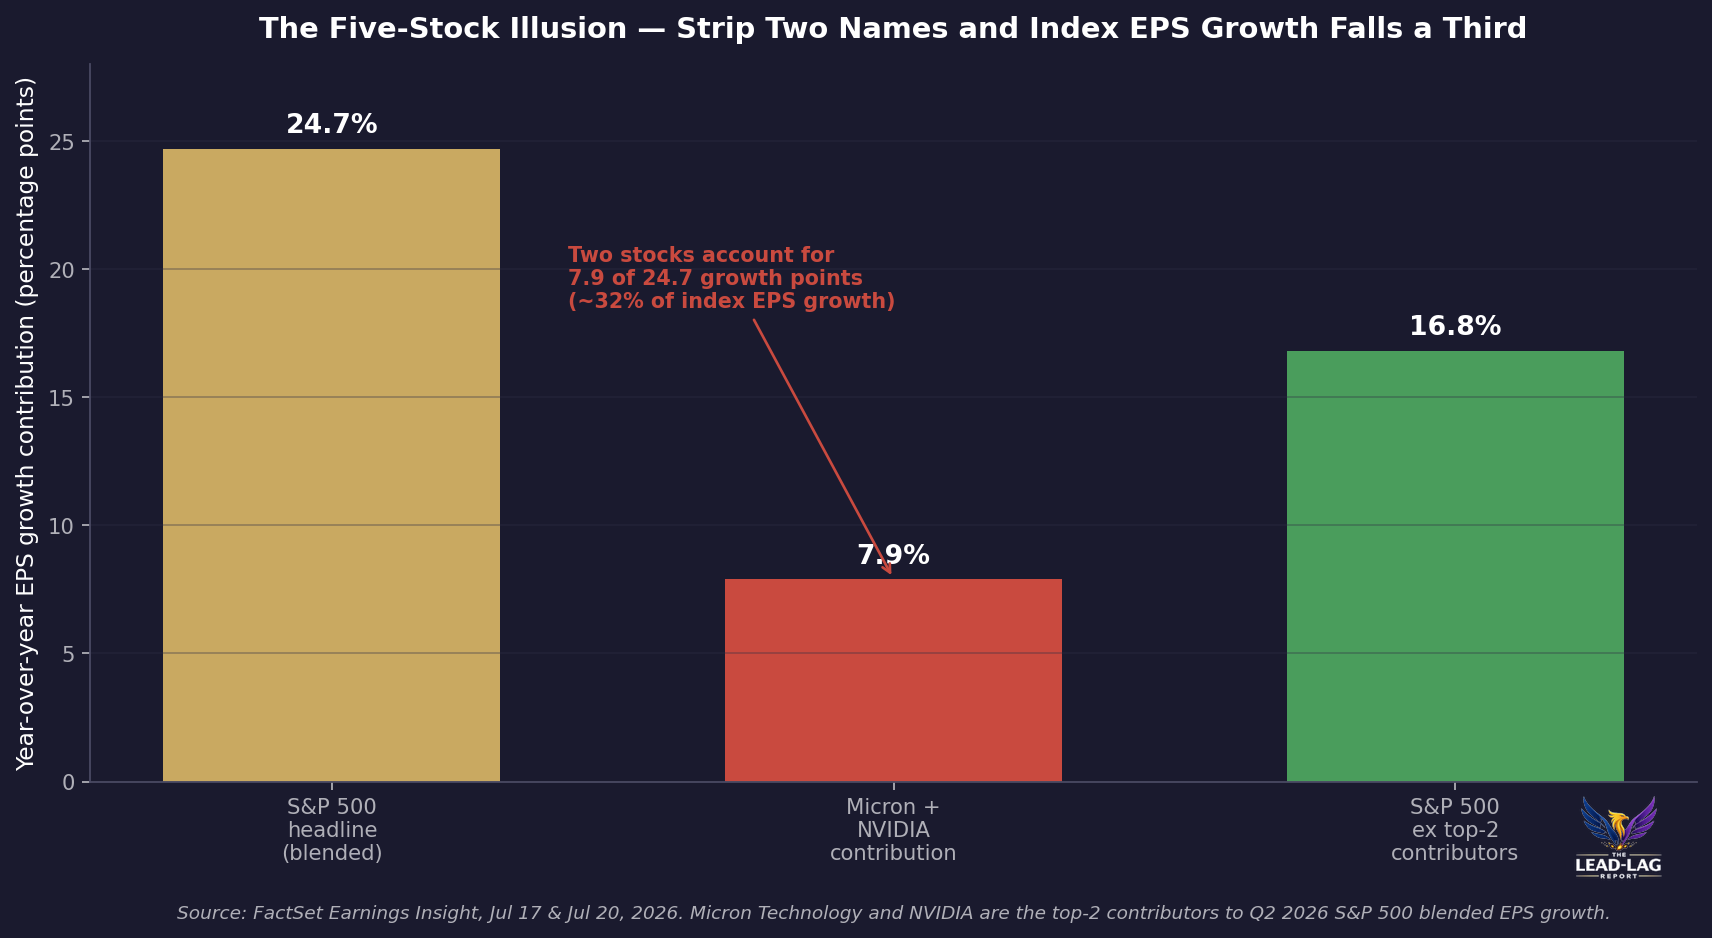
Take the S&P 500 apart right now and something uncomfortable falls out. For the second quarter of 2026, the blended year-over-year earnings growth rate for the index is 24.7%, the second consecutive quarter above 20%.[1] That is a genuinely strong print. It is also, in large part, an illusion of breadth. Remove two companies, Micron Technology and NVIDIA, and the same figure falls to 16.8%.[2] Two stocks out of five hundred are supplying nearly eight of the twenty-five growth points the index is reporting.
The consensus reads 24.7% and concludes earnings growth is robust. I read the same release and see an index whose reported profit growth is increasingly a function of a handful of semiconductor and energy names, riding a forward multiple that leaves no cushion, at exactly the point in the cycle when quality usually erodes before the level does.
What the Headline Conceals
Start with the arithmetic, because the arithmetic is not in dispute. FactSet's July 17 Earnings Insight puts blended Q2 2026 earnings growth at 24.7%, up from the 23.2% estimate at the June 30 quarter close.[1] The five largest contributors to that growth are Micron Technology, NVIDIA, Chevron, Exxon Mobil, and Broadcom. Four of those five are not Magnificent Seven members. NVIDIA is the only one that is.[3]
Micron and NVIDIA together are the top two contributors. FactSet is explicit about the consequence: exclude those two names and the index growth rate drops from 24.7% to 16.8%.[2] That is a 7.9 percentage-point wedge from a single pair of tickers. Put differently, about a third of the reported earnings growth of the largest equity index in the world is coming from two companies whose results are tied to the same artificial-intelligence capital-expenditure cycle. When you hear that S&P 500 earnings are strong, this is the composition underneath the sentence.
This is not a moral failing of the index. It is a mechanical feature of a capitalization-weighted, contribution-weighted profit aggregate. A few very large, very fast-growing companies can pull the whole number up. That is fine when the underlying is durable. It becomes a problem when the market treats the composite as evidence that the entire corporate sector is accelerating, and prices the whole index off the strength of the few.
The point of this column is not that the number is fake. It is that the number is a blend, and the blend is doing work the market is not accounting for. The quality of index earnings, the degree to which the growth is spread rather than borrowed from a corner of the tape, is deteriorating even as the level holds. That is the specific concern. Not that earnings are collapsing. That the index earnings number is becoming a less honest description of the median company inside it.
The Steelman, Stated Fairly
Let me give the bull case its strongest form, because it is a good one and this thesis has to survive it. If the story were only about two chip names, the other 493 companies in the index would be limp. They are not. FactSet has the remaining 493 blending to 22.8% earnings growth for the quarter, which, if it holds, would be the strongest for that group since the fourth quarter of 2021.[4] The Magnificent Seven are growing 31.1%, but the gap to the rest of the index is the narrowest it has been in years, and FactSet projects the other 493 to actually out-grow the Magnificent Seven by the fourth quarter.[4]
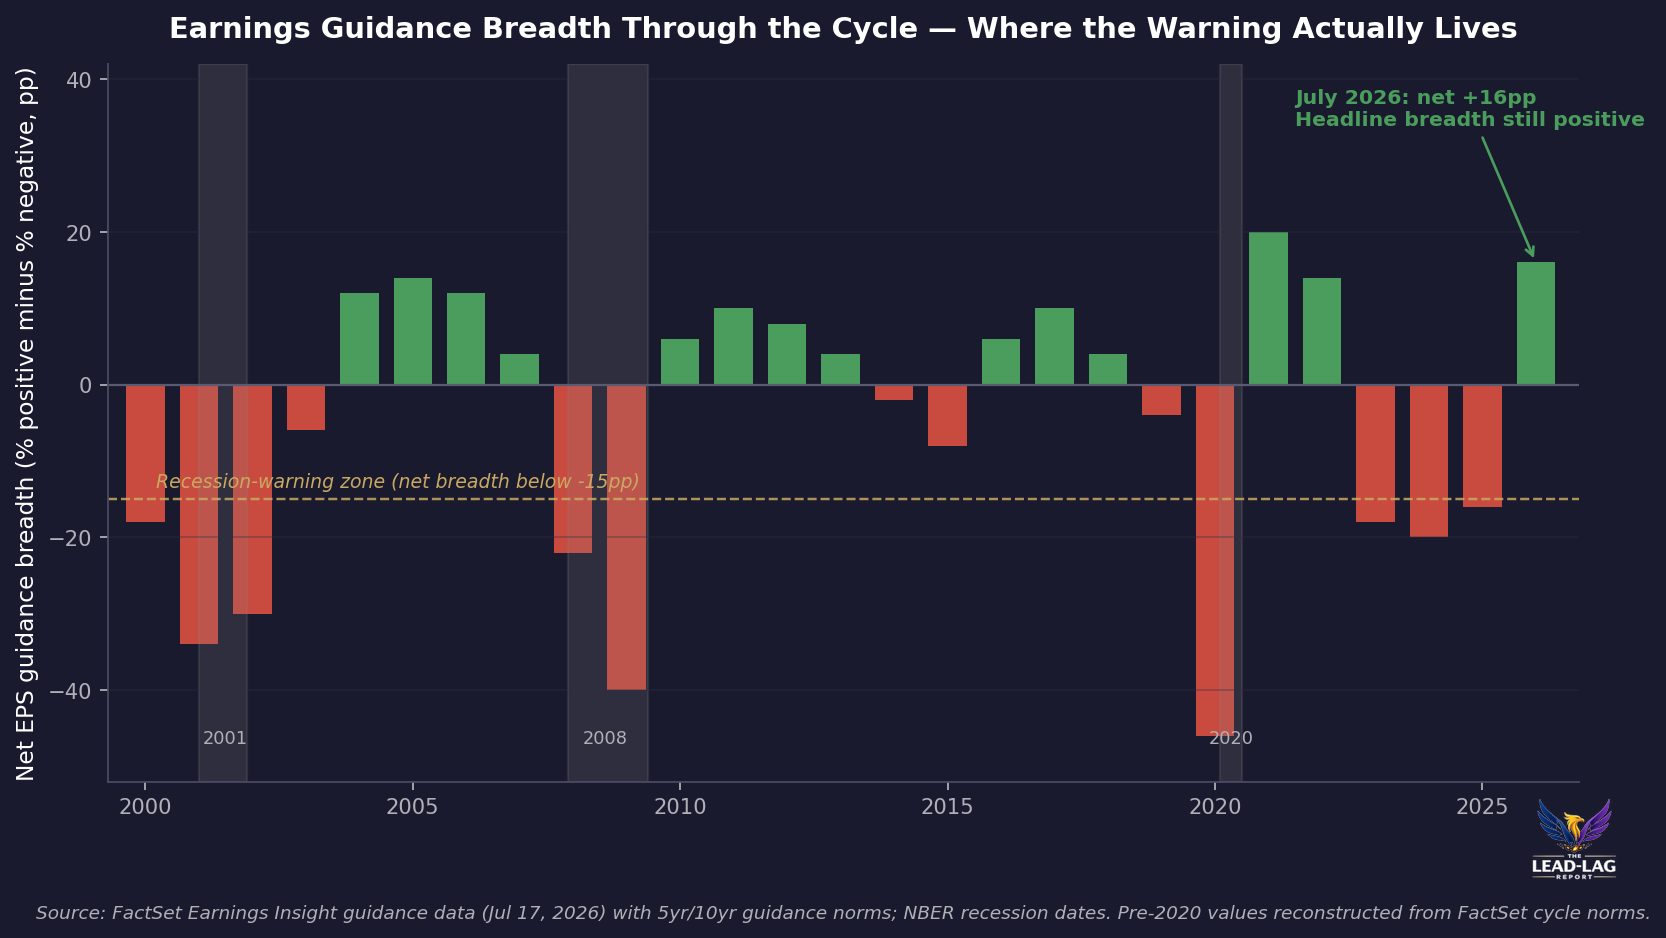
Guidance tells the same reassuring story. Of the nine companies that have issued third-quarter EPS guidance, 44% is negative, below the five-year average of 58% and the ten-year average of 60%.[5] For the full year, 42% of the 265 companies that have guided are guiding down, again below cycle norms. On the standard breadth screens, this does not look like a market on the edge of an earnings recession. It looks like a healthy, broadening tape.
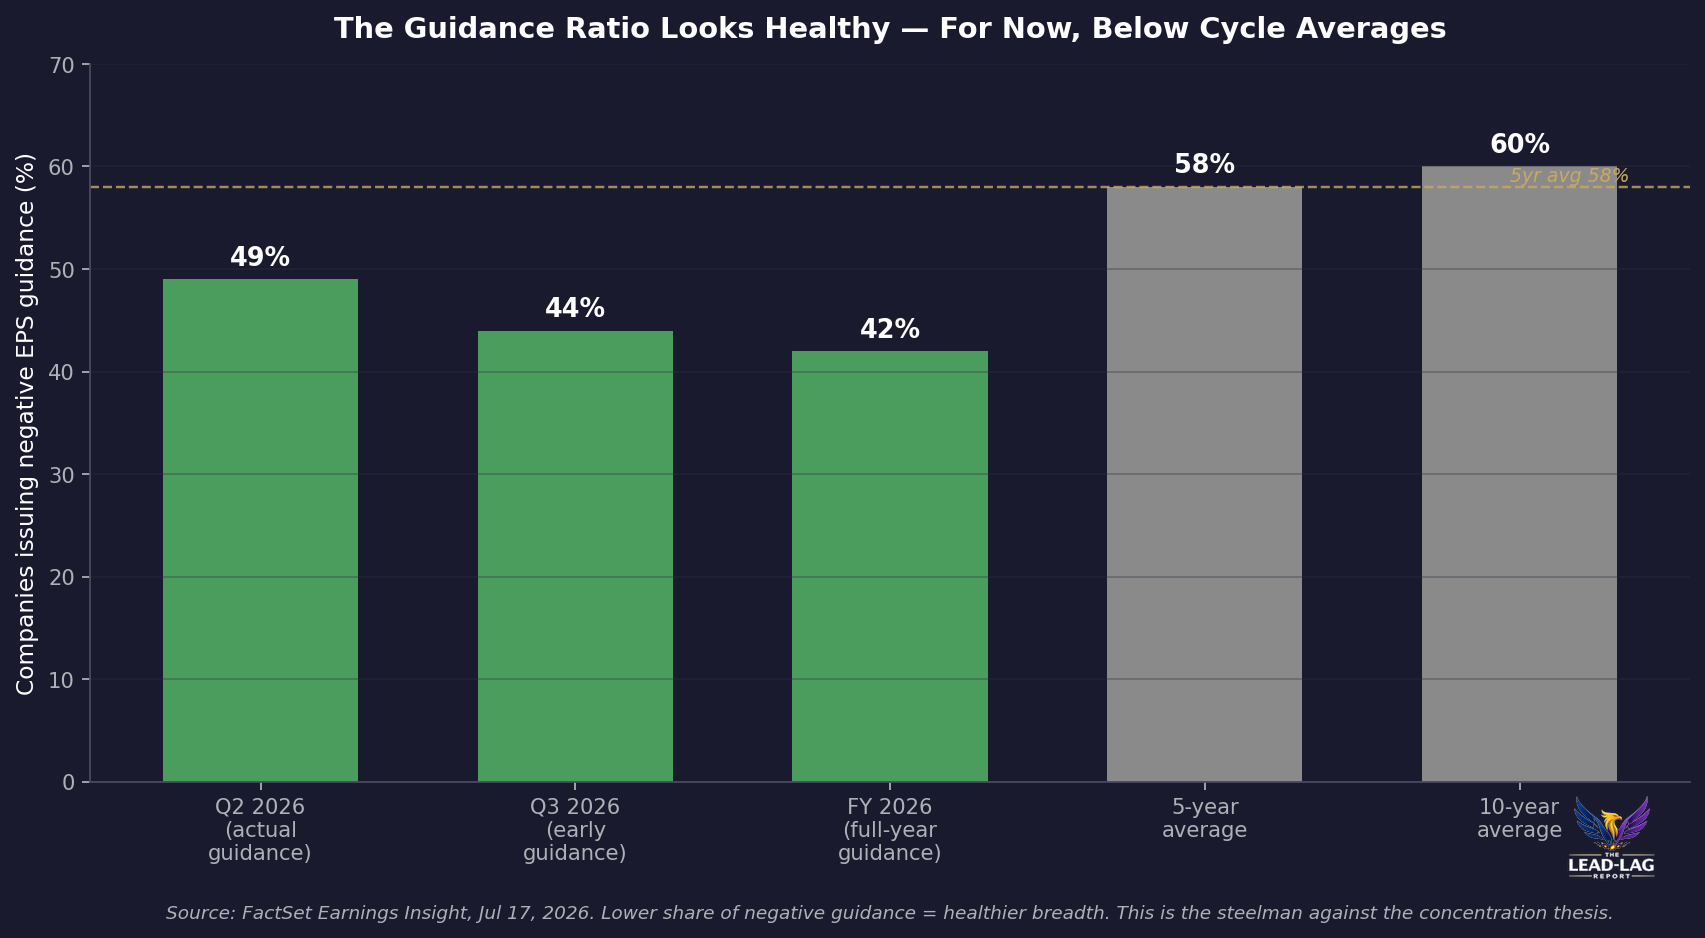
I want to be honest about what this chart shows. The guidance ratio is not at recession-warning levels today. It is below average, which is the opposite of a warning. If you built your entire case on the claim that negative guidance is spiking, the data would embarrass you. It is not spiking. Anyone selling you a clean recession signal from current guidance breadth is overselling.
So the steelman is: earnings are broadening, guidance is benign, and the concentration worry is a stale 2023 story that the data has since overtaken. That is a serious argument. My disagreement is not that the breadth screens are wrong. It is that breadth screens are coincident-to-lagging, and they were also benign in the two quarters before the last two times the index quality actually broke.
Where the Warning Actually Lives
The warning is not in the guidance ratio. It is in the composition and in the price. Consider the sector detail. Ten of eleven sectors are posting year-over-year earnings growth for the quarter, which sounds like breadth.[6] But the distribution is extreme. Energy is up 124.8% off a low base, Information Technology up 63.4%, Materials up 34.7%. At the other end, Health Care is contracting 18.2%, the only sector in outright decline and the largest single detractor from index growth since June 30.[6] A quarter where the top sector grows a hundred and twenty-five percent and a defensive anchor shrinks nearly twenty is not a broad, even expansion. It is a small number of pro-cyclical winners carrying a widening group of laggards.
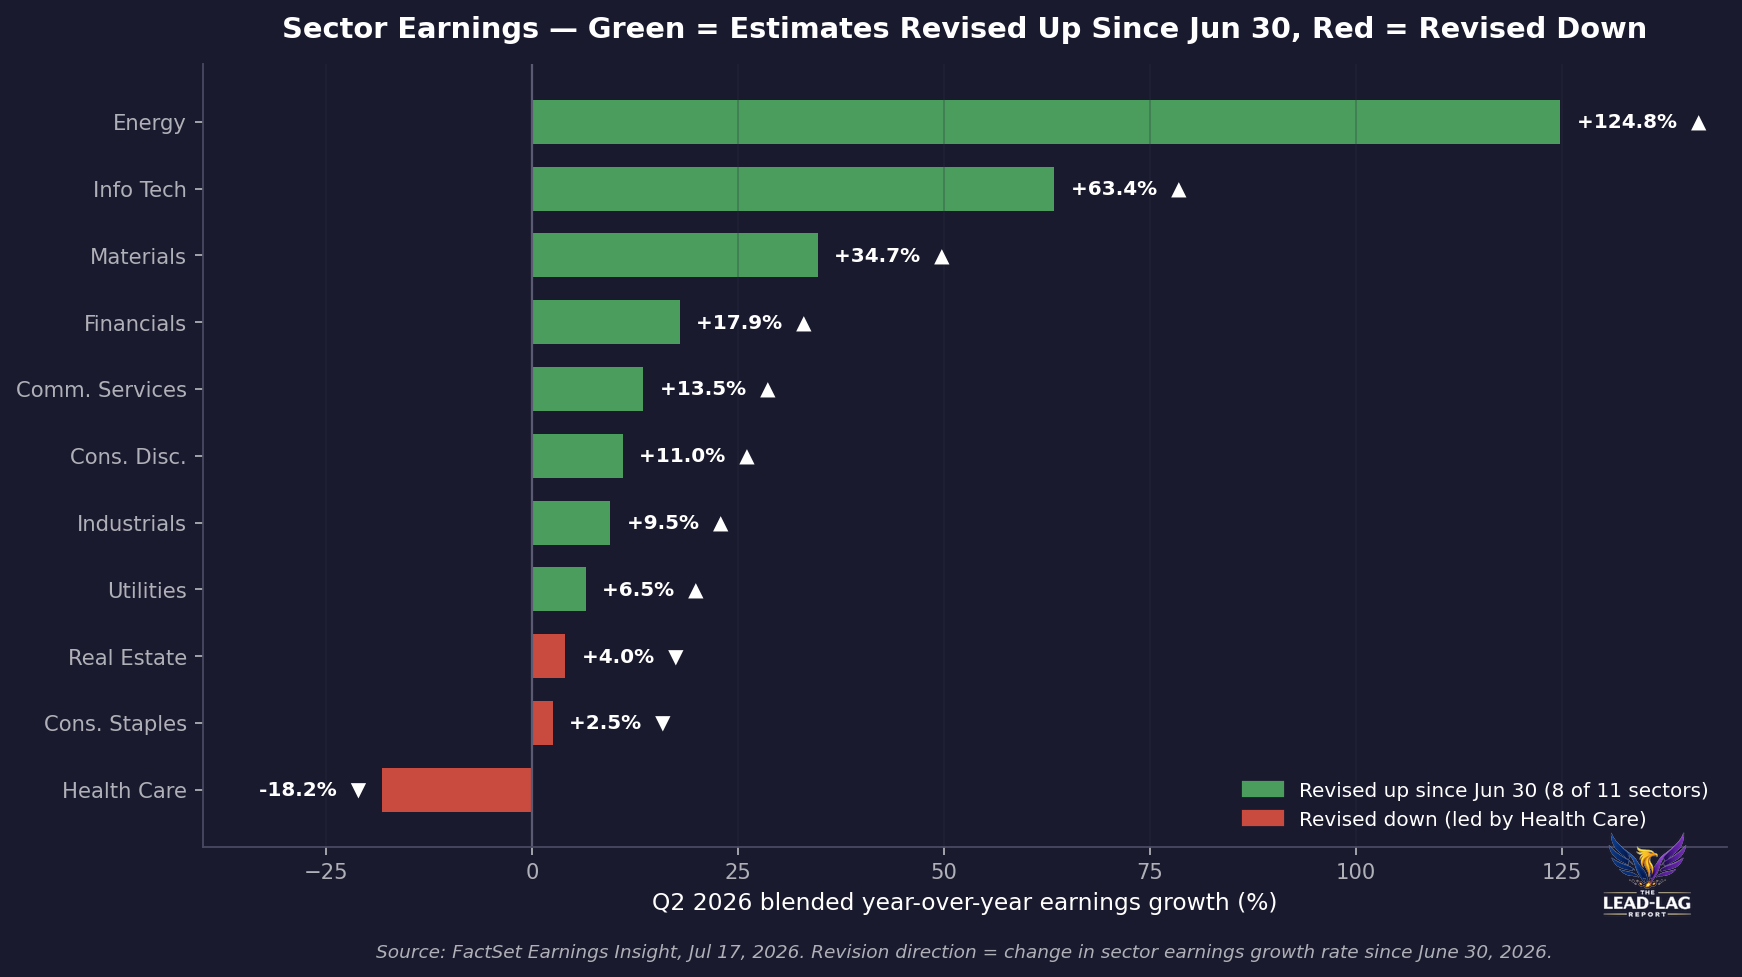
Since the June 30 quarter close, eight of eleven sectors have seen estimates revised up and three revised down, with Financials leading the improvement on strong bank results and Health Care leading the deterioration.[6] That is a positive net revision tally, and I am not going to pretend otherwise. But revisions concentrated in Financials during a rate-driven net-interest-margin quarter, offset by a defensive sector rolling over, is the exact fingerprint of a late-cycle regime, not an early-cycle one. In 2007, breadth deterioration was masked by financials right up until it was not.
Then there is price. The forward twelve-month price-to-earnings ratio for the index is 20.3, above the five-year average of 19.9 and the ten-year average of 19.0.[7] The trailing multiple is 27.6. The net profit margin is 14.3%, near a record.[7] You are paying an above-average multiple on a peak margin, on an earnings number a third of which comes from two stocks. That combination does not require an earnings recession to hurt you. It only requires the concentration to unwind faster than the broadening confirms.
Cap-Weight Keeps Winning, Which Is the Tell
If the market were genuinely broadening in the way the 493-company growth number implies, you would expect the equal-weight index to be closing the gap on the cap-weight index. It is not. The ratio of SPY, the cap-weighted S&P 500, to RSP, the equal-weighted version, has risen roughly 23% since the start of 2020, and it made new highs earlier this year.[8] Cap-weight is still beating equal-weight. The dollars are still flowing to the top of the index, not across it.
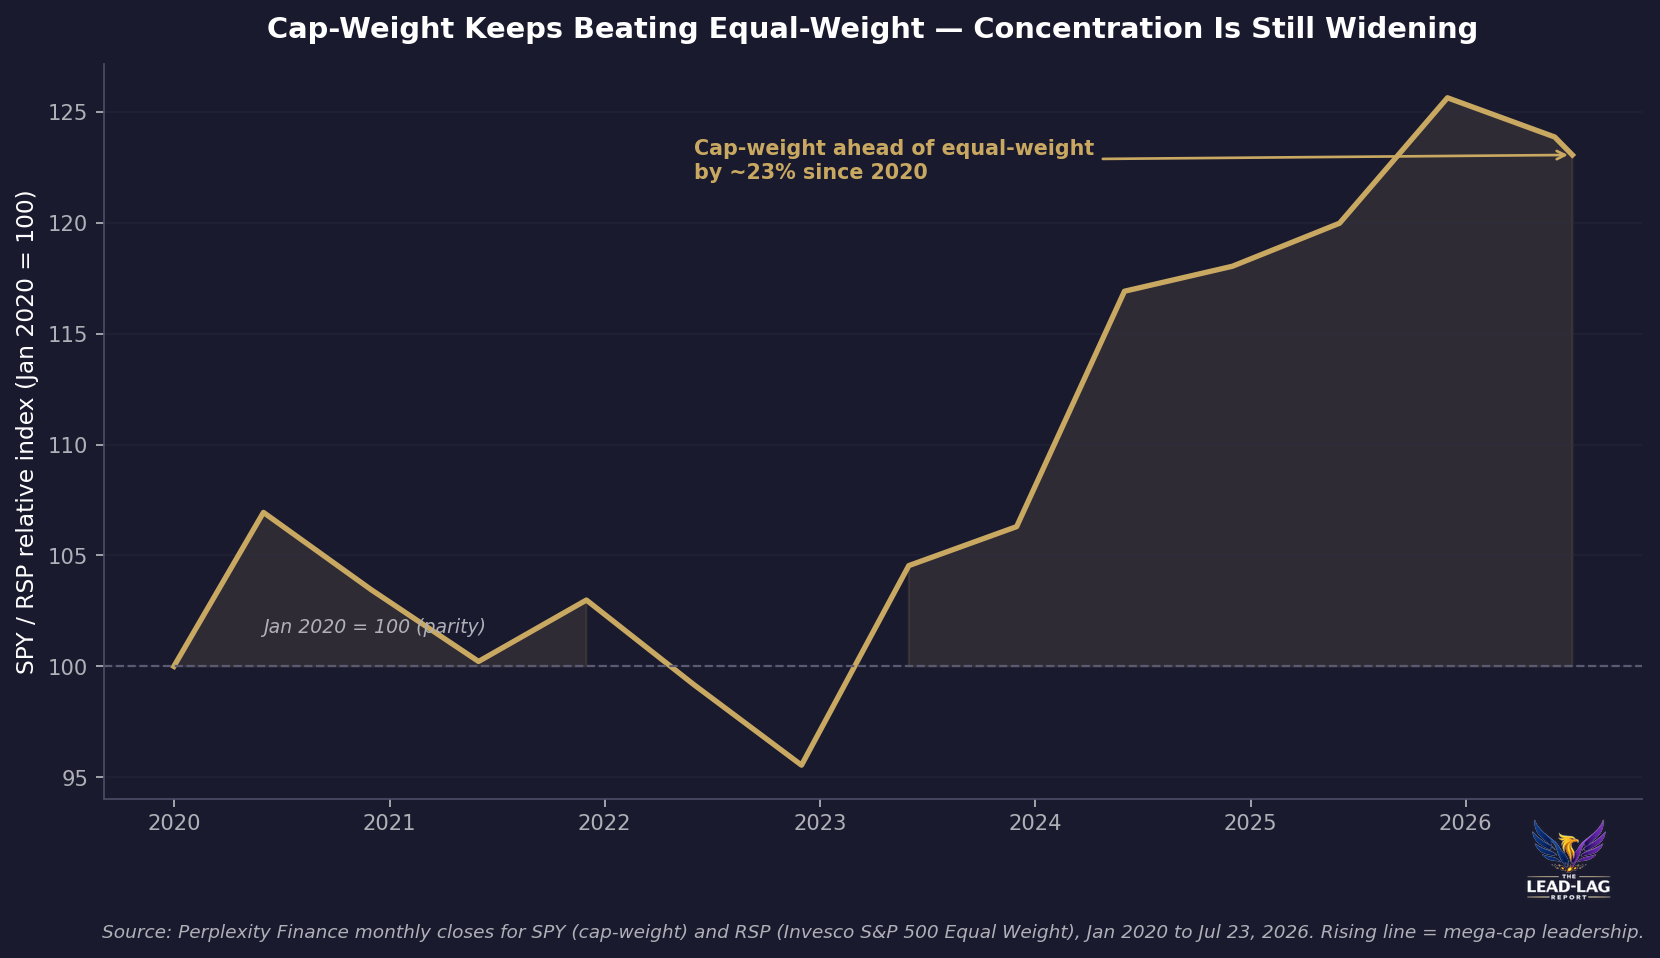
This matters because it is the market's own real-money verdict on breadth, and it disagrees with the guidance screens. Earnings breadth can look fine on a company-count basis while capital concentration keeps widening, because the count treats a five-billion-dollar company and a three-trillion-dollar company as one vote each. The index does not. Passive flows do not. The cap-weight-versus-equal-weight line is the flow-weighted truth, and it says concentration is still building even as the earnings-count breadth improves.
That is the divergence at the center of this piece. On a headcount basis, breadth is recovering. On a capital and contribution basis, concentration is at or near cycle extremes. Both can be true at once. The market has been pricing the first and ignoring the second.
The Parallels That Should Bother You
The uncomfortable historical rhyme here is not one regime but two. The first is 1998 to 2000. In the late innings of the dot-com advance, index earnings growth stayed respectable while an ever-smaller cohort of technology and telecom names supplied a disproportionate share of it. The breadth of the underlying market had already begun to narrow in 1999, well before the index itself peaked in March 2000. Investors who looked only at the S&P 500 earnings line saw strength. Investors who looked at how few names were producing it saw the setup.
The second is 2007. Going into the financial crisis, aggregate S&P 500 earnings were still near records, propped up by a Financials sector whose reported profits were, in hindsight, borrowing from a future that never arrived. The breadth deterioration underneath was masked because the sector doing the masking was the one that would crack first. When Financials rolled, the index earnings base that had looked so solid gave back years of growth in a handful of quarters.
I am not forecasting a 2008. The banking system is better capitalized and the specific fragility is different. But the structural pattern, a narrow set of sectors or names carrying a headline that the market treats as broad-based, is the same pattern that preceded both prior index-quality breaks. In each case the coincident breadth screens looked acceptable until very close to the turn. The lead signal was concentration and composition, not the guidance ratio.
The lesson from both episodes is about the durability of the earnings base, not its current level. An index earning $X where a third of the growth comes from two cyclical names is a more fragile $X than one where the growth is spread across the roster. The market pays the same multiple for both. It should not.
Positioning for a Composite That Can Lie
None of this is a call to abandon equities, and it is emphatically not a view on any individual company. Micron, NVIDIA, and the rest of the concentration cohort are extraordinary businesses. The observation is about the index-level earnings narrative, not about the merits of the names carrying it.
The asymmetry is what makes it worth writing. If the broadening is real and the 493 keep converging upward, an investor positioned for even exposure across the market rather than for the top of the cap structure gives up very little, because the whole point of the bull case is that the rest of the index is finally participating. If the concentration is instead the late-cycle tell it has been in prior regimes, then exposure weighted toward the mega-cap contribution engine carries a quality risk that the headline number is actively hiding. Balanced against that, an equal-weight or breadth-confirmed exposure is the lower-regret position, because it wins modestly if the bulls are right and loses far less if the composition breaks.
Concretely, that argues for treating the index earnings line as a composite to be decomposed rather than a single fact to be trusted, for watching the equal-weight-to-cap-weight relationship as the real breadth gauge, and for demanding that the broadening show up in the flow-weighted data and not just the company count before paying an above-average multiple for it. The regime signal is late-cycle. The prudent posture in a late-cycle regime is to reduce reliance on the most concentrated part of the return, not to lean into it because the composite reads clean.
What Would Prove Me Wrong
I owe you a falsification condition, because a thesis that cannot be killed is not worth holding. Here it is. If earnings-estimate revisions turn net positive across at least six of the eleven S&P 500 sectors for three consecutive months, the broadening is genuine and this concentration worry is stale. That is a clean, observable, monthly test.
The current single-month tally, eight of eleven sectors revised up since June 30, is already past that six-sector threshold for one reading.[6] If it holds for three straight months, especially with the up-revisions spreading beyond Financials and the two chip names, I will write the piece that says the recession signal in the earnings composition dissolved and the broadening was real. I would rather be proven wrong that way than right the other way. But one month of good breadth after a decade of narrowing is not three months, and the cap-weight line has not yet agreed.
Until the breadth confirms across sectors and shows up in the flow-weighted data, the honest description of the second-quarter earnings season is this: a strong headline, an above-average price, and a growth rate that a third of which rides on two stocks. The index quality is deteriorating underneath a number that still reads robust. That is precisely the configuration that has preceded prior late-cycle turns, and precisely the one the guidance screens are structurally too slow to flag.
Read the composition, not just the composite. The recession the breadth is whispering about never fully left the underlying tape. It has only been outvoted by five stocks.
Few understand this.
Notes
[1] FactSet Earnings Insight, John Butters, July 17, 2026. https://www.factset.com/earningsinsight. Blended (year-over-year) S&P 500 earnings growth rate for Q2 2026: 24.7%. Estimated growth rate on June 30, 2026: 23.2%. Second consecutive quarter of growth above 20%.
[2] FactSet Earnings Insight, July 17, 2026, and 'Are Magnificent 7 Companies Still Top Contributors to S&P 500 Earnings Growth for Q2,' John Butters, July 20, 2026. https://insight.factset.com/are-magnificent-7-companies-still-top-contributors-to-sp-500-earnings-growth-for-q2. Excluding Micron Technology and NVIDIA, the blended Q2 2026 growth rate falls to 16.8% from 24.7% — a 7.9 percentage-point wedge, roughly one-third of the index growth rate.
[3] FactSet, July 20, 2026 (same source as [2]). Five largest contributors to Q2 2026 S&P 500 earnings growth: Micron Technology, NVIDIA, Chevron, Exxon Mobil, Broadcom. NVIDIA is the only Magnificent Seven company among the top five contributors.
[4] FactSet, July 20, 2026 (same source as [2]). Magnificent Seven estimated Q2 2026 earnings growth: 31.1%. Remaining 493 companies blended growth: 22.8%, which would be the highest for that group since Q4 2021 (32.3%). For Q4 2026, the other 493 are projected to grow 25.3% versus 22.8% for the Magnificent Seven.
[5] FactSet Earnings Insight, July 17, 2026 (same source as [1]). Q3 2026: 4 of 9 guiding companies (44%) issued negative EPS guidance, below the five-year average of 58% and ten-year average of 60%. Full-year FY2026/FY2027: 110 of 265 guiding companies (42%) guiding down.
[6] FactSet Earnings Insight, July 17, 2026 (same source as [1]). Ten of eleven sectors reporting year-over-year earnings growth. Energy +124.8%, Information Technology +63.4%, Materials +34.7%, Financials +17.9% (up from 5.5% at June 30). Health Care -18.2% (from -8.9% at June 30), the only sector in decline and the largest detractor. Since June 30: 8 sectors revised up (led by Financials), 3 revised down (led by Health Care).
[7] FactSet Earnings Insight, July 17, 2026 (same source as [1]). Forward 12-month P/E: 20.3 (five-year average 19.9; ten-year average 19.0). Trailing 12-month P/E: 27.6. Blended Q2 2026 net profit margin: 14.3% (year-ago 12.9%; five-year average 12.3%).
[8] Perplexity Finance, monthly closing prices for SPY (SPDR S&P 500 ETF Trust, cap-weight) and RSP (Invesco S&P 500 Equal Weight ETF), January 2020 through July 23, 2026. The SPY/RSP relative index rose approximately 23% over the period, indexed to 100 at January 2020, indicating persistent mega-cap leadership over the equal-weighted index.
[9] Historical context: S&P Dow Jones Indices and Bureau of Economic Analysis long-run earnings data. Late-1990s narrowing breadth ahead of the March 2000 S&P 500 peak, and the 2007 Financials-led earnings peak preceding the 2008-2009 earnings collapse, are referenced as structural analogs for concentration-masked breadth deterioration, not as magnitude forecasts. See FactSet historical Earnings Insight archive, https://insight.factset.com/topic/earnings.



