JPMorgan's $44 Billion Nasdaq Income Machine Pays 13%. Read The Fine Print
JEPQ's 13.32% 30-day SEC yield is option premium, not a coupon. What the income machine sells to pay you.


Today's Lead-Lag Report post is sponsored by Relative Sentiment
The Relative Sentiment Tactical Allocation ETF is a flexible, multi-asset fund that invests across stocks, bonds, commodities, precious metals, and currencies. Its approach is guided by a research-based factor called relative sentiment — which tracks how optimistic or cautious professional investors are compared to individual investors. Studies show professionals tend to have an edge over time, and this ETF seeks to capture that insight by increasing exposure to areas where institutions are more optimistic and reducing exposure where they're more cautious. Relative sentiment often complements trend-following strategies, helping create portfolios that may be more balanced and less prone to sharp swings.
The Fund's investment objectives, risks, charges and expenses must be considered carefully before investing. This and other important information is contained in the Prospectus and SAI, which may be obtained by following the links or by calling +1.215.882.9983. Please read the prospectus carefully before investing.
Investments involve risk. Principal loss is possible.
The Fund is distributed by PINE Distributors LLC.
ETFAC-4976143-11/25
DISCLAIMER – PLEASE READ: This is sponsored advertising content for which Lead-Lag Publishing, LLC has been paid a fee. The information provided in the link is solely the creation of Relative Sentiment. Lead-Lag Publishing, LLC does not guarantee the accuracy or completeness of the information provided in the link or make any representation as to its quality. All statements and expressions provided in the link are the sole opinion of Relative Sentiment. and Lead-Lag Publishing, LLC expressly disclaims any responsibility for action taken in connection with the information provided in the link.
Key Highlights
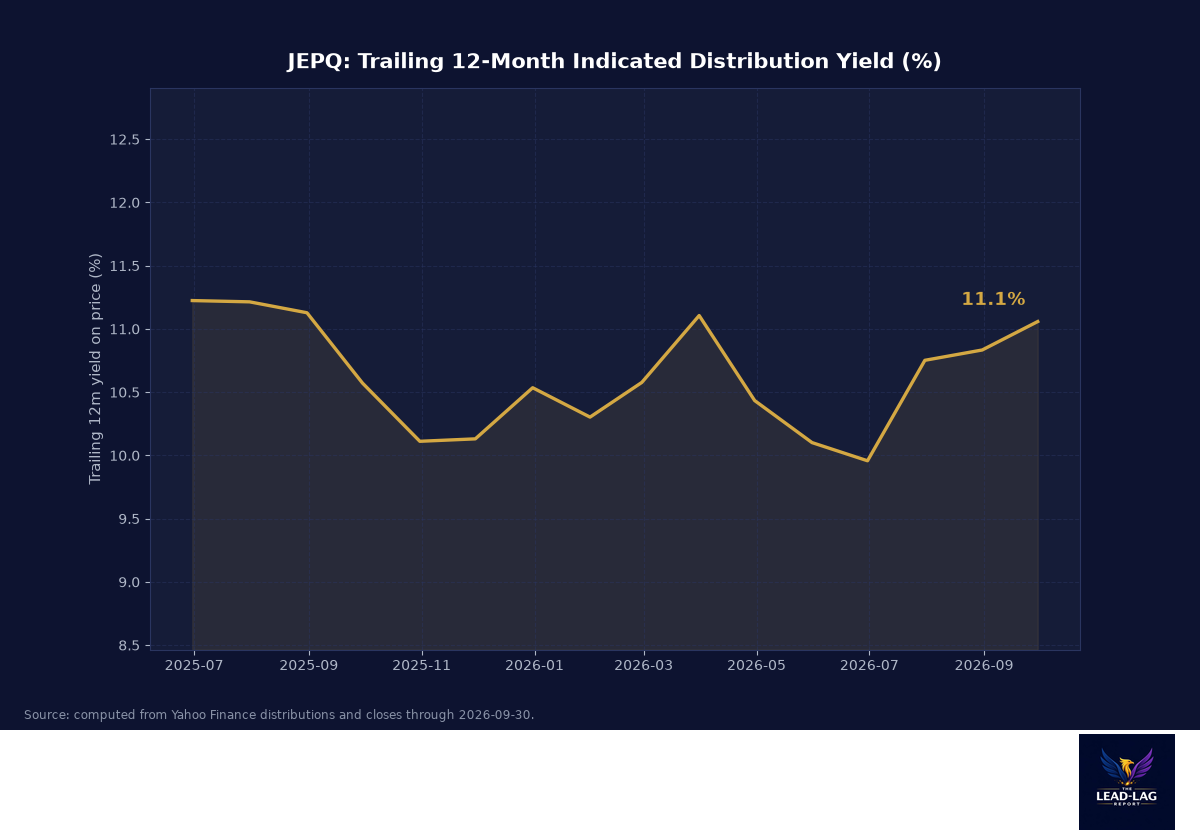
- Yield: 11.06% trailing 12-month indicated on price ($6.765 of distributions against a $61.13 close, computed from Yahoo Finance); 13.32% 30-day SEC yield as of 8/31/26 per JPMorgan Asset Management
- Cost: 0.35% expense ratio, gross and net, per JPMorgan
- Scale: roughly $43.9 billion in assets, one of the largest income ETFs in the world per StockAnalysis
- Risk: 15.2% annualized 1-year price volatility vs 13.0% for SPY, computed from daily closes
- Performance: +36.0% total return since September 2024, of which only +12.4% came from price; the rest was the monthly paycheck
Every week, we'll profile a high yield investment fund that typically offers an annualized distribution of 6-10% or more. With the S&P 500 yielding less than 2%, many investors find it difficult to achieve the portfolio income necessary to meet their needs and goals. This report is designed to help address those concerns.
The Income Machine Fed By A Tech Rally
The Federal Reserve raised the federal funds rate 25 basis points to a 3.75% to 4.00% range on September 16, 2026, a reminder that the income reset of this cycle is real and ongoing (source: Federal Reserve press releases). The S&P 500 closed Friday at 7,743.41 (source: FRED), and it yields about 1%. Advisors keep asking me the same question: how do you monetize a market this extended without selling the winners?
The largest mainstream answer is the JPMorgan Nasdaq Equity Premium Income ETF (JEPQ). It holds roughly $43.9 billion in assets per StockAnalysis, it pays monthly, and its 30-day SEC yield, the pure income component, printed at 13.32% as of August 31 per JPMorgan's own fund page. That number deserves scrutiny, because a 13% income yield on a Nasdaq product in a market where junk bond funds yield 6% should make any CFA ask what engine generates it.
The engine is option premium. And understanding what you are trading away is the entire investment case.
Fund Background
JEPQ launched on May 3, 2022 per JPMorgan, the Nasdaq-flavored sibling of the strategy JPMorgan built for JEPI. The structure matters: this is not an index fund with options bolted on. A portfolio management team actively selects a subset of Nasdaq-100 equities, then sells out-of-the-money call options on that basket through equity-linked notes (ELNs). The ELN overlay is negotiated paper, not exchange-listed options, which is how JPMorgan's desk shapes the strike and tenor of the calls it sells.
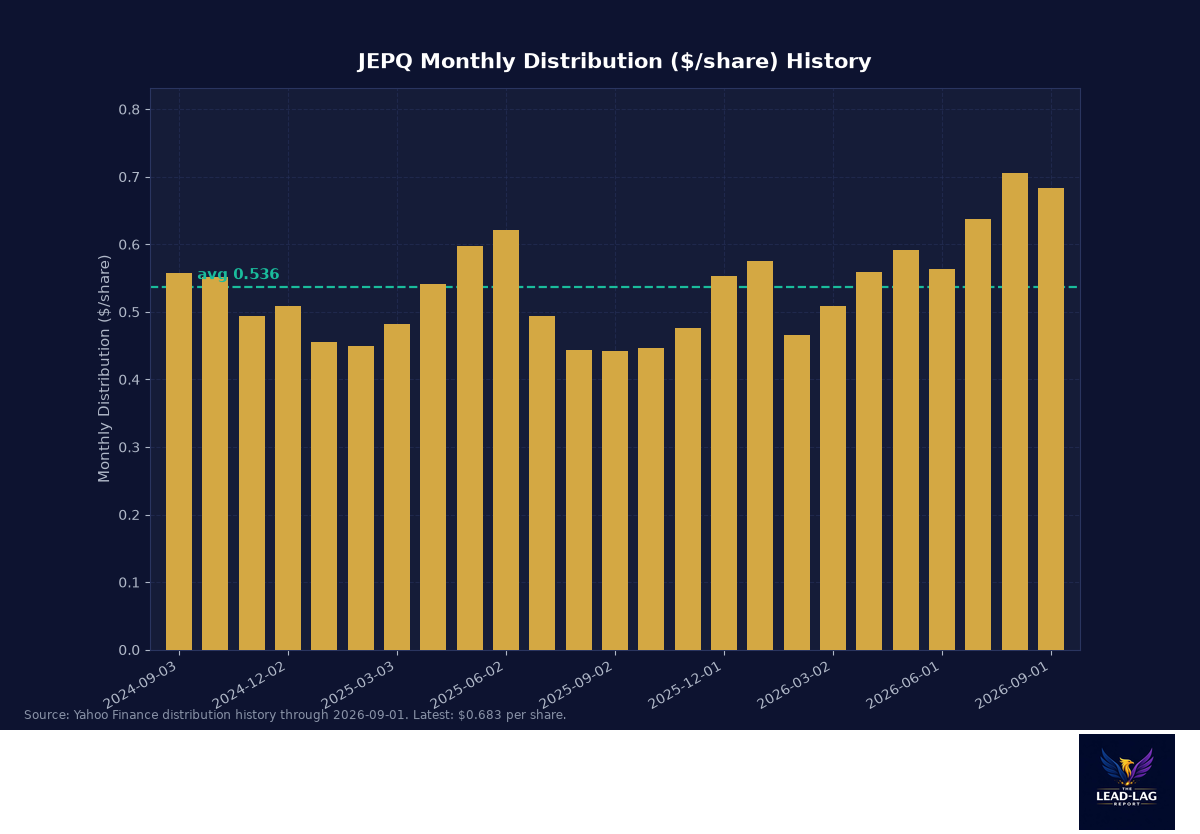
The fund charges 0.35%, gross and net, per JPMorgan. The ELN wrapper deserves one more sentence, because it is where the active management actually lives: rather than selling listed calls against the whole portfolio, the desk structures notes that can blend strikes and expirations, which historically produces a slightly better premium-to-protection trade than a mechanical program. Whether that edge is worth 35 basis points versus a do-it-yourself covered call book is a fair question, and the honest answer is that most advisors cannot replicate the negotiation, which is the product. The most recent monthly distribution was $0.68255 per share with a September 1 ex-date, per StockAnalysis. Sum the trailing twelve months and you get $6.765 per share against Friday's $61.13 close, an 11.06% indicated yield (computed from Yahoo Finance distribution history). JPMorgan separately reports a 12-month rolling dividend yield of 10.69% as of June 30, per its fund commentary.
Portfolio Composition
The portfolio is an actively managed equity sleeve drawn from the Nasdaq-100, the same index that carried this rally, with a call overlay sold against it. That has two composition consequences. First, you own concentrated mega-cap technology and growth exposure, the same names driving the index. Second, the distribution is not a coupon. It is option premium, which rises and falls with implied volatility and with how far out of the money the desk can sell.
This is the honest way to describe JEPQ: an equity fund with an income habit, not a bond fund with equity upside. There is no credit book, no duration, no NAV mechanic. Your principal rides Nasdaq stocks, full stop.
Historical Performance
Since September 2024, JEPQ delivered a computed total return of +36.0%, versus just +12.4% on price alone (sum of distributions and daily closes, Yahoo Finance). Read that again: roughly two-thirds of the return arrived as cash. That is the entire proposition. The cost is visible in the same math. An unhedged Nasdaq-100 position over the same window did meaningfully better on price, because every call JEPQ sold capped its participation in the strongest up-moves.
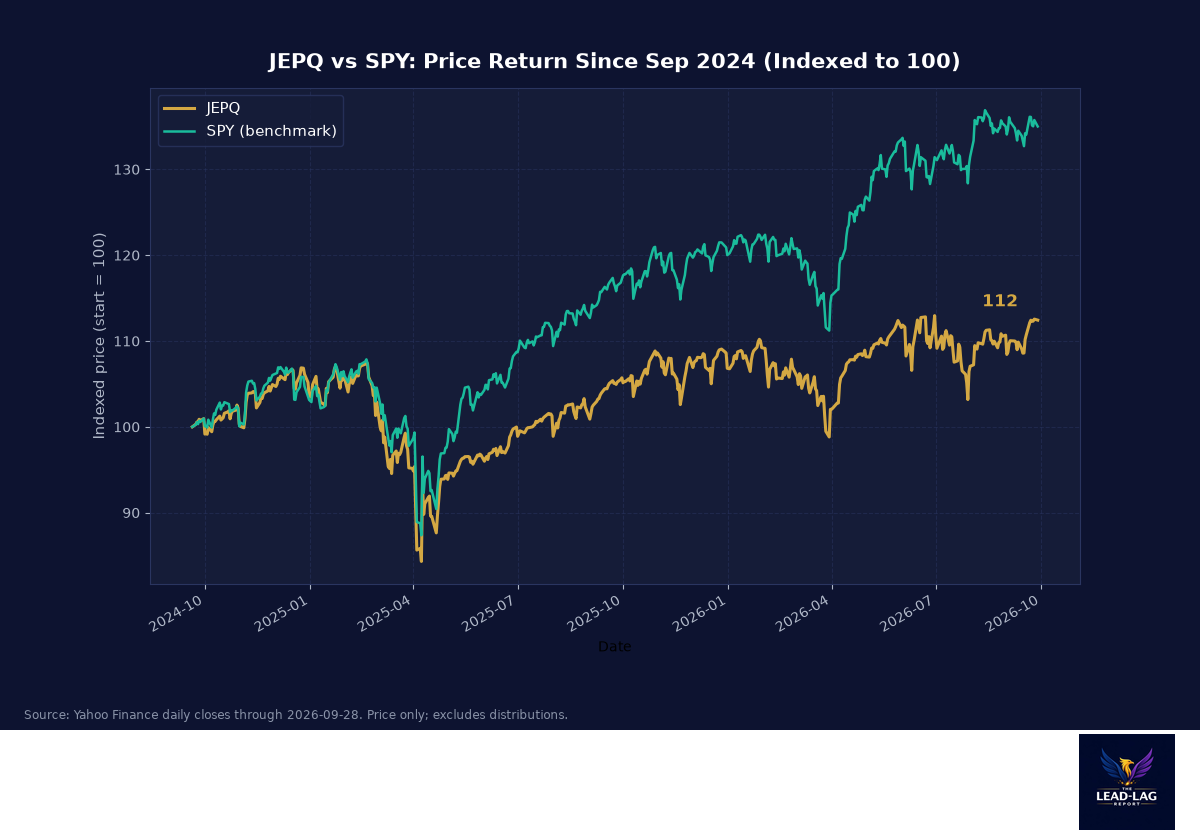
The chart above shows the price-only comparison against SPY since September 2024. JEPQ's line is smoother, its drawdowns shallower, and its slope lower. That trade, smoothness and income in exchange for upside, is the deal you are accepting.
Volatility Comparison
Computed from daily closes, JEPQ's 1-year annualized price volatility is 15.2% against 13.0% for SPY. The surprise for most readers is that JEPQ is not lower-volatility than the S&P 500. It is lower-volatility than the Nasdaq exposure it actually holds, because the call premium cushions single-name and index swings, but Nasdaq risk is still Nasdaq risk. In April-style drawdowns the cushion helps; it does not immunize.
Macro Environment
Here is my read. The Fed's September hike to 3.75% to 4.00% (source: Federal Reserve) keeps cash alternatives competitive and keeps the pressure on the 1%-yielding S&P. Meanwhile the equity tape is stretched: the S&P 500 at 7,743.41 per FRED, with technology leadership near cycle extremes. High implied volatility is exactly the environment where an option-selling strategy harvests its fattest premiums, and it is also the environment where capped upside hurts least, because extension rarely persists in a straight line.
The risk case is equally clear. If the Nasdaq rips another 20% in a straight line, JEPQ captures perhaps half of it after the call overlay, and the 11% distribution will not close that gap. If volatility collapses, premiums shrink and the monthly check does too. This strategy pays best when markets are choppy and richly priced, and worst when they are boring or vertically bullish.
Distribution Policy
JEPQ distributes monthly and the amount floats with premium income. The September payment was $0.68255 per share per StockAnalysis. The trailing twelve months summed to $6.765, an 11.06% indicated yield on Friday's close, while the 30-day SEC yield printed 13.32% as of August 31 per JPMorgan. JPMorgan's own 12-month rolling dividend yield figure was 10.69% as of June 30. Three yields, three lenses, all telling you the income is real but variable. There is no fixed distribution to cut, but there is also no floor under it.
Advantages
Scale and liquidity are genuine advantages. At roughly $43.9 billion per StockAnalysis, spreads are tight and position sizes that would distort smaller funds trade easily.
The active ELN overlay is a real edge over mechanical covered-call clones. A desk that can choose strikes and tenors month to month harvests premium more intelligently than a rule that sells the same strike no matter what.
The income diversification argument is strong. Option premium is imperfectly correlated with bond coupons, which makes JEPQ a useful third income sleeve alongside credit and Treasuries.
A final structural point: because the underlying is an equity portfolio, this income survives a credit crisis that would impair bond funds, though it would not survive an equity bear market any better than stocks would. In portfolio construction terms, JEPQ's paycheck is funded by a different risk factor than every other fund in this week's batch, and that difference has real value at the allocation level.
Disadvantages
Capped upside is the structural cost. In a market that just printed 7,743 on the S&P per FRED, giving away the right tail is expensive, and JEPQ's +12.4% price return since September 2024 shows the drag plainly.
The distribution varies. Investors who underwrite their lifestyle against a 13% SEC yield are underwriting a number that has already been as low as the 10.69% rolling figure JPMorgan reported for June.
It is equity risk wearing an income costume. If Nasdaq falls 30%, JEPQ falls too, cushioned but falling. Anyone treating it as a bond substitute learned that lesson in every drawdown since May 2022.
Conclusion
JEPQ is the best-executed version of a strategy with a known trade-off: premium income and lower drawdowns in exchange for a shaved right tail. For advisors who need to convert an extended tech tape into monthly cash without triggering gains by selling, it is arguably the category killer at 0.35%. For investors whose real goal is maximum wealth compounding, the option drag is a permanent headwind. My verdict: short-term attractive while volatility is rich, long-term a tool, not a core. Size it as the income sleeve of an equity allocation, never as the fixed-income sleeve of anything.
The Lead-Lag Report is provided by Lead-Lag Publishing, LLC. All opinions and views mentioned in this report constitute our judgments as of the date of writing and are subject to change at any time. Information within this material is not intended to be used as a primary basis for investment decisions and should also not be construed as advice meeting the particular investment needs of any individual investor. Trading signals produced by the Lead-Lag Report are independent of other services provided by Lead-Lag Publishing, LLC or its affiliates, and positioning of accounts under their management may differ. Please remember that investing involves risk, including loss of principal, and past performance may not be indicative of future results. Lead-Lag Publishing, LLC, its members, officers, directors and employees expressly disclaim all liability in respect to actions taken based on any or all of the information on this writing.