Mortgage Rates Topped 7%. Housing Starts Are the Slowest Since 2020.
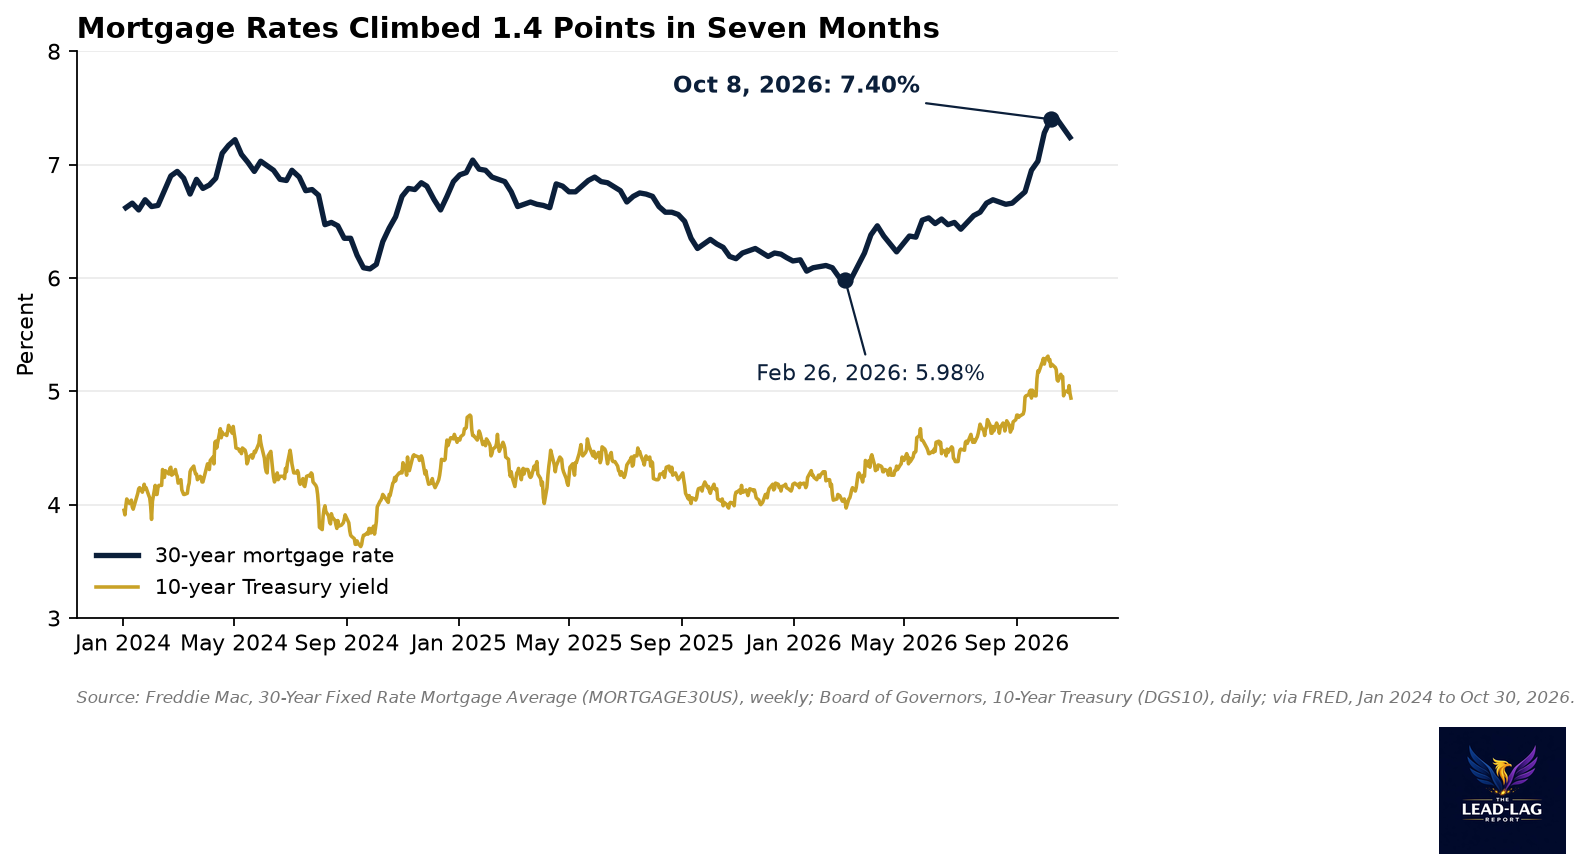
The 30-year mortgage rate rose from 5.98% in February to 7.40% in October, and housing starts slowed to their weakest three-month pace since July 2020 while permits held up.


Today’s Lead-Lag Report post is sponsored by TappAlpha

The Stock-Bond See-Saw Is Breaking. Where Does Income Come From Now? Live roundtable, Tuesday, November 3, 1:00 to 2:00 PM ET
The Fed hiked in September for the first time since 2023, and the 10-year Treasury has pushed above 5%. Bonds pay real income again, but there's a catch: when rates and inflation drive markets, stocks and bonds have tended to fall together, as they did in 2022. That leaves advisors with a harder question than how much yield to chase: where should client income come from when the bond sleeve may not cushion a stock sell-off?
Join Michael A. Gayed, CFA, publisher of The Lead-Lag Report, Si Katara, Founder and CEO of TappAlpha, and three practicing RIAs, Paul Schatz of Heritage Capital, Ricky Biel of Favor Wealth and Christian Ravsten of Foxstone Financial, for a 60-minute roundtable on rates, bonds and option-based income. No slides, just a frank conversation with time for audience questions.
On the agenda:
- Why the stock-bond relationship tends to change at higher yields, and what it means for 60/40 portfolios
- How to weigh 5% bond yields against equity income and option-based strategies
- How three RIA practices are explaining income trade-offs to clients right now
Registration is free. 1.0 CFP CE credit hour requested; CFP Board approval is pending. Register free here.
DISCLAIMER – PLEASE READ: Sponsored by TappAlpha. Views expressed are those of the speakers and are not investment advice. This is sponsored advertising content for which Lead-Lag Publishing, LLC has been paid a fee. The information provided in the link is solely the creation of TappAlpha. Lead-Lag Publishing, LLC does not guarantee the accuracy or completeness of the information provided in the link or make any representation as to its quality, and expressly disclaims any responsibility for action taken in connection with the information provided in the link. This message is educational only and is not an offer to sell or a solicitation of an offer to buy any security.
Mortgage rates went back above 7%. Builders noticed first.
On February 26 the average 30-year mortgage rate was 5.98%, the lowest reading since 2024 began. By October 8 it was 7.40%, the highest since November 2023.[1] It eased to 7.24% in the week of October 29, still up 1.26 points from the February low.[1]
That is a big move in seven months for the single price that matters most to housing. And the first group to react was not homebuyers. It was builders.
Over the three months through September, housing starts averaged an annual rate of 1.293 million units, the slowest three-month pace since July 2020.[3] Building permits over the same three months averaged 1.411 million.[4] Builders are still getting approvals. They are just not breaking ground on them.
Most of the mortgage move came from Treasuries
Mortgage rates are priced off the 10-year Treasury, plus a spread for prepayment risk, servicing and the appetite of bond buyers for mortgage securities.
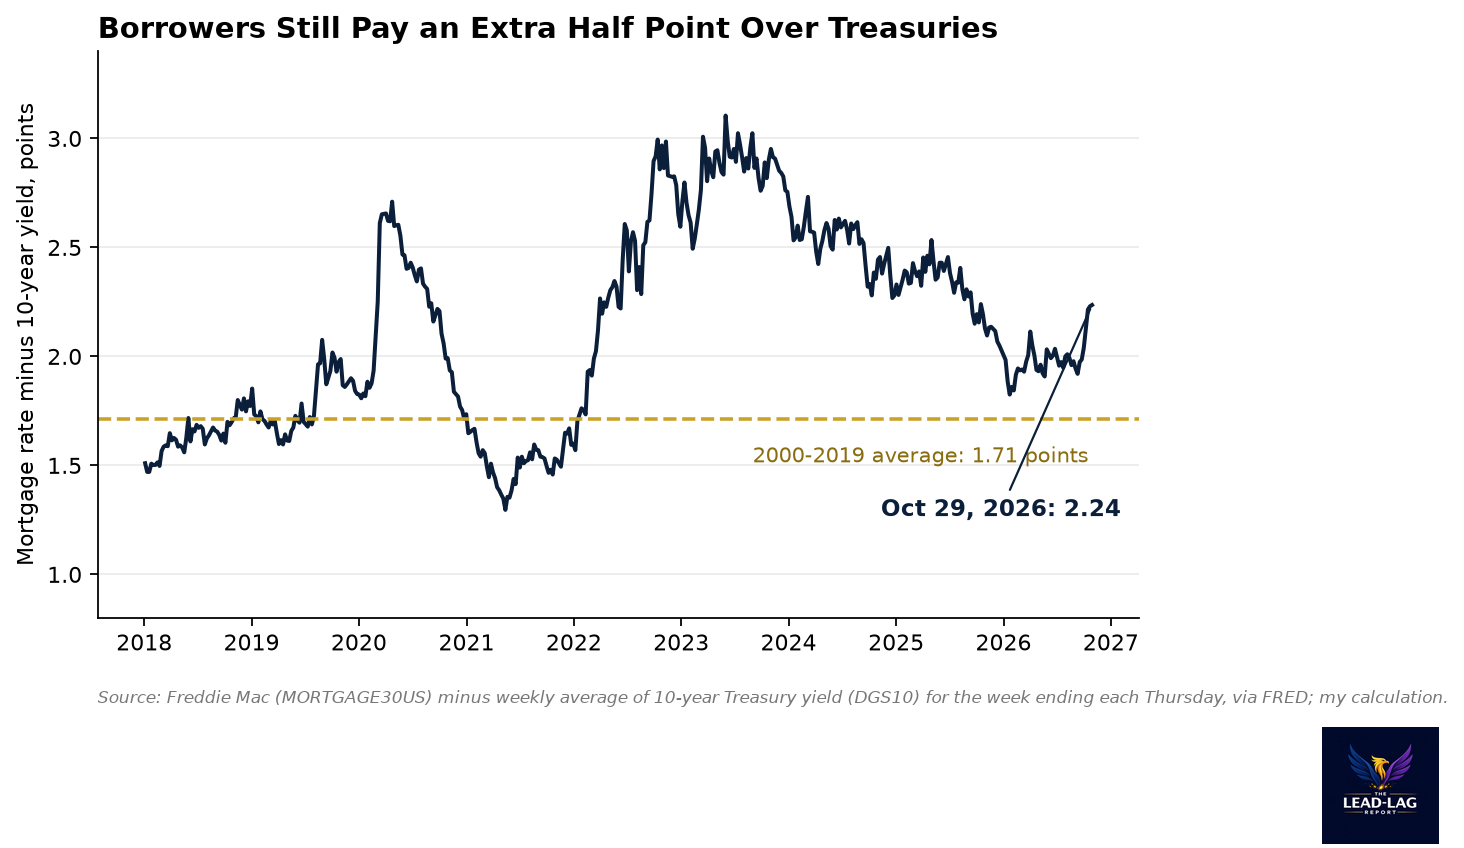
The 10-year yield averaged 4.04% in the week of February 26 and 5.00% in the week of October 29, by my calculation from daily data.[2] That is 0.96 points of the 1.26-point rise in mortgage rates. The other 0.30 points came from the spread itself widening, from 1.94 to 2.24 points.[1][2]
Some context on the spread: from 2000 through 2019 it averaged 1.71 points.[1][2] It blew out to about 3 points in 2023, then narrowed for most of the next three years. It has now turned up again. If it were back at its long-run average today, the 30-year rate would be about 6.71% instead of 7.24%, by my calculation.
That gap matters because it is not about the Fed. The Fed raised the top of its target range to 4.00% on September 17.[9] The spread is about who is willing to own mortgage bonds, and at what price.
The payment math shows why. On a $400,000, 30-year fixed loan, the monthly principal and interest is about $2,393 at 5.98% and about $2,726 at 7.24%, by my calculation. That is roughly $333 more every month, an increase of 13.9%, for the same house and the same loan. For a buyer stretching to qualify, that is the difference between getting approved and not. For a builder, it is the difference between selling a finished home at the asking price and cutting the price or paying down the buyer's rate.
Builders are holding permits and waiting
Monthly starts are noisy, which is why I prefer three-month averages. Even so, the single-month figure tells the same story. September starts ran at 1.221 million, down 7.4% from 1.319 million a year earlier.[3] Single-family starts were 859,000, the lowest since September 2025.[5]
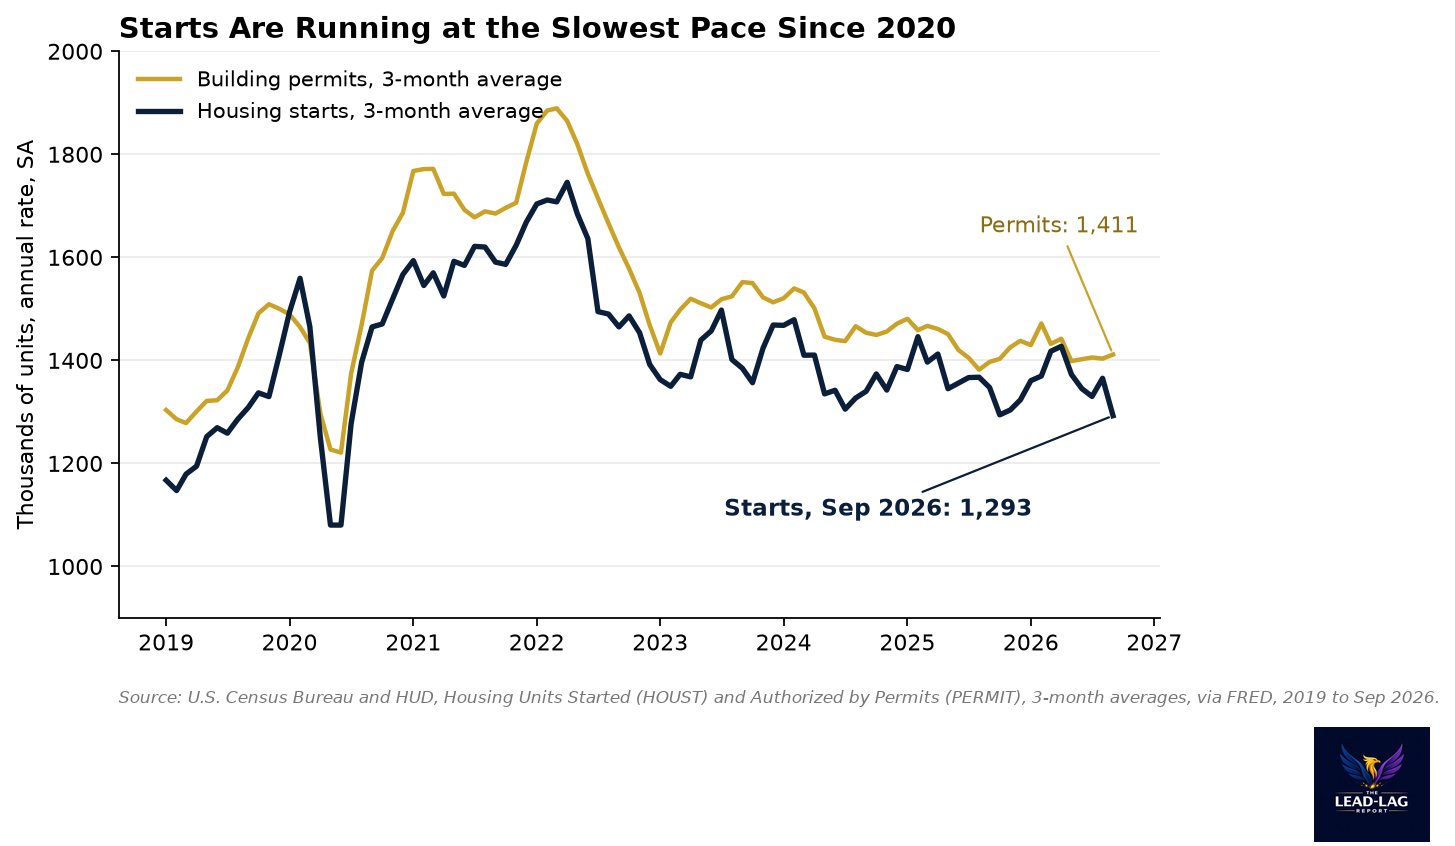
The gap between permits and starts is the tell. On a three-month basis it reached 119,000 units in September, the widest since November 2025, by my calculation.[3][4] A permit is an option to build. When builders hold the option and do not exercise it, they are waiting for a better price on the other side: either cheaper financing for their buyers or less competing supply.
They have reason to wait on supply. The inventory of new homes for sale stood at 8.4 months of sales in September.[6] New home sales ran at an annual rate of 676,000, down 5.3% from a year earlier.[7] And the pipeline is thinner than it was. Units under construction were 1.280 million in September, 25% below the October 2022 peak of 1.714 million.[8]
Existing-home buyers are stuck too
The existing-home market is not offering much relief. Sales of existing homes ran at an annual rate of 3.99 million in September, against 4.08 million in September 2025.[10] The pace has stayed between 3.93 million and 4.27 million every month for the past year.[10]
So the market has two frozen sides. Existing owners with low mortgage rates have little reason to sell. New buyers face payments set by a 7% rate. Builders, who would normally fill that gap, are pulling back from starting homes they would have to sell into that rate.
Why this matters beyond housing
Housing is one of the most rate-sensitive parts of the economy, and it tends to lead. A start today is construction jobs, materials orders and appliance sales over the next several quarters. A start that does not happen is all of that, delayed or gone.
That gives the bond market a feedback loop to watch. If the 10-year yield stays near 5%, mortgage rates stay above 7%, starts stay weak, and the drag on growth eventually shows up in the data that the bond market itself trades on. That is one of the ways high long rates can end up bringing themselves down.
The other path is the spread. If buyers of mortgage bonds come back, the 30-year rate could fall even with no help from Treasuries. A move back to the 2000 to 2019 spread alone would take more than half a point off mortgage rates, by my calculation.
What to watch
I am watching three numbers. First, the weekly mortgage rate against the 10-year yield, to see whether the spread keeps widening or turns back. Second, the permit-to-start gap: if builders start converting their permits, it means they expect better conditions ahead. Third, units under construction, because when that pipeline thins out, completions and construction employment follow.
None of these tells you where housing prices go next. They tell you whether the people closest to the market, the builders, think the rate shock is temporary. Right now they are acting as if they are not sure.
Notes
[1] 30-Year Fixed Rate Mortgage Average in the United States, weekly, Freddie Mac via FRED, series MORTGAGE30US: https://fred.stlouisfed.org/series/MORTGAGE30US. 5.98% (Feb 26, 2026, lowest since Jan 2024), 7.40% (Oct 8, 2026), 7.24% (Oct 29, 2026); last reading at or above 7.24% before October 2026 was 7.29% (Nov 22, 2023). Spread to the weekly average 10-year yield: 1.94 (Feb 26, 2026), 2.24 (Oct 29, 2026), 1.71 average 2000 to 2019; my calculation.
[2] Market Yield on U.S. Treasury Securities at 10-Year Constant Maturity, Board of Governors via FRED, series DGS10: https://fred.stlouisfed.org/series/DGS10. Weekly averages for weeks ending Thursday: 4.04% (Feb 26, 2026), 5.00% (Oct 29, 2026); my calculation. 4.94% (Oct 30, 2026).
[3] New Privately-Owned Housing Units Started: Total Units, U.S. Census Bureau and HUD via FRED, series HOUST: https://fred.stlouisfed.org/series/HOUST. 1,221 thousand (Sep 2026), 1,288 (Aug 2026), 1,369 (Jul 2026), 1,319 (Sep 2025), seasonally adjusted annual rate. Three-month average 1,293 thousand (Jul to Sep 2026), lowest since July 2020; my calculation.
[4] New Privately-Owned Housing Units Authorized in Permit-Issuing Places: Total Units, U.S. Census Bureau and HUD via FRED, series PERMIT: https://fred.stlouisfed.org/series/PERMIT. 1,398 thousand (Sep 2026), 1,403 (Aug 2026), 1,433 (Jul 2026); three-month average 1,411 thousand; permit minus start gap on three-month averages 119 thousand, widest since Nov 2025; my calculation.
[5] New Privately-Owned Housing Units Started: Single-Family Units, U.S. Census Bureau and HUD via FRED, series HOUST1F: https://fred.stlouisfed.org/series/HOUST1F. 859 thousand (Sep 2026), lowest since Sep 2025.
[6] Monthly Supply of New Houses in the United States, U.S. Census Bureau and HUD via FRED, series MSACSR: https://fred.stlouisfed.org/series/MSACSR. 8.4 months (Sep 2026).
[7] New One Family Houses Sold, U.S. Census Bureau and HUD via FRED, series HSN1F: https://fred.stlouisfed.org/series/HSN1F. 676 thousand (Sep 2026), down 5.3% from Sep 2025.
[8] New Privately-Owned Housing Units Under Construction: Total Units, U.S. Census Bureau and HUD via FRED, series UNDCONTSA: https://fred.stlouisfed.org/series/UNDCONTSA. 1,280 thousand (Sep 2026), 1,714 thousand (Oct 2022, peak).
[9] Federal Funds Target Range, Upper Limit, Board of Governors via FRED, series DFEDTARU: https://fred.stlouisfed.org/series/DFEDTARU. Raised to 4.00% effective September 17, 2026.
[10] Existing Home Sales, National Association of Realtors via FRED, series EXHOSLUSM495S: https://fred.stlouisfed.org/series/EXHOSLUSM495S. 3.99 million (Sep 2026), 4.08 million (Sep 2025); range 3.93 million (Aug 2026) to 4.27 million (Dec 2025) over the past 12 months.
The Lead-Lag Report is provided by Lead-Lag Publishing, LLC. All opinions and views mentioned in this report constitute our judgments as of the date of writing and are subject to change at any time. Information within this material is not intended to be used as a primary basis for investment decisions and should also not be construed as advice meeting the particular investment needs of any individual investor. Trading signals produced by the Lead-Lag Report are independent of other services provided by Lead-Lag Publishing, LLC or its affiliates, and positioning of accounts under their management may differ. Please remember that investing involves risk, including loss of principal, and past performance may not be indicative of future results. Lead-Lag Publishing, LLC, its members, officers, directors and employees expressly disclaim all liability in respect to actions taken based on any or all of the information on this writing.