
The Fed Already Told You
The June Summary of Economic Projections Is the Stagflation Admission Consensus Refuses to Read

Today’s Lead-Lag Report post is sponsored by Sparkline

Looking for a fresh take on value investing? ITAN helps investors modernize their U.S. value allocations, providing exposure to innovative, intangible-rich companies at attractive prices.
Learn more by visiting the ITAN Website or contacting the Sparkline Team.
DISCLAIMER – PLEASE READ: This is sponsored advertising content for which Lead-Lag Publishing, LLC has been paid a fee. The information provided in the link is solely the creation of Sparkline Capital. Lead-Lag Publishing, LLC does not guarantee the accuracy or completeness of the information provided in the link or make any representation as to its quality. All statements and expressions provided in the link are the sole opinion of Sparkline Capital and Lead-Lag Publishing, LLC expressly disclaims any responsibility for action taken in connection with the information provided in the link.
The Fed Already Told You
KEY HIGHLIGHTS
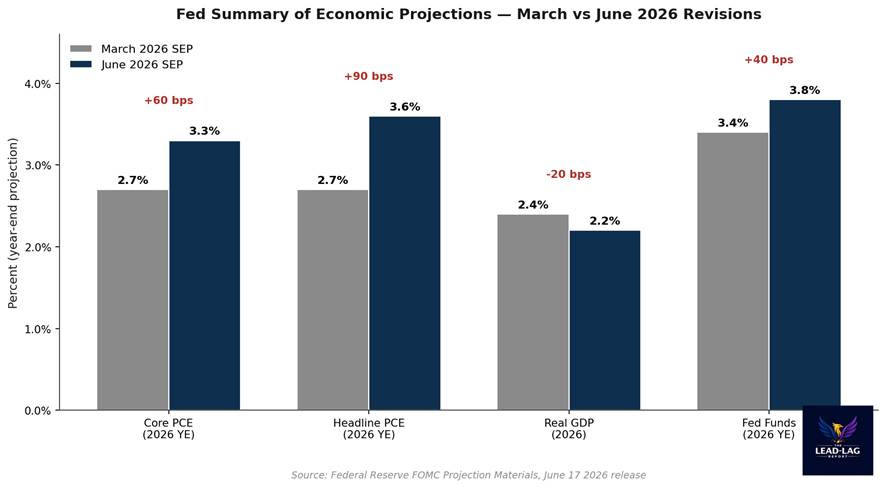
• The Fed’s June 2026 Summary of Economic Projections raised year-end Core PCE 60 basis points to 3.3%, lifted headline PCE 90 basis points to 3.6%, and cut real GDP to 2.2%. The same release does not project a return to the 2% inflation target until 2028.
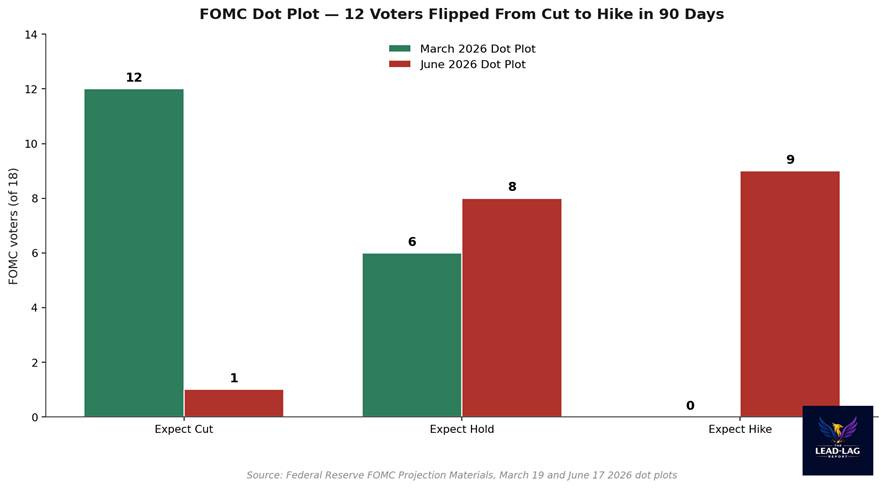
• Nine of eighteen FOMC voters now expect at least one hike before year-end, against zero in the March projections. Only one voter still sees a cut, down from twelve. That is the largest single-meeting hawkish shift in modern dot-plot history.
• Atlanta Fed GDPNow for Q2 has fallen from 4.3% on May 21 to 3.0% on June 17. Q1 2026 GDP was revised down to a 1.6% pace from the 2.0% advance estimate. The growth side of the equation is already softening.
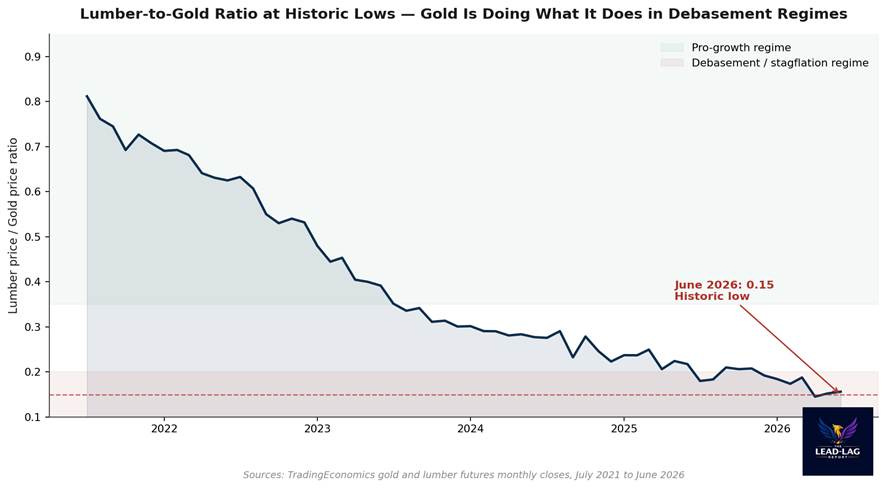
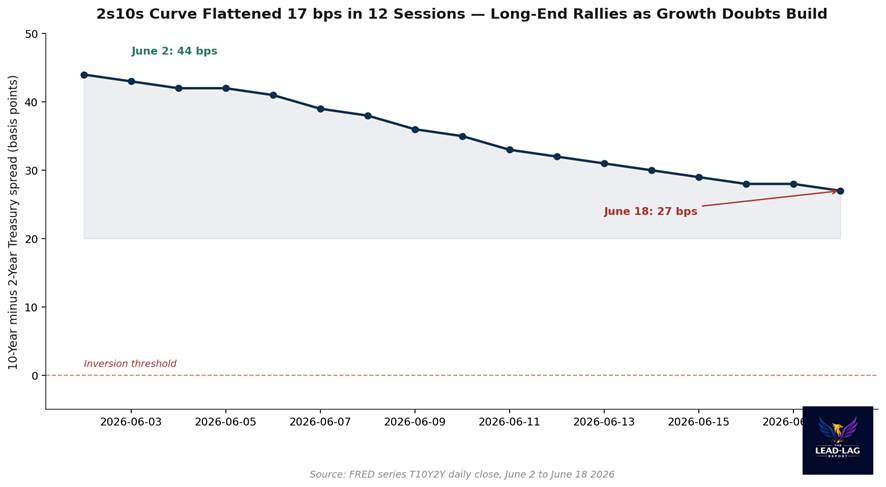
• The 2s10s Treasury curve flattened from 44 basis points to 27 in twelve trading sessions in June. Gold trades above $4,150 while the lumber-to-gold ratio sits at roughly 0.15, the lowest reading on modern record. The cross-market signal set is not consistent with a soft landing.
• Seventy-one percent of economists in the June Reuters poll still expect the Fed to hold through year-end. Fidelity’s house view assigns 55% probability to a soft landing. The Fed’s own forecasts say something materially different.
There is a particular kind of denial that takes hold late in every cycle. The data shifts. The central bank moves with the data. Consensus refuses to update. Then the gap between what officials project and what investors price gets large enough that one side has to capitulate, and it is usually not the central bank that blinks.
That gap is open right now. On June 17, the Federal Reserve published its quarterly Summary of Economic Projections alongside a unanimous 12-0 decision to hold rates steady.[1] The headline outcome was framed as boringly hawkish, a procedural pause while Chair Powell and his replacement-designate Kevin Warsh stitched together a transition. The dot plot, the inflation forecasts, and the growth revisions told a different story. The Fed marked up its inflation forecast, marked down its growth forecast, and moved its own voters into a hiking posture they had not held since 2022. The market reaction was muted. The financial press described the meeting as a hold.
That framing is wrong. The June SEP is a stagflation forecast in everything but the label. Higher inflation. Lower growth. A higher policy rate that does not bring inflation back to target for another two years. The Federal Reserve is telling anyone who is reading the same release I am that the soft-landing thesis is no longer their base case.
What the SEP Actually Says
Start with the numbers. The Fed raised its 2026 Core PCE forecast from 2.7% in March to 3.3% in June, a 60 basis point upgrade in a single quarter.[1] Headline PCE went from 2.7% to 3.6%, a 90 basis point upgrade. Real GDP for 2026 was cut from 2.4% to 2.2%. Unemployment stays anchored at 4.3% through year-end. The forecast year-end fed funds rate moved up 40 basis points to 3.8%, which is materially above current spot pricing of about 3.625%.
Take those four numbers together. Inflation revised meaningfully higher. Growth revised lower. Unemployment revised lower. Policy rate revised higher. That is the textbook signature of a central bank that has lost confidence in its own transitory framework. In March, the median FOMC participant believed Core PCE would return to 2% by the end of 2027. In June, that path was pushed back to 2028.[1] An additional year of above-target inflation, on top of the four years already accumulated since 2021.
None of this is in dispute. The numbers are published, archived, and available to any economist or investor who wants to read them. What is in dispute is the interpretation. The press release language continues to describe inflation as elevated and projections as conditional on incoming data. Powell’s press conference leaned on the framing that energy prices, tariffs, and Middle East conflict were transient supply-side shocks.[2] Warsh, in his first SEP as a designated successor, signed off on the projections without commentary. Consensus heard a hold and a calming voice. The numbers say something else.
This matters because forecasting errors at the Fed are not random. They cluster. The 2021 transitory call missed the inflation acceleration by something like fourteen percentage points cumulatively before being abandoned. The 2018 hiking cycle ended when the Fed ran into a credit-spread blowout it did not see in its own dot plot two months earlier. Errors compound when the institution has to maintain narrative continuity while the data moves. The June SEP is the first projection in this cycle where the Fed’s own staff has stopped maintaining that continuity. The numbers no longer rhyme with the language.
The Dot Plot Moved Twelve Votes in Ninety Days
The dot plot is the most pointed piece of the June release. In March, twelve of eighteen voting and non-voting FOMC participants expected at least one rate cut by year-end 2026. Zero expected a hike.[3] By June, that distribution had inverted. One voter still expects a cut. Eight expect a hold. Nine expect at least one hike. Twelve participants moved from cut to hike or hold in a single quarter.
Run a search across the FOMC dot-plot archive going back to 2012, when the projections were first published in their current form. There is no comparable single-meeting shift. The largest prior swing was the December 2018 capitulation, where the median voter dropped from three hikes to two over the course of one meeting. That move was three dots. The June 2026 move was twelve.
The mechanical reason for the shift is clear. Core PCE printed at 3.3% in April, accelerating from 2.8% in February.[4] May payrolls came in at 172,000 against consensus of 84,000.[5] The unemployment rate held at 4.3%, exactly where the Fed wants it. The labor market is not loosening, prices are reaccelerating, and the Fed has effectively no slack to lean on. When you cannot project a return to target on the existing policy path, you mark up the policy path.
The institutional implication is harder to digest. Twelve voters cannot all be wrong individually. Either the Fed’s internal models are flagging persistence risk that the press release will not name, or there is a coordinated read-through among voting members that consensus has not absorbed. Either way, when the median dot moves nine clicks in one quarter, the prudent assumption is that the central bank is signaling something it is not saying out loud.
The Reuters poll of 102 economists, conducted the week before the FOMC meeting, found 71% expecting the Fed to hold through all of 2026.[6] Only one in three saw the possibility of a hike. Less than one percent saw a cut. The economists clustered around the Fed’s old narrative while the Fed itself was moving away from it.
The Growth Side Has Already Cracked
If the only data point were the inflation upgrade, the soft-landing crowd would have a fair argument. Inflation can run hot for a quarter or two without breaking the broader economic narrative. What it cannot do, comfortably, is run hot while growth is decelerating. That combination is the precise definition of stagflation.
The growth picture has already softened. Q1 2026 real GDP was revised down to a 1.6% annualized pace from the 2.0% advance estimate.[7] The Atlanta Fed’s GDPNow tracker for Q2 sat at 4.3% as recently as May 21. By June 17, the same model had dropped to 3.0%.[8] That is a 130 basis point downgrade in less than a month, driven primarily by softening retail trade and private investment components. The Bloomberg consensus track for Q2 is now closer to 2.2%.
The trajectory is unmistakable. Q1 came in below trend, Q2 is decelerating from a high starting point, and the Fed’s own SEP marks the full-year 2026 figure down. Against that softening growth backdrop, the Fed nevertheless raised its forecast policy rate by 40 basis points. There is only one configuration where a central bank tightens into a slowdown: when its inflation forecast forces it to.
Compare this to the dominant narrative. Fidelity’s house view, published in their May Quarterly Market Outlook, assigns 55% probability to a soft landing and 30% to a mild recession.[9] The New York Fed’s 12-month-ahead recession probability sits at 16%, a multi-year low.[10] The Sahm rule reading is 0.10, well below the 0.50 recession trigger threshold.[11] Every consumer-facing risk indicator says we are nowhere near recession. None of them are calibrated to stagflation, because that regime has not existed in their lookback windows.
Cross-Market Signals Confirm the Setup
If the equity market and the consensus economist surveys are reading one regime, the bond market and commodities are reading another. The 2s10s Treasury curve flattened from 44 basis points on June 2 to 27 basis points by June 18.[12] Seventeen basis points of flattening in twelve trading sessions is a meaningful move. The driver is not a short-end repricing. The two-year yield held roughly flat at 4.05% over the same window. The flattening came almost entirely from a rally in the long end, with the ten-year falling from about 4.50% to 4.43%.
That is not how the long end behaves when growth expectations are improving. It is how the long end behaves when the market is starting to price in either a deeper-than-expected slowdown or a flight-to-quality premium against an uncertain inflation regime. The fact that this is happening while five-year breakeven inflation sits at 2.27% and the five-year, five-year forward sits at 2.23%[13] means the long end is anchored on the Fed eventually winning the inflation fight, even if the near-term path looks ugly.
The commodity signal is louder. Gold closed June 18 at $4,151.74 per ounce, up roughly 28% year-to-date and 70% from its 2024 trough.[14] Lumber closed the same day at $633 per thousand board feet, almost exactly flat year-on-year.[15] The lumber-to-gold ratio, which I have written about in this column before as a forward-looking proxy for the growth-to-debasement balance in the real economy, sits at 0.149. That is a record low going back to the start of available data. In every prior cycle where this ratio has compressed below 0.20, the macro regime has been characterized by some combination of weak growth, persistent inflation, and rising official deficits financed by monetary accommodation. We are in that configuration now.
The Michigan inflation expectations survey reinforces the read. One-year expectations sit at 4.6%, materially above the Fed’s target.[16] Five-year expectations are at 3.4%, the highest reading since 1993. Consumers are not anchored anymore. That matters because the entire credibility argument for the Fed’s transitory framing rested on the assumption that long-run expectations would stay anchored at 2%. They are not.
The Historical Parallel That Should Make You Uncomfortable
The closest analog to the current setup is not 2008, not 2000, and not 2020. It is 1973-1975, and to a lesser extent 1979-1980. In both prior stagflation regimes, the proximate trigger was a Middle East oil shock combined with an already-tight labor market and a Federal Reserve that had spent the preceding cycle running policy too loose. In 1973, real GDP contracted 3.2% peak-to-trough while CPI peaked at 12.3%. In 1979, the Iranian Revolution drove a second oil-price shock that lifted CPI to 14.8% at a moment when unemployment was already drifting higher.
I am not arguing the magnitudes line up. They do not. The structural composition of the U.S. economy is less energy-intensive than it was in the 1970s, the labor share of GDP is lower, and the Fed has thirty years of credibility built up through Volcker and his successors. The mechanics are different. But the configuration is rhyming uncomfortably. Tight labor market. Elevated inflation refusing to return to target. A Fed that has run policy below its own neutral estimate for longer than any prior cycle in the modern era. Middle East tension driving the marginal commodity input. Long-end yields refusing to rally in proportion to the slowdown signals because the inflation tail is too fat to ignore.
The lesson from those prior regimes is that the equity duration trade is the most exposed. Long-duration growth equities, which derive most of their valuation from cash flows expected far in the future, get repriced violently when the discount rate refuses to fall on schedule. From 1973 to 1974, the S&P 500 fell 48% in nominal terms and a larger amount in real terms. The Nifty Fifty growth complex, which had been the consensus crowded trade, fell harder. From 1979 to 1981, real equity returns were essentially flat over two years despite a strong nominal rally, because inflation ate the cash flows.
The defensible exposures in those regimes were short-duration cash flows, real assets, and the parts of the energy and materials complex that had pricing power. Gold did well in both. The dollar did not. Long-duration sovereign bonds were terrible. Credit spreads widened materially in 1974 and stayed wide for three years.
The Steelman Argument
Let me give the soft-landing argument its fairest version. The June inflation upgrade was driven heavily by energy and tariff-related goods, both of which the Fed correctly identifies as supply-side. If those shocks fade through Q3, the data will mean-revert. The Fed projects a return to 2% by 2028 not because it expects a miracle but because the supply shocks have a known mechanical drag on year-on-year comparisons. The labor market has held in remarkably well. Real disposable income is still positive. Household balance sheets have not deteriorated meaningfully. The NY Fed’s 84% no-recession base case is grounded in actual coincident data, not in faith.
That is the steelman. It is not crazy. It is the consensus for a reason. The bear case I am sketching here requires inflation to remain sticky enough that the Fed cannot deliver the easing path the curve still partially prices. It requires the labor market to soften from a position of strength rather than from collapse. It requires the lumber-to-gold ratio to be reading something real about debasement risk rather than just reflecting structural changes in housing demand. None of those are guaranteed.
Here is the falsification condition I am willing to commit to. If Core PCE prints below 3.0% year-on-year for two consecutive months by the September 2026 release, and the Atlanta Fed GDPNow tracker for Q3 holds above 2.5% through the quarter, the stagflation thesis I am laying out here is wrong. The supply shocks will have rolled off, the Fed will be able to honor its 2028 path, and the soft landing will be the correct frame. I will write that piece if it happens. I do not expect to.
What to Do When the Forecast Diverges From the Narrative
The asymmetry here is what makes this worth writing. If consensus is right and the soft landing holds, the average portfolio is positioned correctly and incremental adjustments are unnecessary. If the Fed’s own SEP is right, the average portfolio is positioned for the wrong regime. Long-duration growth equity that compounded the 2023-2025 rally now has a discount-rate risk it did not have at the beginning of the year. Investment-grade credit spreads at 80 basis points have almost no cushion against a meaningful slowdown. The equity risk premium is at the lowest level since the dot-com peak.
Positioning that respects the SEP rather than the narrative is not exotic. It is the standard 1970s playbook updated for current instruments. Real assets that earn pricing power in nominal terms. Energy producers with disciplined capital allocation. Gold and gold miners, which have already telegraphed the regime. Short-duration Treasuries and TIPS that earn the carry without the duration risk. Modest commodity exposure across the broader complex. The trades that look boring against a backdrop of artificial intelligence and growth euphoria are the trades that survive when the central bank tells you, in its own published forecasts, that the regime has changed.
The Fed has done the work for us. It published the numbers. It moved twelve votes. It pushed the return-to-target out another year. The institution is signaling, in the only language it has available to it without breaking communication discipline, that the soft landing is no longer the central case. Consensus has not updated yet. That is the gap. That is what is left to trade.
Read the projections. They are not opaque. The Fed already told you.
Few understand this.
— — —
Notes
[1] Federal Reserve, Summary of Economic Projections, June 17, 2026 release. https://www.federalreserve.gov/monetarypolicy/fomcprojtabl20260617.htm. Core PCE 2026 YE: 3.3% (March: 2.7%). Headline PCE 2026 YE: 3.6% (March: 2.7%). Real GDP 2026: 2.2% (March: 2.4%). Unemployment 2026 YE: 4.3%. Fed funds 2026 YE: 3.8% (March: 3.4%). Return-to-target path: 2028 in June projections vs 2027 in March projections.
[2] CF Insights, FOMC June 2026 recap, June 17 2026. https://cf.com/insights/fomc-recap-june-2026. First Warsh-attended meeting; 12-0 unanimous hold; removed easing forward guidance from statement.
[3] Federal Reserve FOMC Projection Materials, March 19 2026 dot plot. https://www.federalreserve.gov/monetarypolicy/fomcprojtabl20260319.htm. Twelve of eighteen participants expected at least one cut in 2026; zero expected a hike.
[4] Bureau of Economic Analysis, Personal Consumption Expenditures Price Index Excluding Food and Energy, April 2026 release. https://www.bea.gov/data/personal-consumption-expenditures-price-index-excluding-food-and-energy. Core PCE YoY: 3.3% in April, up from 2.8% in February.
[5] Bureau of Labor Statistics, Employment Situation, May 2026 release. https://www.bls.gov/opub/ted/2026/unemployment-rate-unchanged-at-4-3-percent-in-may-2026.htm. Nonfarm payrolls +172,000; unemployment rate 4.3%; consensus expectation 84,000.
[6] U.S. News / Reuters, ‘Fed to Hold Rates This Year, Cut Calls Fade,’ June 9 2026. https://money.usnews.com/investing/news/articles/2026-06-09/fed-to-hold-rates-this-year-cut-calls-fade-as-war-inflation-persists-economists-say-reuters-poll. Survey of 102 economists conducted June 2-6 2026: 71% expect hold through 2026; 33% see possibility of hike; 0.55% see cut.
[7] Bureau of Economic Analysis, GDP second estimate for Q1 2026, released May 29 2026. Q1 real GDP revised to 1.6% annualized from 2.0% advance estimate. Coverage: Benzinga, May 30 2026. https://www.benzinga.com/markets/macro-economic-events/26/05/52835775/us-pce-inflation-report-april-2026.
[8] Federal Reserve Bank of Atlanta, GDPNow, Q2 2026 tracker. https://www.atlantafed.org/research-and-data/data/gdpnow. May 21 reading: 4.3%. June 17 reading: 3.0%.
[9] Fidelity Investments, Quarterly Market Outlook, May 2026. Soft landing assigned 55% probability; mild recession 30%; severe recession 15%.
[10] Federal Reserve Bank of New York, 12-Month-Ahead U.S. Recession Probability, May 2026 update. Reading: 16%, down from 24% in March. Coverage via whatisarecession.com, June 2026. https://whatisarecession.com/current-probability-2026.
[11] Sahm Rule recession indicator, FRED series SAHMREALTIME. May 2026 reading 0.10; trigger threshold 0.50. Three-month moving average of unemployment vs trailing 12-month low remains below the recession signal level.
[12] FRED, series T10Y2Y, Treasury yield curve 10-Year minus 2-Year, daily close. https://fred.stlouisfed.org/series/T10Y2Y. June 2: 44 bps. June 18: 27 bps. Ten-year yield: 4.43% on June 18. Two-year yield: 4.05% on June 18.
[13] FRED, series T5YIE (5-year breakeven inflation rate) and T5YIFR (5-year, 5-year forward inflation expectation rate), June 18 2026 daily close. https://fred.stlouisfed.org/series/T5YIE. Five-year breakeven: 2.27%. Five-year, five-year forward: 2.23%.
[14] Trading Economics, gold spot price, June 18 2026 close. https://tradingeconomics.com/commodity/gold. Settlement: $4,151.74 per ounce. Year-to-date return: approximately +28%.
[15] Trading Economics, lumber futures, June 18 2026 close. https://tradingeconomics.com/commodity/lumber. Settlement: $633.00 per thousand board feet. Year-on-year change: approximately flat.
[16] University of Michigan Surveys of Consumers, June 2026 preliminary release. One-year inflation expectation: 4.6%. Five-to-ten-year inflation expectation: 3.4%, highest since 1993. Coverage: Trading Economics. https://tradingeconomics.com/united-states/michigan-inflation-expectations/news/558747.
[17] Bureau of Labor Statistics historical CPI data, July 1974 peak: 12.3% YoY. October 1980 peak: 14.8% YoY. Real GDP contracted 3.2% from Q4 1973 to Q1 1975 peak-to-trough. Two-cycle stagflation regime 1973-1982 cumulative real S&P 500 return: approximately -25% despite roughly flat nominal index level.
The Lead-Lag Report is provided by Lead-Lag Publishing, LLC. All opinions and views mentioned in this report constitute our judgments as of the date of writing and are subject to change at any time. Information within this material is not intended to be used as a primary basis for investment decisions and should also not be construed as advice meeting the particular investment needs of any individual investor. Trading signals produced by the Lead-Lag Report are independent of other services provided by Lead-Lag Publishing, LLC or its affiliates, and positioning of accounts under their management may differ. Please remember that investing involves risk, including loss of principal, and past performance may not be indicative of future results. Lead-Lag Publishing, LLC, its members, officers, directors and employees expressly disclaim all liability in respect to actions taken based on any or all of the information on this writing.