
The Reserve Cushion Was Thinner Than It Looked
Reserves are large in dollars but thin relative to the system they must finance. SRF activation and repo spreads show the Fed's ample-reserves cushion is smaller than the headline balance implies.

Today’s Lead-Lag Report post is sponsored by Tuttle Capital

The Tuttle Capital Heavy Asset Low Obsolescence ETF (HALX) tracks a rules-based index of U.S. companies with a different profile from many AI-related companies: heavy tangible assets, durable asset-backed cash flow, and low reliance on digitizable, asset-light business models — think regulated utilities, freight rail, pipelines, and materials producers.
The underlying index, built and maintained by VettaFi, scores companies on a “HALO Score” — tangible asset intensity, cash flow durability, and low digital-substitution risk — and holds roughly 30–50 constituents, equal-weighted, rebalanced quarterly. Launched May 19, 2026 on Cboe. Passively managed. Learn more at halxetf.com.
Investors should carefully consider the investment objectives, risks, charges, and expenses of the Tuttle Capital Heavy Asset Low Obsolescence ETF before investing. For a prospectus with this and other important information about the Fund, please visit halxetf.com/ or call (833) 759-6110. Please read the prospectus carefully before investing.
Investment in the Fund is subject to investment risks, including the possible loss of some or the entire principal amount invested. There can be no assurance that the Fund will be successful in meeting its investment objective. Limited History of Operations Risk, Index Tracking Risk, Non-Diversification Risk, and the theme underlying the Fund may fall out of favor, underperform broader equity markets, or experience periods of significant volatility. Companies with high fixed costs and significant capital expenditure requirements may experience amplified earnings volatility during periods of reduced demand. ETF shares may trade at a premium or discount to NAV. Any reference to a third party, including VettaFi LLC, does not imply endorsement of the Fund.
Investments involve risk. Principal loss is possible.
The Fund is distributed by Foreside Fund Services, LLC.
DISCLAIMER – PLEASE READ: This is sponsored advertising content for which Lead-Lag Publishing, LLC has been paid a fee. The information provided in the link is solely the creation of Tuttle Capital Management. Lead-Lag Publishing, LLC does not guarantee the accuracy or completeness of the information provided in the link or make any representation as to its quality. All statements and expressions provided in the link are the sole opinion of Tuttle Capital Management and Lead-Lag Publishing, LLC expressly disclaims any responsibility for action taken in connection with the information provided in the link.
KEY HIGHLIGHTS
• A large reserve number is not the same thing as an ample operating cushion. The relevant question is whether banks still treat an incremental reserve as nearly interchangeable with cash in overnight markets.
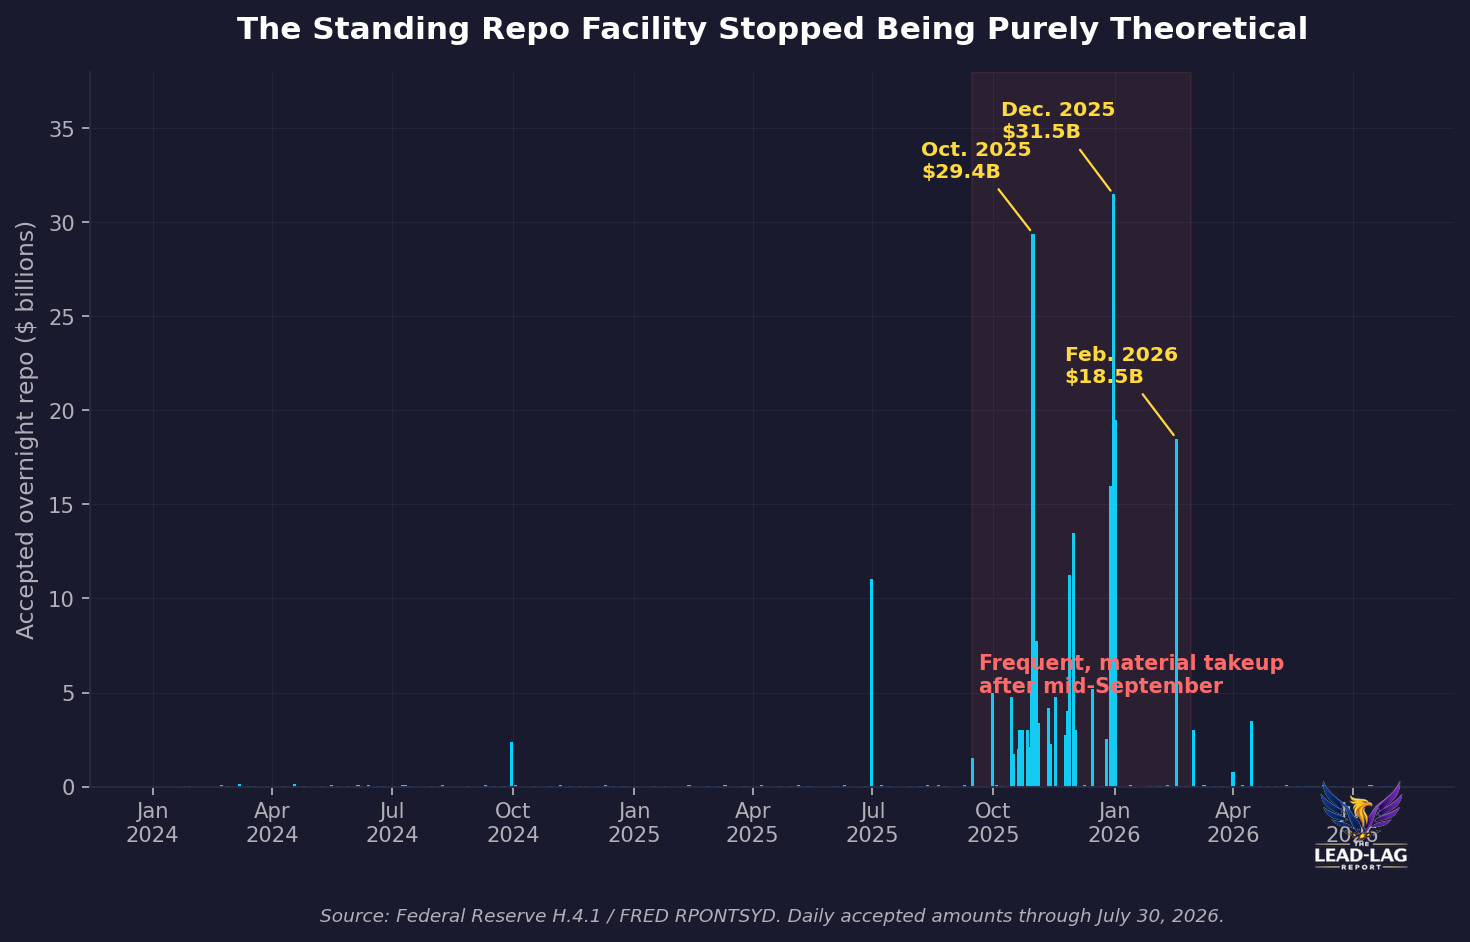
• The Standing Repo Facility is not merely a safety net. Its activation is a price signal: private cash was not clearing cheaply enough against eligible collateral.
• The end of runoff was a policy choice made before an acute break. That is better risk management, but it is also evidence that the endpoint arrived sooner than a casual reading of the headline reserve balance suggests.
• The key distinction is mechanical: abundant reserves leave money-market prices insensitive to modest supply changes; ample reserves leave a cushion; scarce reserves make prices jump.
There is a phrase that does too much work in monetary-policy commentary: “reserves are plentiful.” It sounds quantitative, almost scientific. It is neither. A reserve balance is a deposit a bank holds at the Federal Reserve. The question is not whether the system has a large dollar amount. The question is whether the marginal unit still behaves like surplus liquidity when a dealer needs cash, the Treasury draws its account down or up, or a reporting date compresses balance-sheet capacity.
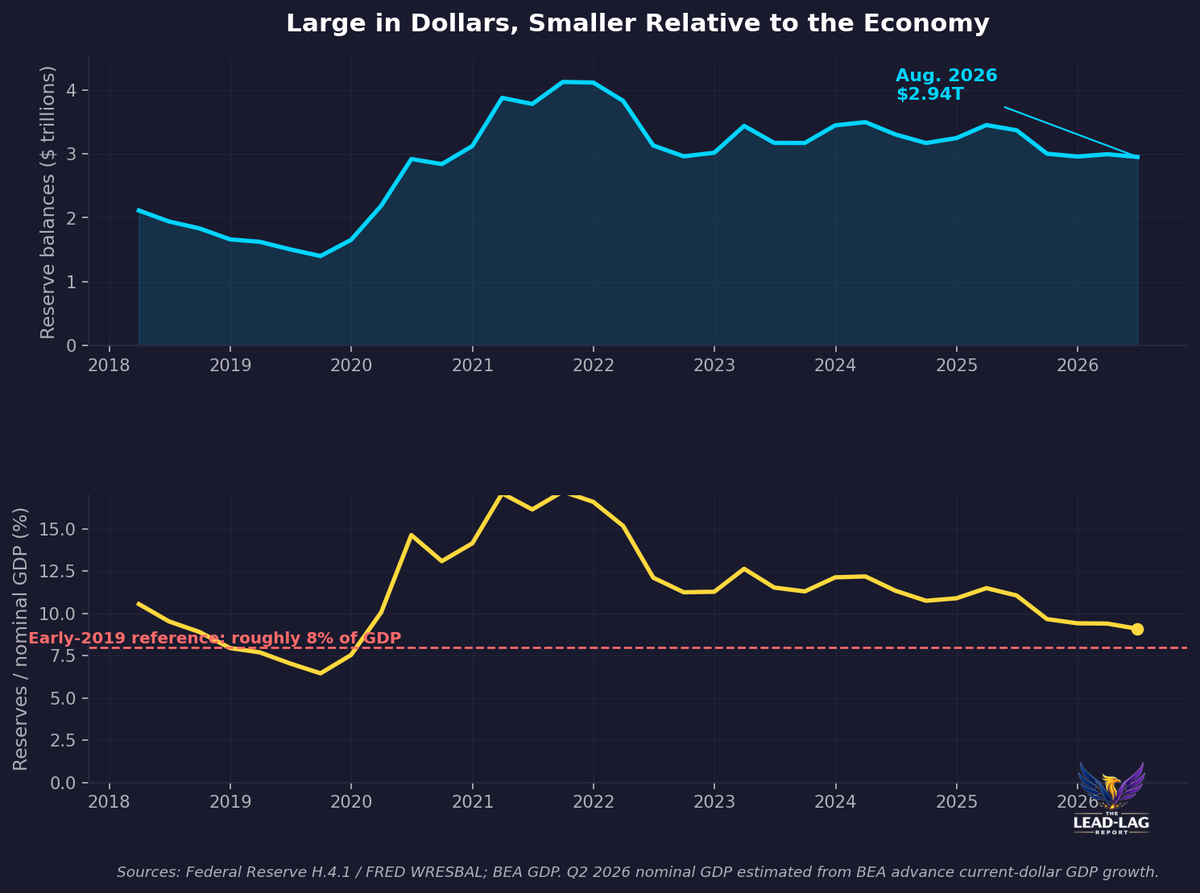
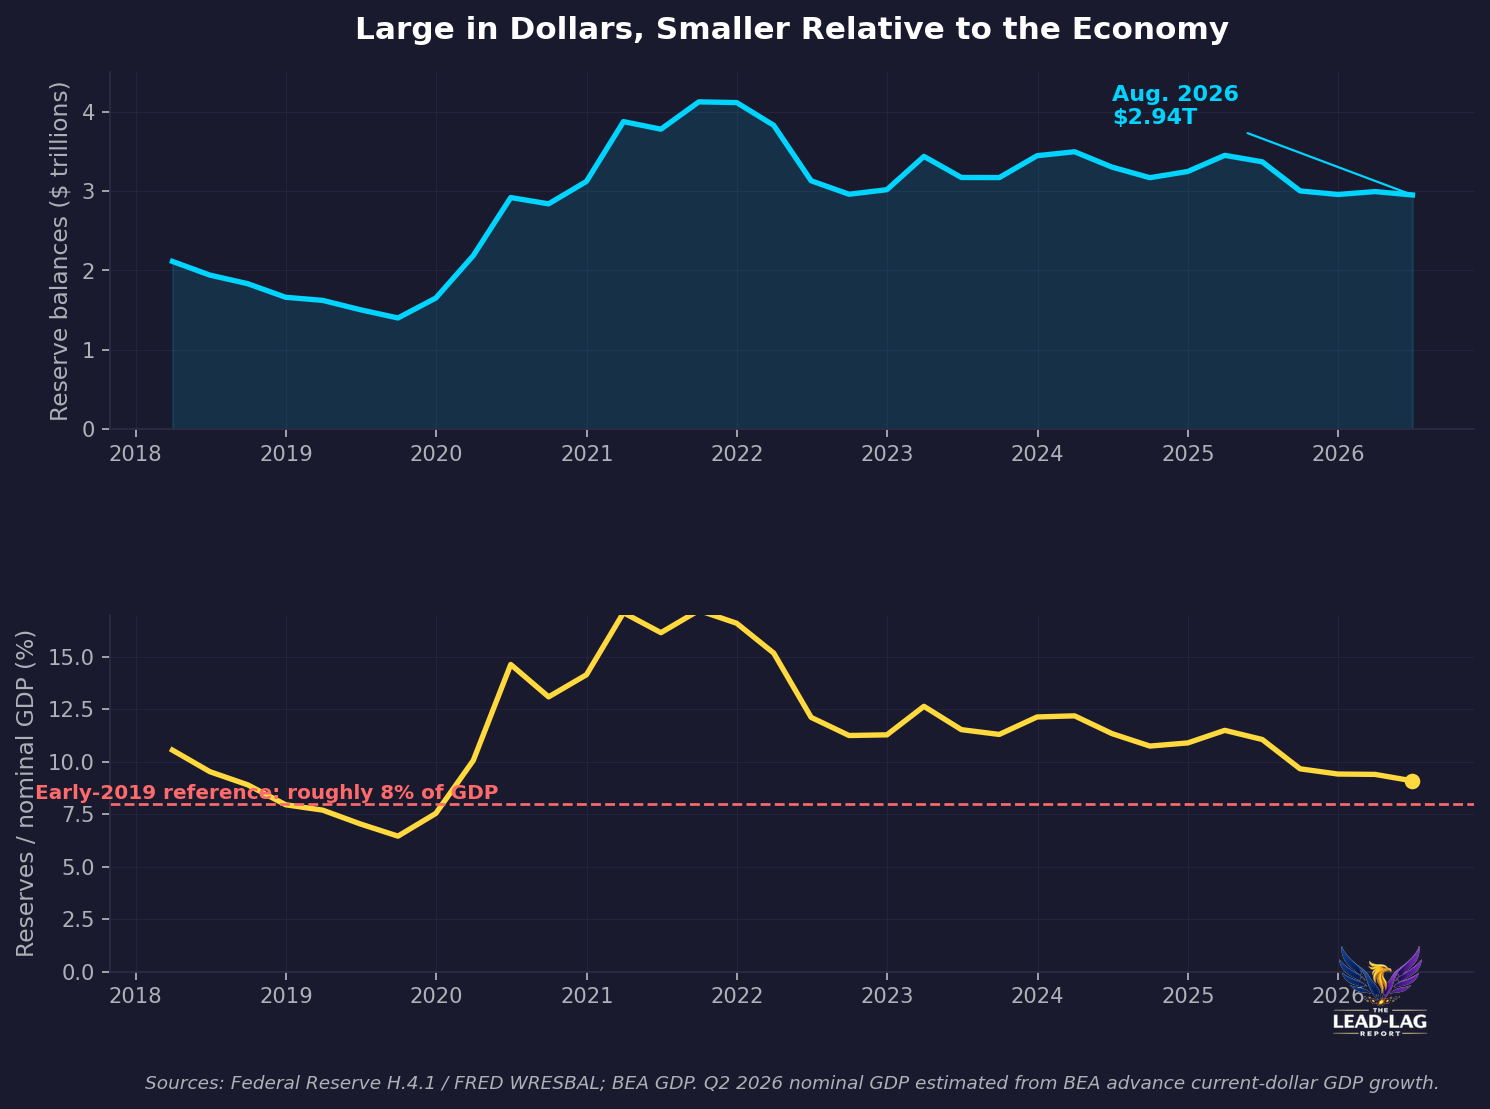
That distinction is why the reserve story matters now. Reserve balances averaged $2.944 trillion in the Federal Reserve’s latest weekly release. [1] On a nominal-GDP basis, that is roughly 9.1 percent using the advance second-quarter estimate. [2] The ratio is still above the roughly 8 percent level Chair Powell cited for early 2019, before the September funding event. [3] But it is only a ratio, not a pass/fail test. The better conclusion is not that reserves are already scarce. It is that the cushion between “large” and “truly insensitive to shocks” has become thin enough to show up in market plumbing.
The word that matters is ample
The Federal Reserve’s operating framework is often simplified into a binary: either reserves are abundant or they are scarce. The staff’s own work is more precise. In an abundant state, the marginal liquidity value of reserves is close to zero and overnight rates are comparatively insensitive to shifts in supply. In an ample state, the system still has a cushion against demand and supply shocks. In a scarce state, the demand curve steepens: banks become less willing to part with reserves, reserve-price spreads widen, and small changes in supply have larger effects. [4] “Ample” is therefore a behavior of the funding system. It is not a trophy awarded to a large headline number.
That is also why the GDP denominator is useful but incomplete. Nominal GDP has grown while the aggregate reserve stock has come down from its pandemic high. Payments, deposits, regulation, Treasury collateral, and the distribution of reserves across institutions have all changed too. A smaller reserve-to-GDP ratio is a warning light because the system is bigger. It is not the engine diagnosis. The diagnosis comes from the price of cash and from who is willing to take the Federal Reserve as counterparty.
The Federal Reserve’s public-data research reaches the same methodological point. It estimates a transition from ample to less-than-ample conditions in the earlier runoff episode when reserves were just under 11 percent of bank assets, while the acute September 2019 event arrived when reserves were about 8 percent of bank assets. The study’s preferred historical marker for minimum ample conditions is reserve balances around 65 percent of Fedwire payment value, alongside an effective federal funds rate near 1 basis point below IORB. It also says plainly that the estimates are uncertain and can change with regulation and payments architecture. [5] That uncertainty is an argument for watching market signals more closely, not for ignoring the denominator.
The facility became a signal
The Standing Repo Facility was created to keep a repeat of the September 2019 scramble from becoming an implementation failure. It lends cash overnight against Treasury, agency debt, and agency mortgage-backed securities at an administered rate. In December 2025, the Desk removed its aggregate operating limit and moved the facility to full allotment. [6] That is a stronger backstop than the market had in 2019. It is not a reason to treat usage as benign.
A facility with a rate above ordinary private funding is meant to be quiet. When it is used in meaningful size, somebody has concluded that cash through the facility is preferable to cash in the market. The series shifted after mid-September 2025. FRED’s daily operation series shows accepted takeup of $29.4 billion on October 31, $31.5 billion on December 31, and $18.5 billion on February 17. [7] The different reporting-date observations are not interchangeable, but they point in the same direction: the backstop had become relevant.
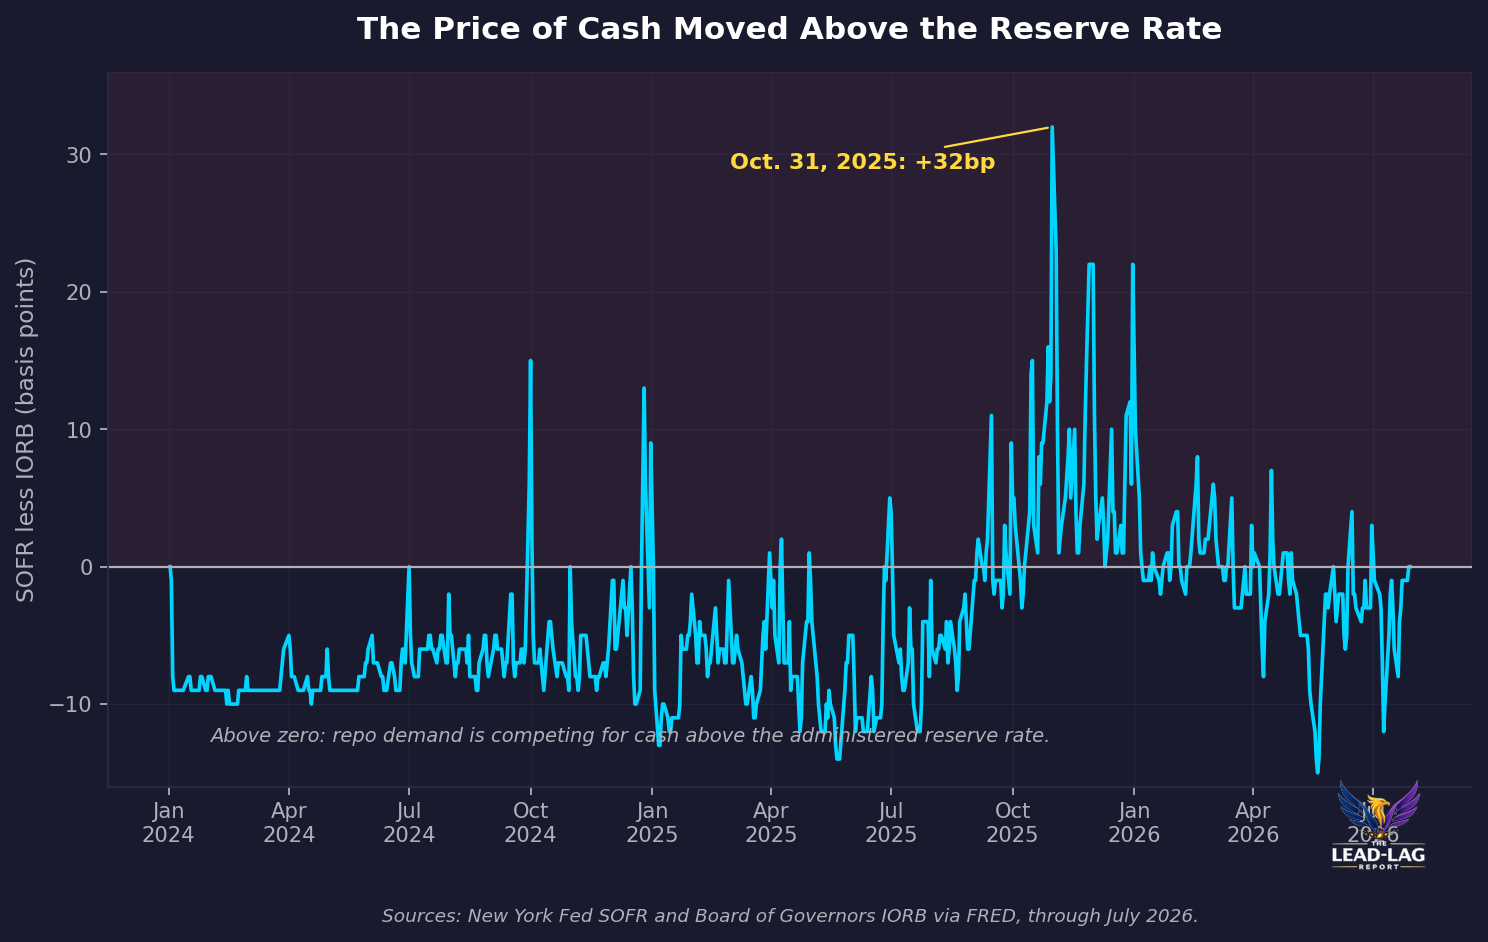
The price signal says the same thing. SOFR traded 32 basis points above the interest-on-reserve-balances rate on October 31, 2025. [8] This was not the September 2019 event, and it should not be described as one. But the mechanism is familiar. Repo demand met a balance-sheet constraint, and the price of cash rose above the administered reserve rate. A system with abundant reserves is supposed to absorb ordinary dates and ordinary collateral without making that spread the story.
The Treasury account is the transmission channel
Reserve balances do not move only because the Federal Reserve changes its securities portfolio. The Treasury General Account is a direct mechanical drain when it rises, and other Federal Reserve liabilities compete for the same balance-sheet space. In the August 12 H.4.1 release, the Treasury’s general account was $959 billion, while total non-reserve factors absorbing reserve funds were $3.862 trillion. [1] The point is not that every dollar of TGA movement produces a dollar-for-dollar funding problem. The point is that a supposedly vast reserve pool can be reallocated quickly by variables that have nothing to do with the policy-rate decision.
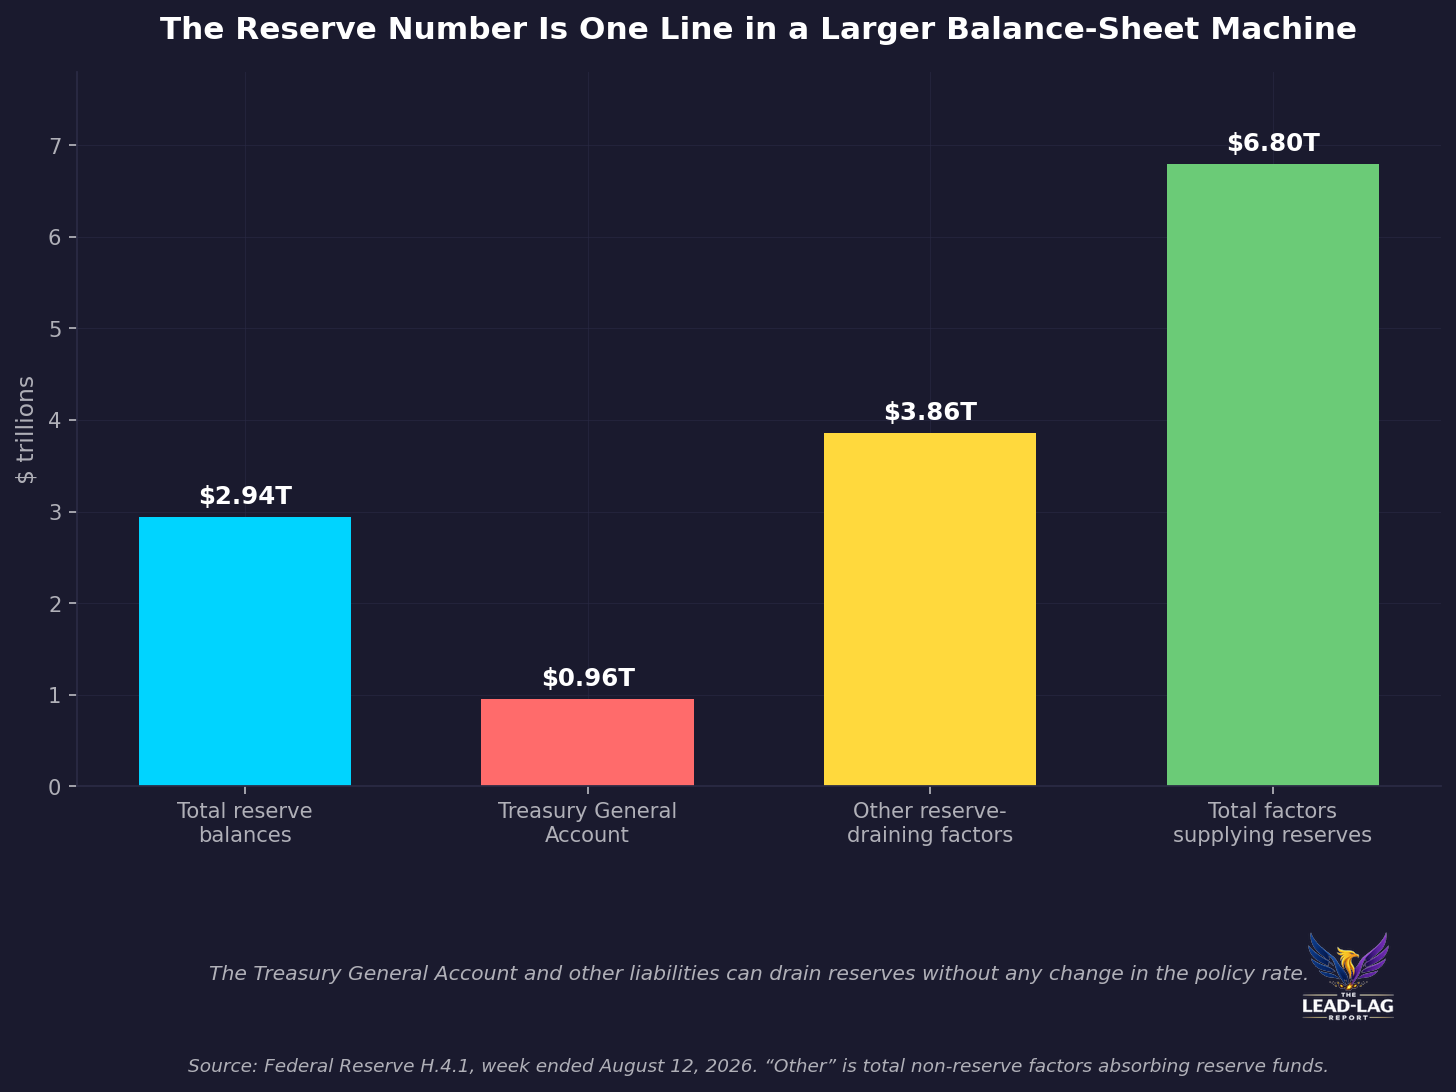
This is where the consensus narrative is too relaxed. It looks at a reserve stock near three trillion dollars and imagines the 2019 episode cannot be relevant. Yet the New York Fed’s account of that episode emphasizes that reserves can be scarce for some institutions even if aggregate reserves exceed the sum of desired holdings, because the interbank market may not reallocate them efficiently. It also identifies dealer intermediation costs and a temporary pullback from money funds as part of the mechanism. [8] The plumbing does not clear on aggregate arithmetic alone.
QT already gave the answer
There is an uncomfortable practical implication. The Federal Reserve ended balance-sheet runoff effective December 1, 2025, explaining that money-market conditions suggested reserves were approaching the ample level. [10] That was not a capitulation. It was the framework working as designed: slow, then stop, before crossing into a regime where every change in Treasury cash management creates a rate shock. But it also means the language that QT could simply run on because reserves were “abundant” missed the operative constraint. The endpoint was not an abstract future debate. It was reached when the market began showing sensitivity.
The strongest rebuttal deserves to be taken seriously. The SRF is now a full-allotment facility; the late-2025 pressure eased; and quarter-end or year-end spreads can reflect dealer reporting constraints rather than an aggregate reserve shortage. Federal Reserve staff made precisely that distinction in their market-indicator work. [4] If the facility absorbs those idiosyncratic pressures without a persistent rise in spreads, the operating framework is doing its job and the reserve level can remain ample at a lower dollar amount than the public expects.
That rebuttal is why this is not a claim that a replay of 2019 is imminent. It is a claim about the signal hierarchy. The aggregate reserve number is a lagging comfort statistic. The SRF, SOFR–IORB, reporting-date behavior, the Treasury account, and the distribution of reserves are the leading indicators. They showed that the cushion was becoming conditional well before a headline crisis appeared.
What would prove this wrong
The ample-threshold-proximity thesis is falsified if reserve balances remain above 10 percent of nominal GDP through year-end 2026 while SOFR stays below IORB on every September and December reporting date and SRF takeup remains below $10 billion on each of those dates. That outcome would show that the late-2025 activation was a contained operational adjustment, not a sign that the system was approaching a less-ample regime.
The reserve stock looks large because it is measured in dollars. The lead-lag is in the price and availability of the marginal dollar. The facility has already told us which measure matters.
Few understand this.
— — —
Notes
[1] Federal Reserve Board, H.4.1 “Factors Affecting Reserve Balances,” release dated August 13, 2026. Reserve balances, Treasury General Account, and other factors absorbing reserve funds, week ended August 12, 2026. https://www.federalreserve.gov/releases/h41/current/
[2] Bureau of Economic Analysis, “GDP (Advance Estimate), 2nd Quarter 2026,” July 30, 2026. Current-dollar GDP rose at a 7.9 percent annual rate in Q2; the reserve/GDP ratio uses Q2 nominal GDP inferred from the Q4 2025 GDP level and 2026 quarterly current-dollar growth rates. https://www.bea.gov/news/2026/gdp-advance-estimate-2nd-quarter-2026
[3] Jerome H. Powell, “Speech on the economic outlook and monetary policy,” October 14, 2025. Powell stated reserves were just below $3 trillion, about 10 percent of GDP, versus near 8 percent in early 2019, and cautioned that reserves/GDP is only indicative. https://www.federalreserve.gov/newsevents/speech/powell20251014a.htm
[4] James A. Clouse, Sebastian Infante, and Zeynep Senyuz, Federal Reserve FEDS Notes, “Market-Based Indicators on the Road to Ample Reserves,” January 31, 2025. Definitions of abundant, ample, and scarce conditions; discussion of reporting-date pressures and the SRF backstop. https://www.federalreserve.gov/econres/notes/feds-notes/market-based-indicators-on-the-road-to-ample-reserves-20250131.html
[5] Erin Ferris, Amy Rose, and Manjola Tase, Federal Reserve FEDS Notes, “What can public Fedwire payments data tell us about ample reserves?” July 18, 2025. Historical estimates of reserve-demand breakpoints and caveats. https://www.federalreserve.gov/econres/notes/feds-notes/what-can-public-fedwire-payments-data-tell-us-about-ample-reserves-20250718.html
[6] Federal Reserve Bank of New York, “Statement Regarding Standing Overnight Repo Operations,” December 10, 2025. Full-allotment format and removal of the aggregate operating limit. https://www.newyorkfed.org/markets/opolicy/operating_policy_251210
[7] Federal Reserve Economic Data, “Repurchase Agreements: Treasury Securities Sold by the Federal Reserve in the Temporary Open Market Operations,” series RPONTSYD. Daily accepted amounts used in the article and chart. https://fred.stlouisfed.org/series/RPONTSYD
[8] Federal Reserve Economic Data, Secured Overnight Financing Rate (SOFR) and Interest on Reserve Balances (IORB). October 31, 2025 SOFR–IORB spread. https://fred.stlouisfed.org/series/SOFR and https://fred.stlouisfed.org/series/IORB
[8] Gara Afonso, Marco Cipriani, Anna Kovner, Gabriele La Spada, and Antoine Martin, Federal Reserve Bank of New York, “The Market Events of Mid-September 2019,” 2021. Reserve distribution, interbank frictions, and dealer-intermediation mechanisms. https://www.newyorkfed.org/research/epr/2021/epr_2021_market-events_afonso.html
[10] Federal Reserve Board, “Policy Normalization.” The FOMC ceased runoff effective December 1, 2025; the page states that money-market conditions suggested reserves were approaching the ample level. https://www.federalreserve.gov/monetarypolicy/policy-normalization.htm
The Lead-Lag Report is provided by Lead-Lag Publishing, LLC. All opinions and views mentioned in this report constitute our judgments as of the date of writing and are subject to change at any time. Information within this material is not intended to be used as a primary basis for investment decisions and should also not be construed as advice meeting the particular investment needs of any individual investor. Trading signals produced by the Lead-Lag Report are independent of other services provided by Lead-Lag Publishing, LLC or its affiliates, and positioning of accounts under their management may differ. Please remember that investing involves risk, including loss of principal, and past performance may not be indicative of future results. Lead-Lag Publishing, LLC, its members, officers, directors and employees expressly disclaim all liability in respect to actions taken based on any or all of the information on this writing.



