Treasuries Are a Hedge Again. Credit and Oil Explain Why.
Long Treasuries rose while stocks fell, credit spreads widened and Brent hit $116.72. The stock-bond correlation turned negative for the first time since July. What the move says about growth, inflation and the next two weeks.

Today’s Lead-Lag Report post is sponsored by Sparkline

Looking for a fresh take on value investing? ITAN helps investors modernize their U.S. value allocations, providing exposure to innovative, intangible-rich companies at attractive prices.
Learn more by visiting the ITAN Website or contacting the Sparkline Team.
DISCLAIMER – PLEASE READ: This is sponsored advertising content for which Lead-Lag Publishing, LLC has been paid a fee. The information provided in the link is solely the creation of Sparkline Capital. Lead-Lag Publishing, LLC does not guarantee the accuracy or completeness of the information provided in the link or make any representation as to its quality. All statements and expressions provided in the link are the sole opinion of Sparkline Capital and Lead-Lag Publishing, LLC expressly disclaims any responsibility for action taken in connection with the information provided in the link.
Treasuries Are a Hedge Again. Credit and Oil Explain Why.
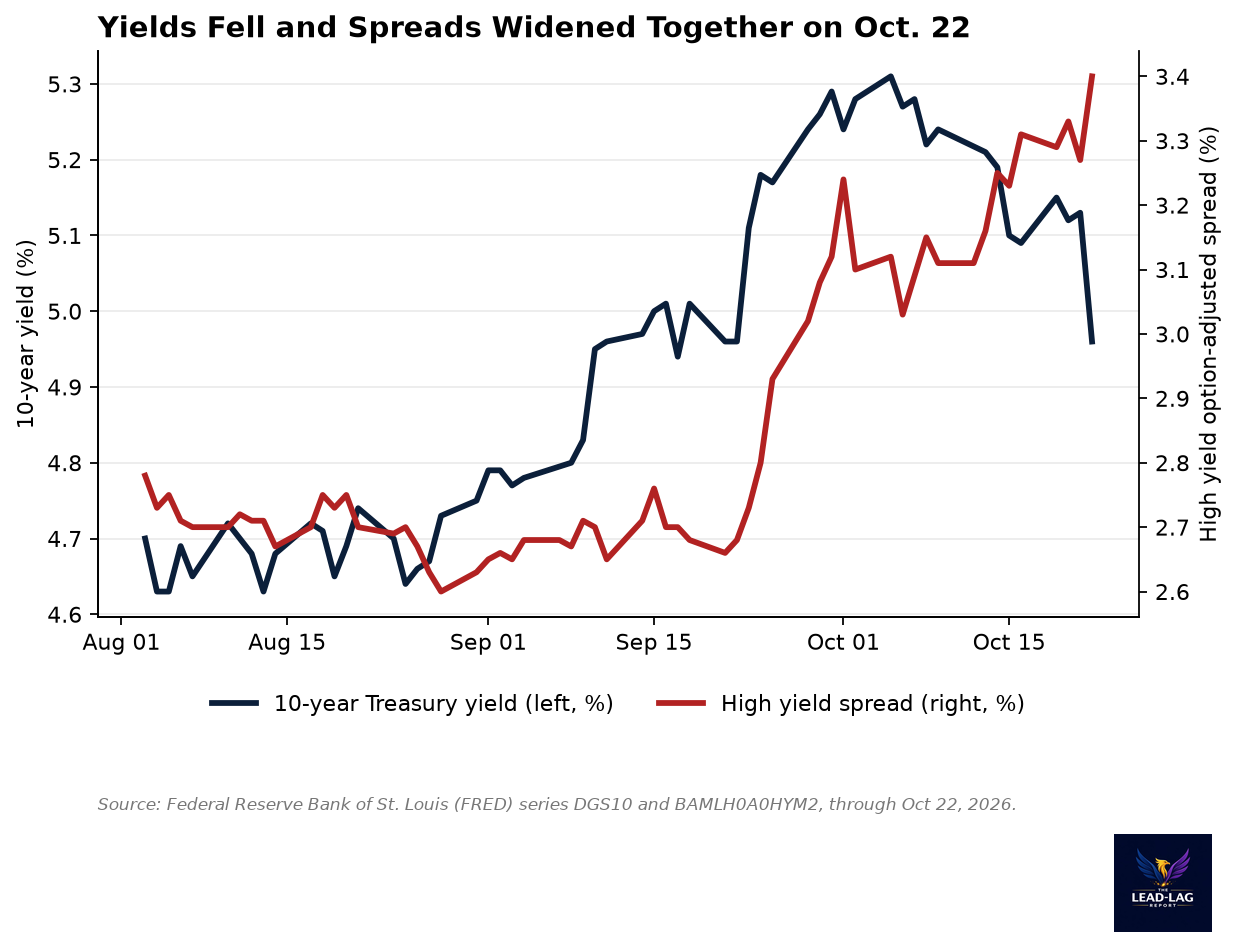
On October 22 the 10-year yield fell 17 basis points as the S&P 500 fell 1.2%, high yield spreads reached their widest since March, and Brent closed Friday at $116.72. The stock-bond correlation turned negative for the first time since July.
MICHAEL A. GAYED, CFA
Advisors near Stamford: I'm hosting a small, private dinner this Thursday, October 29, at 6:30 PM in Stamford, with Sal Gilbertie, CEO of Teucrium, and Jake Hanley. Dinner and drinks are on me. If you're an advisor in Fairfield or Westchester and would like a seat, email Wade Neimand on my team at wadeniemand@leadlagmedia.com and he will confirm.
On Thursday, October 22, the 10-year Treasury yield fell 17 basis points to 4.97% while the S&P 500 lost 1.2%. It was the biggest one-day drop in the 10-year yield since March 2023, and it happened on a day oil rose and high yield spreads hit their widest level since March.[1][2][3] Bonds are acting like a hedge again. That is a change, and it is the right moment to be precise about how much of a change it is.
Key Highlights
- The 10-year Treasury yield fell 17 basis points to 4.972% on October 22, its first close below 5% since September 23 and its largest one-day decline since March 10, 2023, as stocks sold off and Brent crude rose 4% to $113.17.[1]
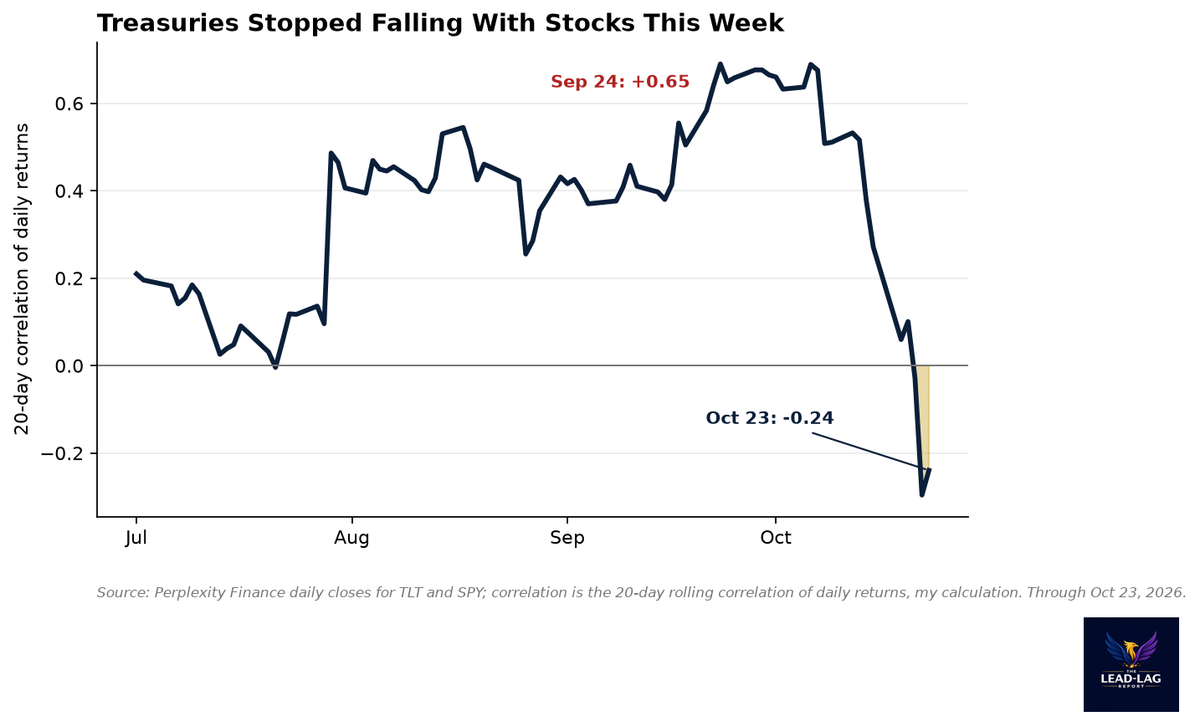
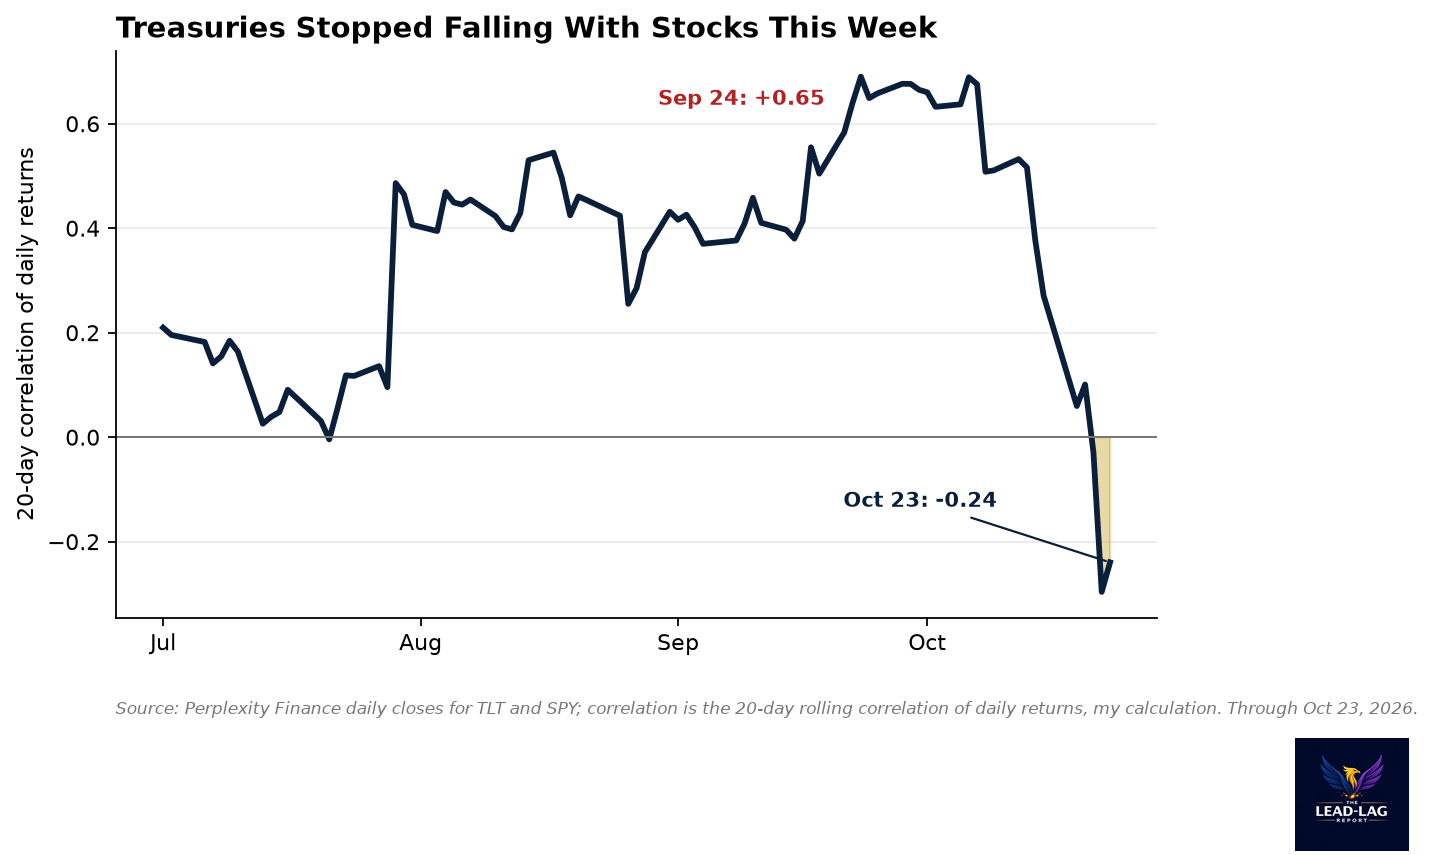
- The 20-day correlation between long Treasuries (TLT) and the S&P 500 (SPY) fell from +0.65 on September 24 to -0.24 on October 23, the first negative reading since July 21. TLT has gained 5.5% from its October 5 low.[4]
- The high yield spread reached 3.40% on October 22, 80 basis points above its August 28 low of 2.60% and the widest since March 30. The CCC spread reached 13.40%, up from 8.38% in January.[3]
- Brent settled at $116.72 on October 23, its highest since April 29 and more than 20% above the under-$97 level at the start of October.[5][6]
The Scoreboard
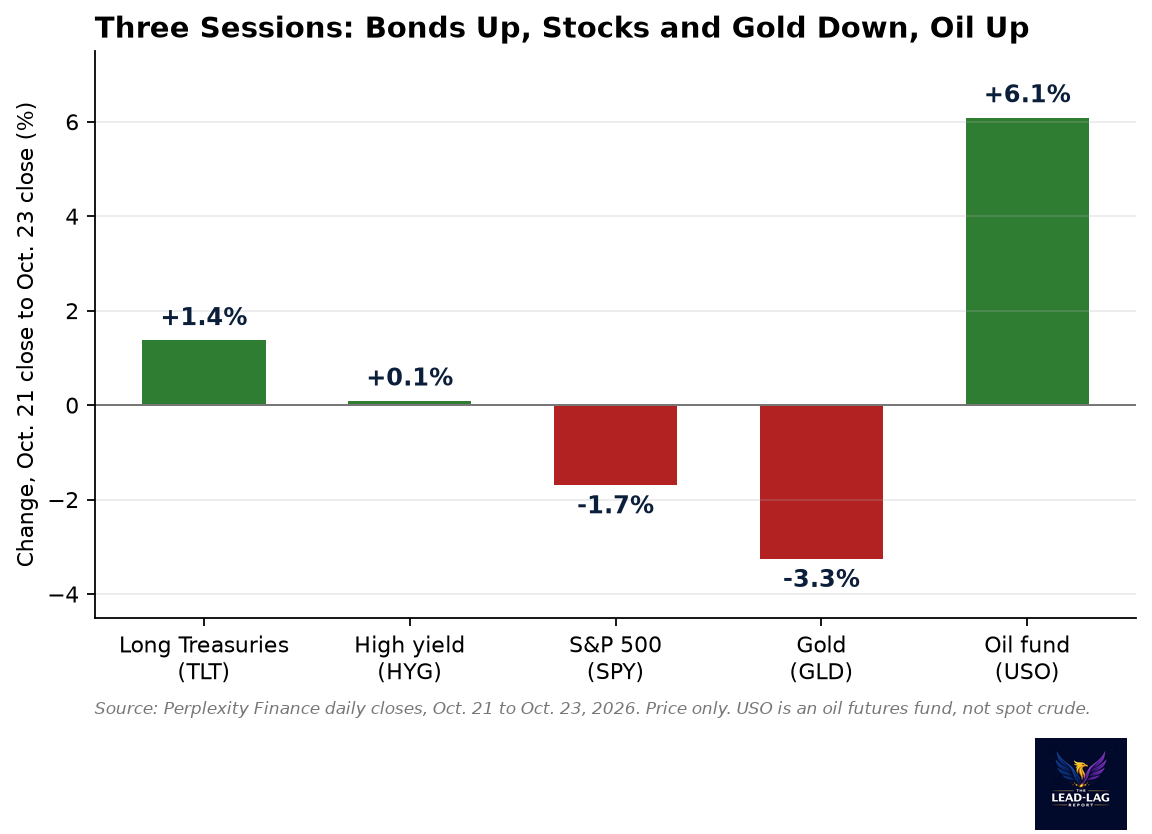
Look at the three sessions from the close on Wednesday, October 21 to the close on Friday, October 23. The long Treasury ETF (TLT) rose 1.4%. The S&P 500 ETF (SPY) fell 1.7%. The high yield ETF (HYG) was flat at +0.1%. The oil fund (USO) rose 6.1%, and the gold ETF (GLD) fell 3.3%.[4]
That mix is unusual. Oil rose, which in the last two months has been a reason to sell bonds. Stocks fell, which is a reason to buy them. Bonds rose. When the two forces collide, the market is telling you which one it fears more.
On Thursday it feared the second. The Bloomberg wrap said losses in equities "revived the haven status of Treasuries, overshadowing fears about inflationary pressures stemming from elevated energy costs."[2] Ian Lyngen at BMO Capital Markets said Treasuries had "emerged as a primary beneficiary as global risk sentiment has come under pressure."[7] The day was the best for Treasuries in more than a year, with yields falling by as much as 20 basis points on some maturities, the most since August 2025.[8]
The Hedge Is Back, For Now
For most of the summer, long Treasuries and stocks moved together. The 20-day correlation of their daily returns stayed positive through the summer and reached +0.65 on September 24.[4] That is the signature of an inflation shock. When prices rise because of energy and supply, bonds fall with stocks, and a 60/40 portfolio has nowhere to hide.
This week the correlation fell to -0.24. It was negative for the first time since July 21.[4] On October 22, TLT rose 1.9% on a day SPY fell 1.2%. Earlier selloffs of that size did not produce anything like it: on June 5, SPY lost 2.6% and TLT fell 0.5%, and on July 29 SPY lost 1.5% and TLT fell about 1.7%.[4]
I want to be careful. A 20-day correlation is a moving average. One extreme day can move it a long way, and October 22 was one extreme day, with the two prior down-days for stocks on October 14 and 16 supplying much of the rest. A single week does not rewrite a regime. What it does is raise the question of whether the regime that has governed since the summer, the one where the bond is the problem, has shifted to one where the bond is the shelter.
Why Oil Is Not Breaking The Bid
The simple story says higher oil means higher inflation, so yields should rise. That was the story for September, when the 10-year went from 4.75% at the end of August to 5.31% on October 5.[3] The October 22 data tell a different one.
The 10-year yield fell 17 basis points that day. The 10-year TIPS real yield fell 12 basis points, from 2.76% to 2.64%. The 10-year breakeven inflation rate fell 5 basis points, from 2.37% to 2.32%.[3] By my arithmetic about 70% of the move came from real yields, not inflation compensation. The bond market was not saying inflation had eased. It was saying growth had become the bigger risk.
Strategists said so directly. Rates strategist Kenneth Crompton of National Australia Bank noted that "even though oil has been slowly rallying, Treasuries have been feeling some safe haven flows again."[8] Bloomberg's account said the energy surge "is also being seen as another potential drag on growth."[8] The same oil that pushes headline inflation up taxes consumers and companies. At some price, the tax matters more than the inflation.
The oil move itself is not small. Brent rose from under $97 at the start of October to $116.72, a gain of more than 20%.[6][5] Houthi attacks on Saudi Arabia, a report that the U.S. and Israel are weighing renewed strikes on Iran after the midterm elections, and tanker freight rates at record levels all fed the move.[5][9][10] Adam Turnquist of LPL Financial said fears of supply disruptions drove the advance.[5]
Credit Is Not Buying The Calm
If this were only a bond rally, you could call it a rate story. Credit says it is something else.
The ICE BofA US High Yield spread was 3.40% on October 22. That is the widest since March 30, 80 basis points above the 2.60% low on August 28 and 37 basis points above the October 6 reading.[3] The CCC-rated spread, which measures the weakest issuers, hit 13.40%, up from 12.14% on October 6 and 8.38% in January.[3] The investment-grade spread widened to 0.89%, compared with 0.73% in January.[3] Each is still moderate in historical terms. All three are moving the wrong way at the same time as yields fall.
That combination is what a growth scare looks like. In a pure inflation scare, spreads can stay tight while yields rise. Here yields fell and spreads widened, which means investors are paying up for safety and charging more for risk.
Two stress points are visible. First, AI financing. Goldberg of ClientFirst Strategy said investors "are all of a sudden terrified of the amount of bond issuance by AI-related companies," and CNBC tied the stock selloff to concerns around the AI trade.[1] CNBC has named junk-rated CoreWeave as a poster child, with its stock down, its bond yields up and its credit default swap spreads wider.[11] Second, the weaker end of the high yield market, where CNBC wrote on October 9 that spreads had already widened to levels not seen since April.[12]
What The Duration Trade Is Saying
I do not make calls on whether to own an asset. I read what the pricing implies, and three things stand out.
First, the market has rediscovered duration as insurance. The 30-year yield fell from 5.67% on October 7 to 5.29% on October 22.[3] Long bonds returned 5.5% in under three weeks from the October 5 low (TLT, price only).[4] Bloomberg also noted that part of the surge came from traders covering short positions in Treasury futures.[8] Positioning contributed. So did fundamentals.
Second, this is a recession-hedge bid inside an inflation shock, which is a combination that is hard to hold. Oil at $116 is stagflationary. A bond rally at 4.97% is pricing slower growth. Both can be true for a few weeks. They cannot both be true for a year.
Third, the Federal Reserve is in the middle. It raised rates on September 17.[13] Bloomberg reported the bond rally reduced bets on another hike this year.[2] If the Fed hikes into an oil spike and an AI selloff, it adds to the growth scare. If it holds, it risks the inflation problem. Its next move arrives with the decision on October 28.[14]
What Would Change The Picture
The thesis has clear failure points. Here is what would tell me the old regime is back.
- The 10-year back above 5.2%. That would mean inflation fear has again overpowered the growth fear. The yield was 5.31% on October 5 and 5.13% on October 21.[3]
- Breakevens rising with oil. The 10-year breakeven has stayed in a narrow 2.32% to 2.37% range this week. A move toward 2.5% would say the inflation channel is winning.[3]
- A positive correlation again. If TLT falls on a day SPY falls, the hedge is gone.
- Spreads tightening. If high yield tightens back toward 3.0% while yields stay near 5%, the credit signal was noise.
The calendar gives the next test. The Federal Reserve decision is on October 28, and the first estimate of third-quarter GDP and the September inflation data from the personal consumption expenditures index arrive on October 29.[14][15] A hot print with oil above $110 is the setup in which bonds fall with stocks. A soft print is the setup in which this week's move extends.
Until then, the facts are plain. Long Treasuries rose while stocks fell. Credit spreads widened. Oil surged. The usual relationship between them broke in the direction a hedger would want. Whether it holds is the question for the next two weeks.
Few understand this.
— — —
Notes
- [1] 10-year yield move, record one-day drop since March 2023, oil settlements and AI issuance comments: CNBC, October 22, 2026.
- [2] S&P 500 and Nasdaq 100 moves, Treasury haven status, fading Fed hike bets, spot gold: Bloomberg markets wrap via Swissinfo, October 22, 2026.
- [3] Treasury yields, TIPS real yield, breakevens and ICE BofA credit spreads (series DGS10, DGS30, DFII10, T10YIE, BAMLH0A0HYM2, BAMLH0A3HYC, BAMLC0A0CM): Federal Reserve Bank of St. Louis (FRED).
- [4] Daily closes and returns for TLT, SPY, HYG, USO, GLD, GDX, SLV and UUP; correlations are my calculations: Perplexity Finance.
- [5] Brent settlement of $116.72 on October 23, highest since April 29, and Adam Turnquist comment: Reuters via Central Oregon Daily, October 23, 2026.
- [6] Brent from under $97 at the start of October; about three of four S&P 500 stocks fell: Associated Press, October 23, 2026.
- [7] Ian Lyngen of BMO Capital Markets on Treasuries as a beneficiary of risk aversion: Bloomberg markets wrap via Swissinfo, October 22, 2026 (afternoon edition).
- [8] Best Treasury day in over a year, yields down up to 20 basis points, short covering, Kenneth Crompton quote, energy as a growth drag: Bloomberg via The Straits Times, October 22, 2026.
- [9] Report that the U.S. and Israel are weighing strikes on Iran after the midterms: Briefs, Treasuries rally as stocks sell off and oil jumps.
- [10] Record tanker freight rates and Brent above $115: TradingKey, Brent crude breaks $115.
- [11] CoreWeave as the poster child of AI credit stress: CNBC, October 21, 2026.
- [12] Junk bond spreads widening to levels not seen since April: CNBC, October 9, 2026.
- [13] Effective federal funds rate, 3.63% rising to 3.88% on September 17: FRED series DFF.
- [14] FOMC meeting calendar, decision on October 28: Federal Reserve Board.
- [15] Release schedule, GDP and personal income and outlays on October 29: Bureau of Economic Analysis.