
What Consumer Credit Says About Corporate Defaults
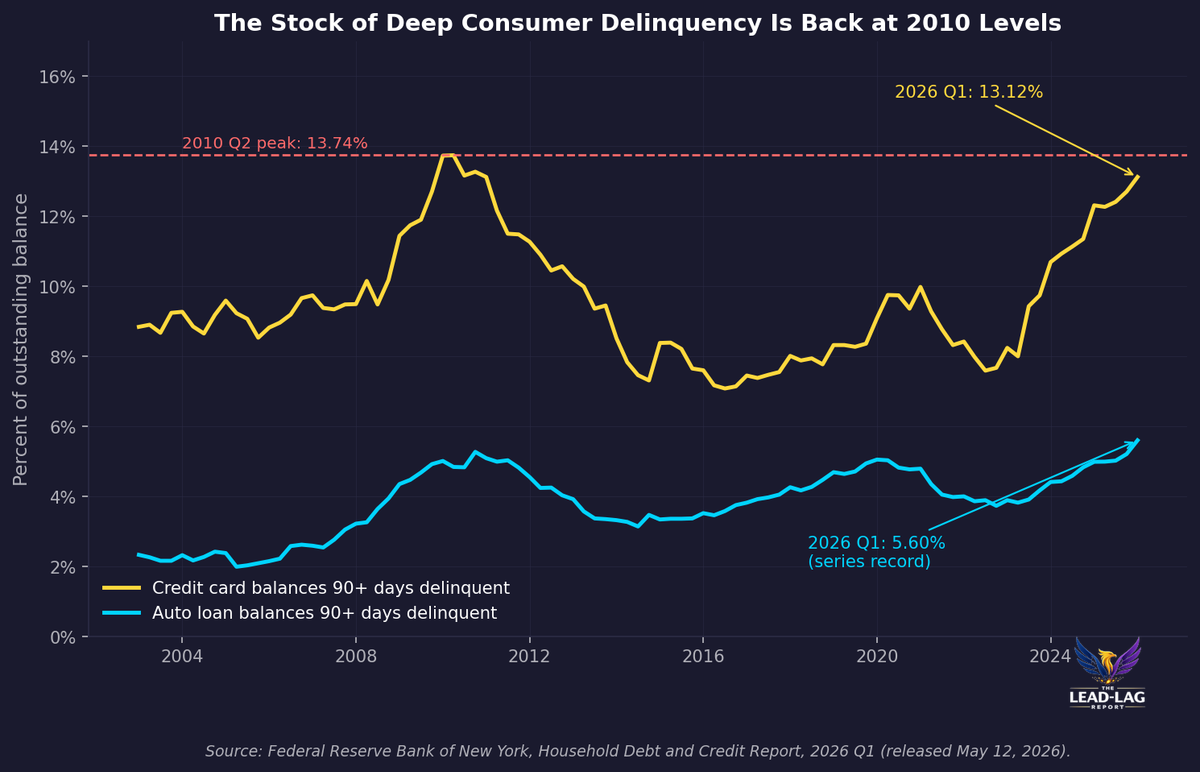
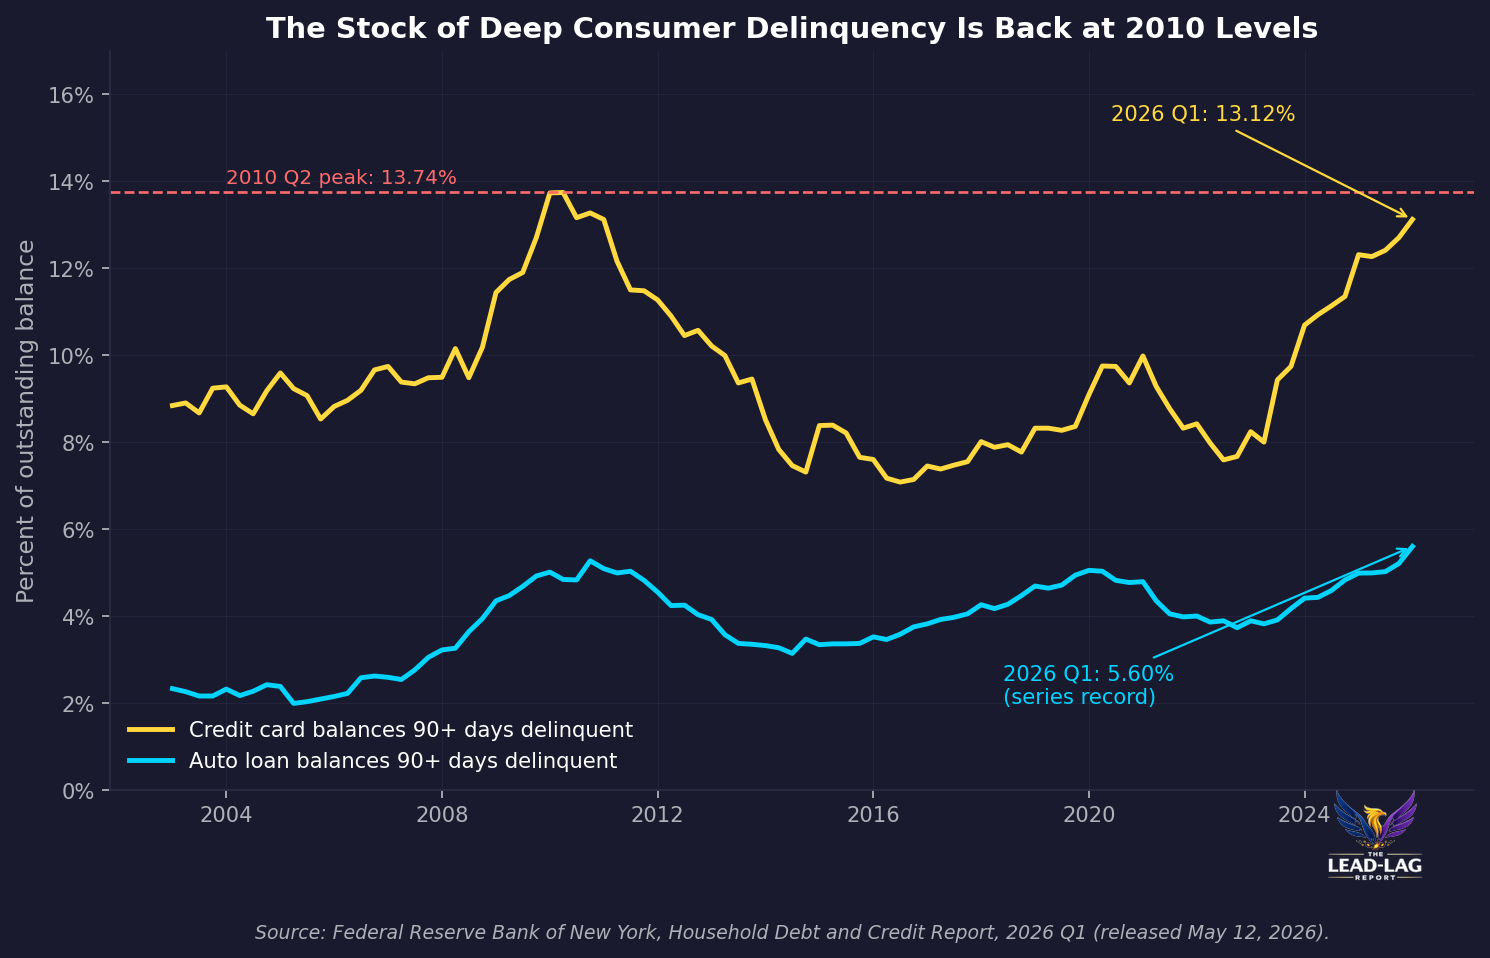
Credit card balances 90+ days delinquent hit 13.12 percent in Q1 2026, closing in on the 13.74 percent 2010 record. Auto loans are already at a series-record 5.60 percent. High yield spreads are at 287 basis points. The household ledger has already turned. Corporate credit is still pricing the calm.

Today’s Lead-Lag Report post is sponsored by Teucrium

Everyone diversified into gold. Agriculture got skipped. Agricultural commodity ETFs hold roughly 0.01% of all ETF assets — about $1 in every $10,000. Meanwhile the fundamentals have been shifting, and Teucrium has mapped where they believe the setup is right now.
What We’ll Cover
The gold trade is priced in. The next portfolio diversifier may already be sitting in plain sight. Here is where the ag setup stands today:
- Positioning gap. Agricultural commodity ETFs are ~0.01% of all ETF AUM. Nobody owns agriculture. That is the opportunity.
- Fundamentals. Grain prices have spent 2 years below most published cost-of-production estimates. The July WASDE cut global wheat and corn ending stocks. The August WASDE (released today) delivered a survey-based corn yield below trend.
- Wheat catalyst. Wheat just showed what this setup can do when a catalyst hits. Jake will walk through what happened and what it implies for the rest of the complex.
- Correlation. Agriculture has shown low historical correlation to US stocks and bonds — a diversification profile advisors have quietly been reconsidering after 2022 correlated everything.
- Structure. Futures-based ETF structures behave differently than equity ETFs — Jake will unpack roll dynamics, storage costs, and what advisors need to understand about sizing an ag sleeve.
This session is geared toward financial advisors. Time will be held for Q&A.
About the Panelists
Michael A. Gayed, CFA, Publisher of The Lead-Lag Report, Founder of Lead-Lag Media — Portfolio manager, CFA charterholder, four-time Dow Award winner, and publisher of one of the largest independent financial newsletters on Substack. Host of Lead-Lag Live.
Jake Hanley, Managing Director and Senior Portfolio Strategist, Teucrium — Leads Teucrium’s portfolio strategy for the firm’s suite of agricultural commodity ETFs (CORN, WEAT, SOYB, CANE, TILL), with a career focused on educating advisors on how ag exposure fits inside diversified portfolios.
Sponsored by Teucrium.
Any references to specific commodities, ETFs, or investment strategies are provided for informational and educational purposes only and should not be considered personalized investment recommendations. Investors are responsible for conducting their own due diligence and determining whether any investment is appropriate for their individual needs. Investing involves risk, including the potential loss of principal. Commodity investments and futures-based ETFs carry additional risks including roll costs, storage costs, and heightened volatility relative to broad-market equity products. Past performance and referenced securities are not indicative of future results, and no guarantee of performance is expressed or implied.
DISCLAIMER — PLEASE READ: This content is sponsored by Teucrium Trading, LLC. Lead-Lag Publishing, LLC receives compensation for producing and distributing this webinar. All views expressed are those of the panelists and Teucrium Trading, LLC. This is not investment advice. Investing involves risk, including possible loss of principal. Lead-Lag Publishing, LLC does not guarantee the accuracy or completeness of the information provided and expressly disclaims any responsibility for action taken in connection with this content.
The consensus position on credit in mid-2026 is tidy. The consumer is bruised but intact, aggregate delinquency is back to something like its pre-pandemic normal, and the real risk sits in corporate balance sheets, where the maturity wall, private credit opacity, and leveraged loan stress supply the plot. Watch the companies, the argument goes, not the households.
That sequencing is backwards. The household ledger is not the thing that breaks after corporate credit breaks. It is the thing that moves first, and in this cycle it has already moved. What the market is calling consumer resilience is a set of averages that has stopped rising while the composition underneath keeps deteriorating.
The Consensus Is Reading the Averages
The New York Fed's Q1 2026 Household Debt and Credit Report gave the resilience camp its talking points. Total household debt rose 0.1% to $18.79 trillion. Credit card balances actually fell $25 billion to $1.25 trillion. Aggregate delinquency was little changed at 4.8% of outstanding debt, and card transitions into early delinquency ticked down from 8.7% to 8.6% annualized.[1] The Federal Reserve's own H.8 series tells a similar story: the credit card delinquency rate at commercial banks was 2.92% in Q1 2026, down from a 3.22% cycle peak in Q2 2024 and lower for a seventh consecutive quarter.[2]
Corporate credit gets the opposite treatment. Moody's has the average one-year expected default probability for US high yield companies at 3.2%, down from a year earlier, and expects US speculative-grade defaults to fall to roughly 3.0% by October 2026 from 5.3% a year prior.[3] So the narrative writes itself: consumer stress is peaking, corporate stress is the live question, and the two are separate stories.
None of this is a forecast in dispute. The numbers are published and the direction of the averages is real. The problem is what an average conceals when the distribution behind it is pulling apart.
The Stock Is at 2010 Levels Even as the Flow Cools
Flow measures capture who is newly falling behind. Stock measures capture how many are already deep in the hole. The two have separated violently. The share of credit card balances 90 or more days delinquent reached 13.12% in Q1 2026 against a Great Recession peak of 13.74% in Q2 2010, and above the 13.16% recorded in Q3 2010. Auto loan balances 90 or more days delinquent reached 5.60%, the highest in a series that begins in 2003, exceeding the 5.27% posted in Q4 2010. Student loan balances 90 or more days delinquent rose to 10.3% from 9.6%.[4]
The Philadelphia Fed examined exactly this divergence in April and found the mechanism. The rise in severe auto delinquency is not being driven by a growing inflow of newly distressed borrowers, which has been roughly stable for three years. It is being driven by a collapse in the exit rate: delinquent accounts are persisting longer before they cure, charge off, or get repossessed.[5] That distinction matters more than it sounds. A stable inflow with a falling cure rate is not a healing consumer. It is a consumer who cannot dig out, sitting on a lender's books, waiting to become a realized loss.
The Subprime Tell
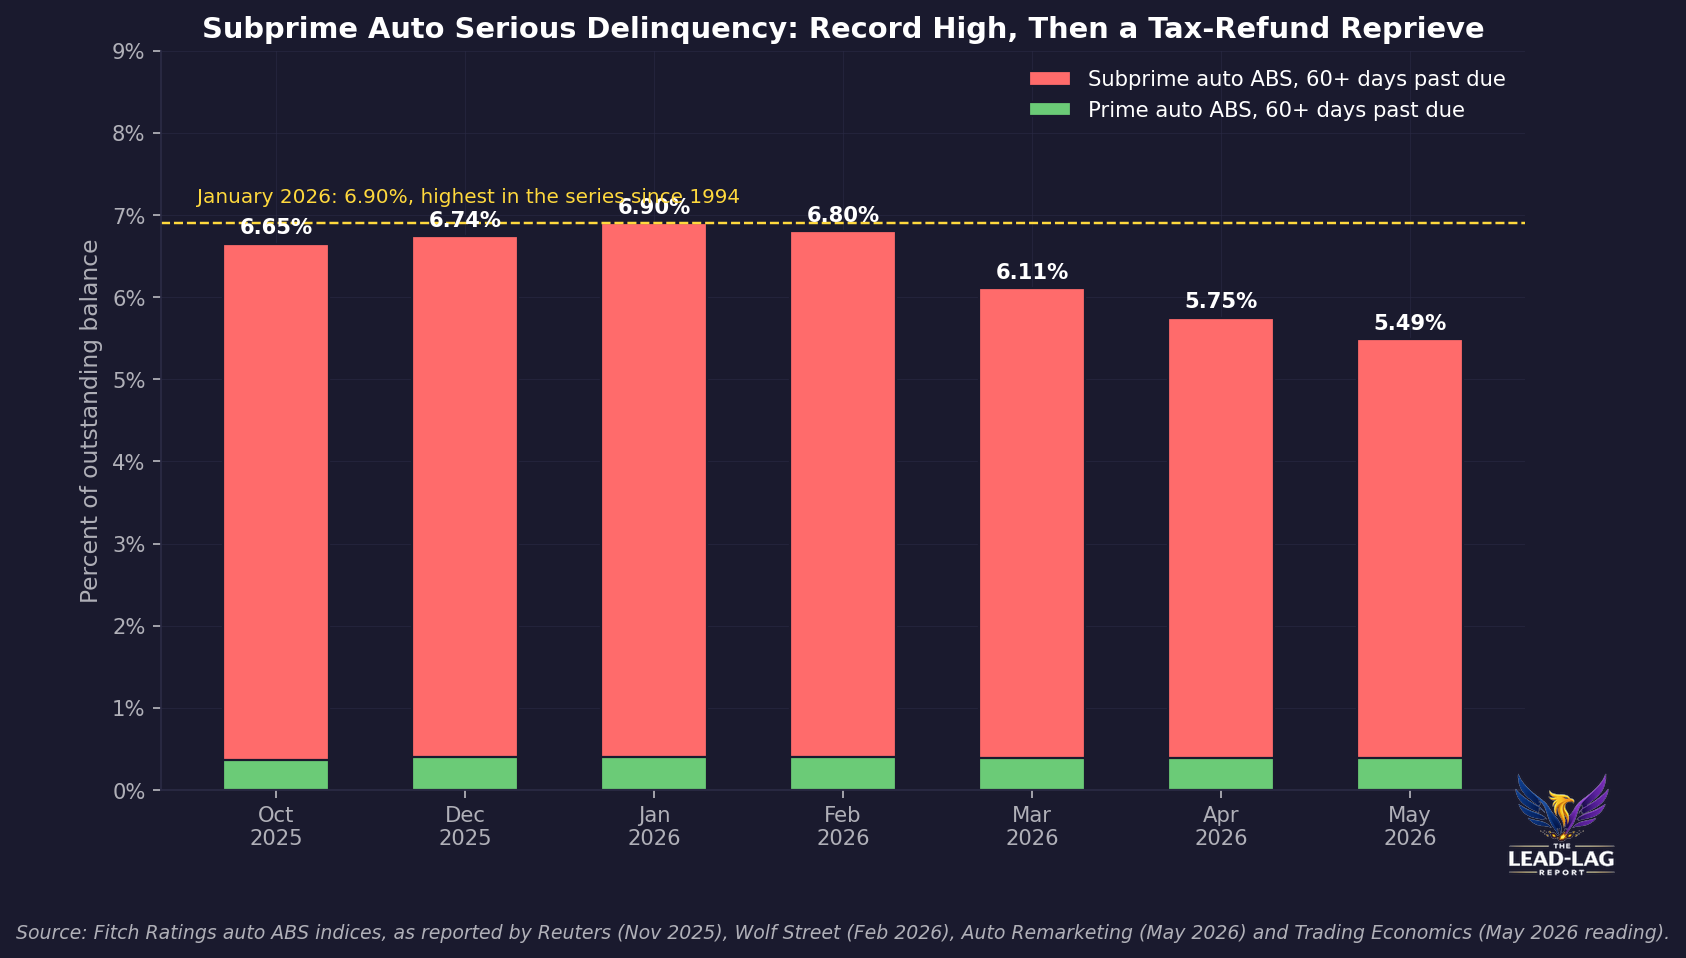
The clearest read is in securitized auto paper, where the data is monthly rather than quarterly. Fitch's subprime auto ABS 60-plus-day delinquency index hit 6.90% in January 2026, the highest reading in a series that starts in 1994, above the 6.65% recorded in October 2025 and above anything printed during 2008 and 2009.[6] Annualized net losses on the same index reached 9.81%, with the trailing twelve-month average at 9.00%, a post-pandemic high.[7]
Tax refund season then did what tax refund season does. Delinquency eased to 6.11% in March, 5.75% in April, and 5.49% in May, the lowest since May 2024.[8] Fitch's own read on that improvement was that it is expected to be short lived, given elevated living costs, high debt servicing burdens, and a cooling labor market.[7] Meanwhile prime auto ABS delinquency sat at roughly 0.39%, essentially unchanged for years, leaving a subprime-to-prime ratio of about 14 to 1.[6]
This is the bifurcation that the aggregate 4.8% delinquency figure launders away. One tier of the consumer is levered, delinquent at generational extremes, and dependent on a seasonal refund to make progress. The other tier is fine. Aggregate resilience is a weighted average of a healthy majority and a distressed minority, and credit cycles are not decided by the majority.
The Lead Time Is Real, and It Is Short
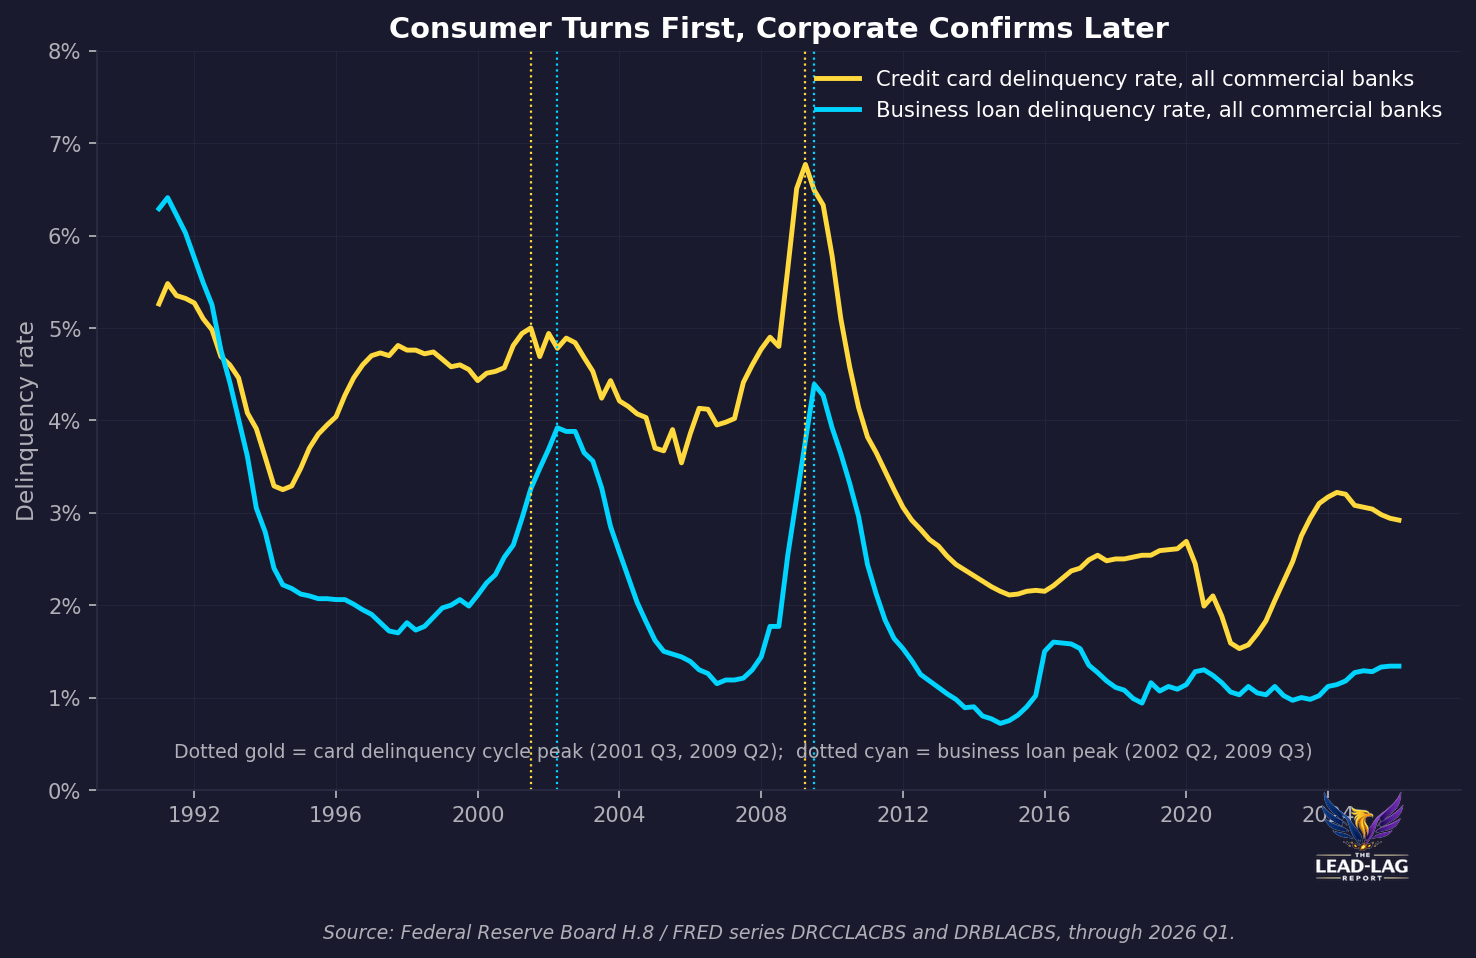
The reason any of this matters for corporate credit is sequencing. Run the two Federal Reserve delinquency series against each other, credit cards for the household and business loans for the corporate, from 1991 to today. Card delinquency peaked in Q3 2001; business loan delinquency peaked in Q2 2002, three quarters later. Card delinquency peaked in Q2 2009; business loan delinquency peaked in Q3 2009, one quarter later. On the way down, card delinquency troughed in Q4 2005 and business loans troughed in Q4 2006.[2][9]
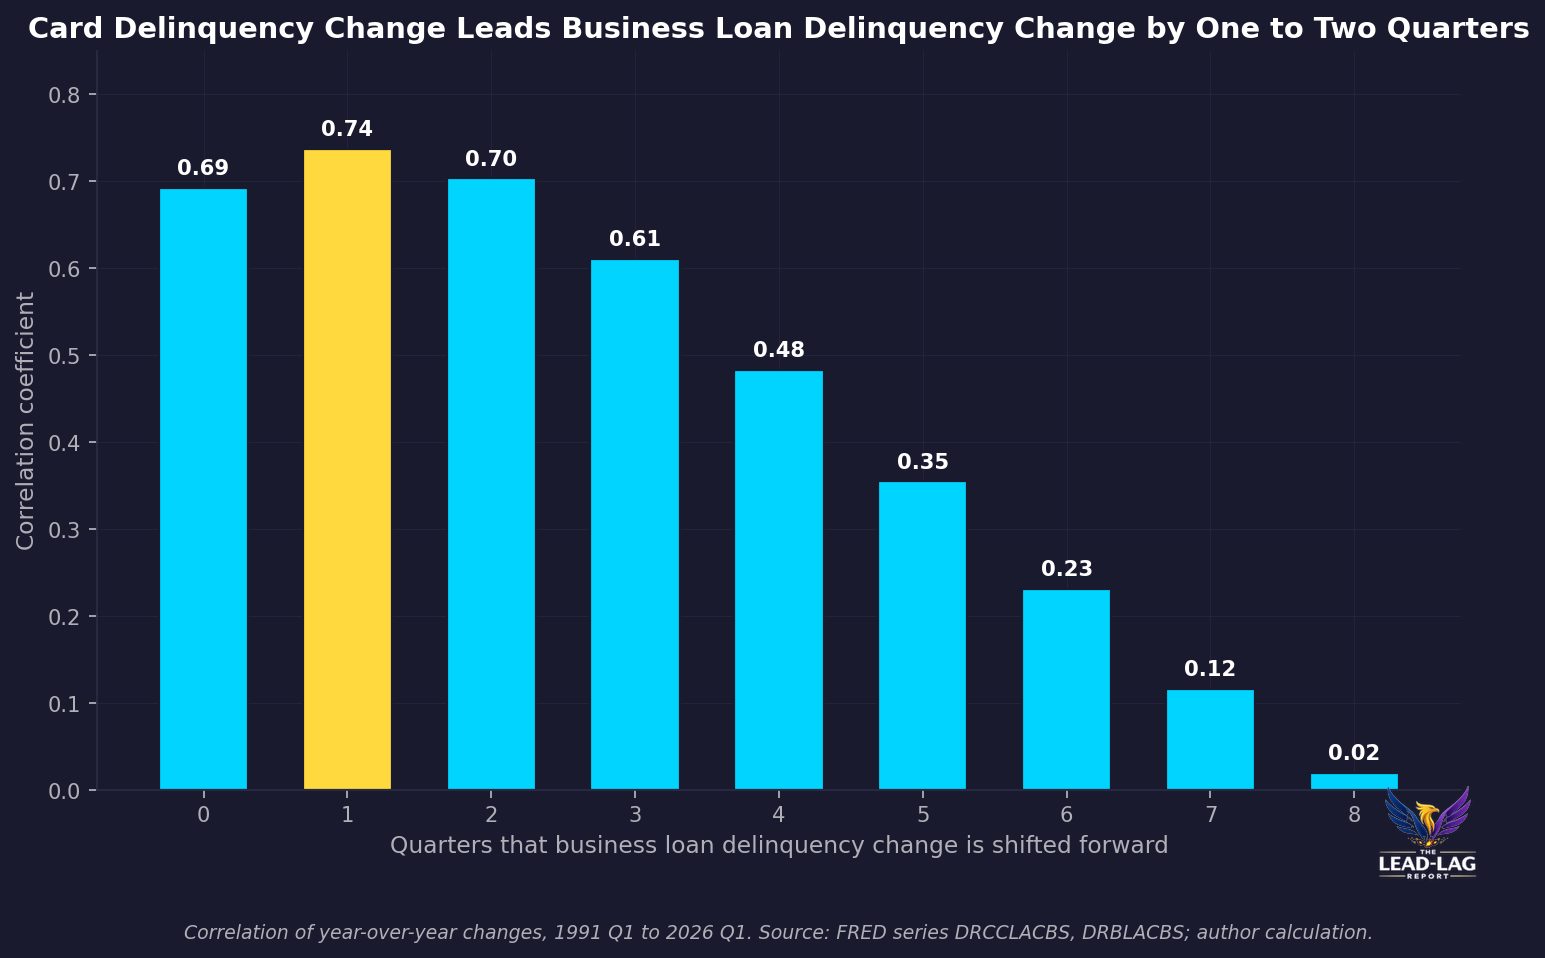
Cross-correlating year-over-year changes in the two series over 141 quarters puts the peak relationship at a one-quarter lead, 0.74, against 0.69 contemporaneously and 0.70 at two quarters. By four quarters the relationship halves to 0.48, and by seven quarters it is noise at 0.12.[10] The popular version of this claim is that consumer stress leads corporate defaults by six to nine months. The data supports the direction and roughly the magnitude, with the honest version being one to three quarters rather than a fixed nine-month clock. That is a narrow window. It is not enough time to reposition after the corporate data confirms.
The Corporate Side Has Already Started
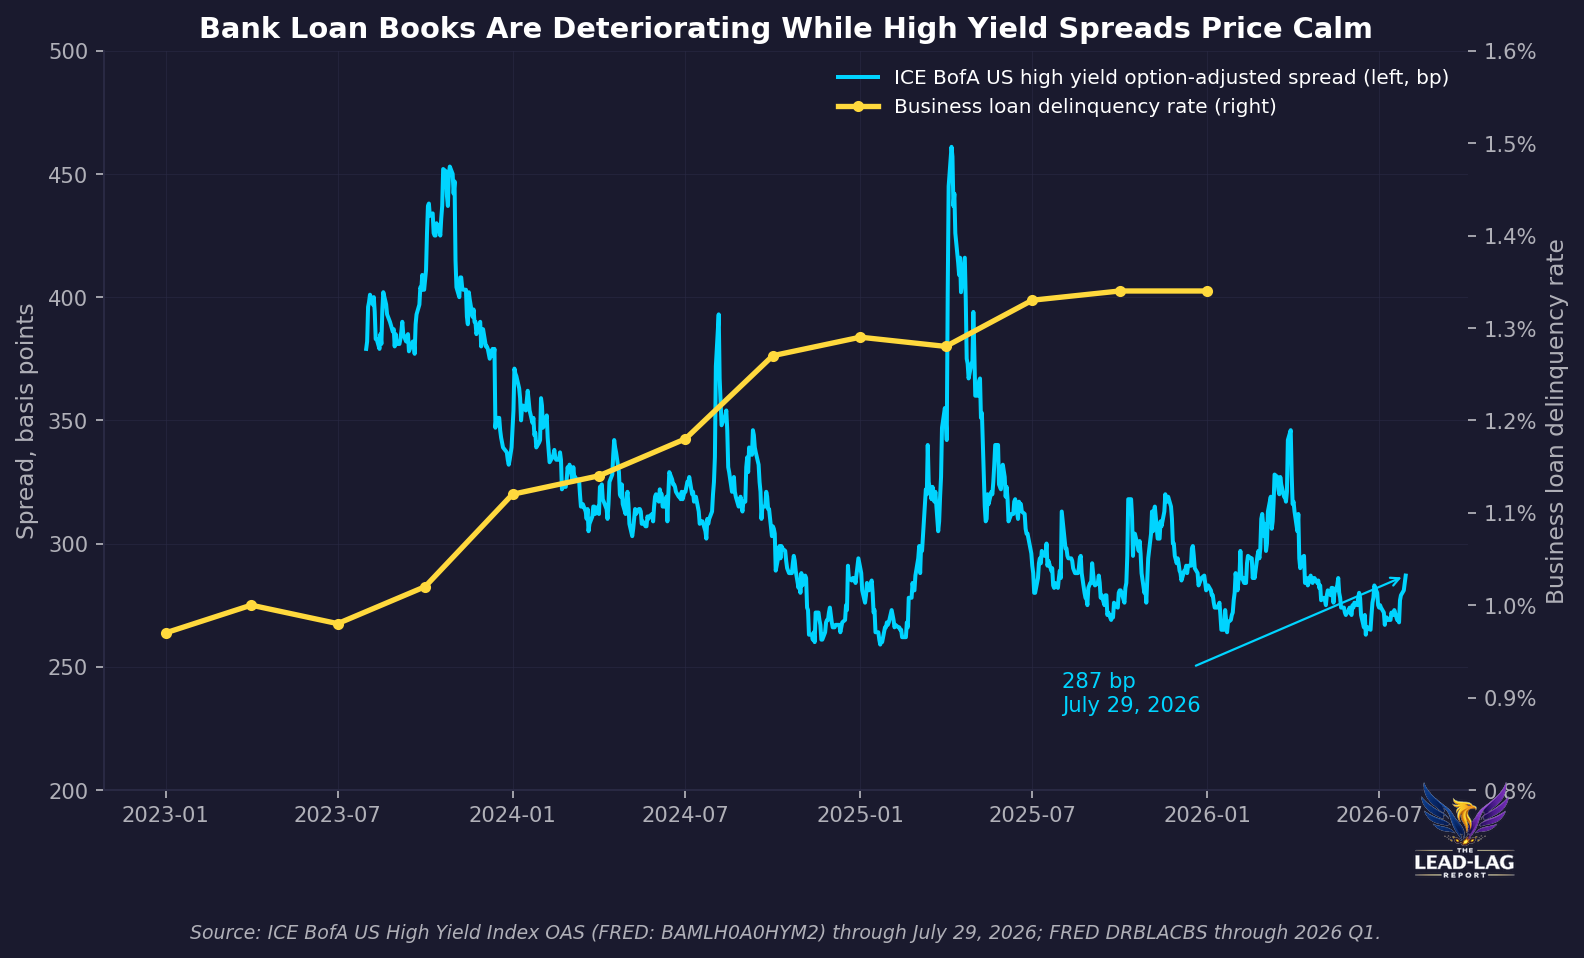
Which brings up the part of the picture the resilience narrative skips. Business loan delinquency at commercial banks bottomed at 0.97% in Q1 2023 and has ground up to 1.34% as of Q1 2026, twelve quarters of gradual deterioration rather than a spike.[9] Leveraged loan defaults have been running near 7%, roughly double their long-run average, and Moody's baseline places GDP growth around 1.5%, just above the stall speed below which defaults tend to accelerate.[3]
High yield spreads are pricing none of it. The ICE BofA US high yield option-adjusted spread closed at 287 basis points on July 29, within 30 basis points of the cycle tight of 259 basis points set in January 2025.[11] A market that has correctly identified corporate credit as the risk to watch is not compensating anyone for watching it. That is the asymmetry: the consensus diagnosis and the consensus positioning contradict each other.
Regime, Not Forecast
The regime read is straightforward. If the deep stock of household delinquency is at 2010 levels while the flow is merely flat, and if the historical lead from household stress to corporate loan stress is one to three quarters, then the corporate default cycle is not a distant risk to be monitored. It is the lagging confirmation of something already visible in the household data, arriving into a spread market priced for the opposite. Exposure that assumes credit spreads compensate for late-cycle consumer bifurcation is exposure to a mispriced sequence, not to a mispriced level.
The honest falsification condition is specific. If the subprime auto 60-plus-day rate keeps easing through the second half of 2026 rather than resuming its seasonal climb into December and January, if the credit card 90-plus share turns lower from 13.12% rather than through the 2010 high, and if business loan delinquency stalls near 1.3% instead of continuing its twelve-quarter grind, then the lead-lag read fails and the resilience camp was right. Those are three observable series with monthly and quarterly release dates, not a matter of interpretation.
Until then, the sequence stands. Households are not the epilogue of this credit cycle. They are the first chapter, and the market is still reading the averages.
The consumer did not avoid the credit cycle. The consumer started it, and the corporate default data is the part that arrives late.
Few understand this.
Notes
- Federal Reserve Bank of New York, "Household Debt Balances Rise Slightly as Delinquency Transitions Show Little Change," Quarterly Report on Household Debt and Credit, 2026 Q1, released May 12, 2026. newyorkfed.org
- Federal Reserve Board H.8, Delinquency Rate on Credit Card Loans, All Commercial Banks. FRED: DRCCLACBS
- Moody's, "Default rates are easing. Credit risk is fragmented and concentrated," April 28, 2026, and "Global leveraged finance and CLOs outlooks 2026," November 20, 2025. moodys.com, moodys.com
- New York Fed Consumer Credit Panel / Equifax, Household Debt and Credit Report 2026 Q1 data workbook, "Percent of Balance 90+ Days Delinquent by Loan Type." HHD_C_Report_2026Q1.xlsx
- Federal Reserve Bank of Philadelphia, Consumer Finance Institute, "Do Recent Auto Loan Delinquency Rates Overstate Borrower Distress?", April 2026. philadelphiafed.org
- Fitch Ratings auto ABS indices via Wolf Street, February 17, 2026, and Reuters, November 12, 2025. wolfstreet.com, reuters.com
- Auto Remarketing, "Fitch: Stress in subprime surfaces through auto ABS trends," May 21, 2026. autoremarketing.com
- Fitch Auto ABS indices via Trading Economics, United States Car Loan Delinquency. tradingeconomics.com
- Federal Reserve Board H.8, Delinquency Rate on Business Loans, All Commercial Banks. FRED: DRBLACBS
- Author calculation: Pearson correlation of year-over-year changes in DRCCLACBS and DRBLACBS, 1991 Q1 through 2026 Q1, 141 observations, business loan series shifted forward zero to eight quarters.
- ICE BofA US High Yield Index Option-Adjusted Spread. FRED: BAMLH0A0HYM2



