
The Full Risk-On Stack
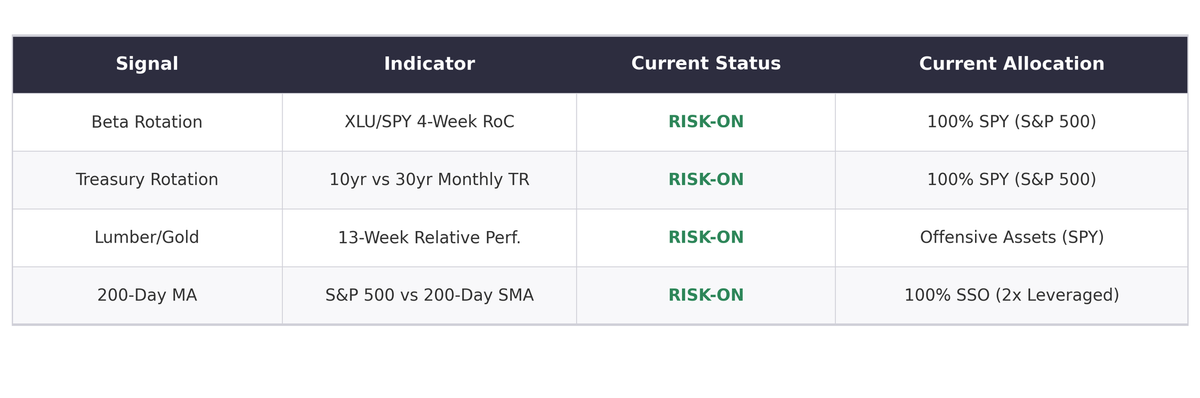
Every intermarket signal stays on offense. Trend, rotation, commodities, and Treasury behavior remain unanimously aligned with risk.

This Lead-Lag Report post is sponsored by Tuttle Capital Management

Every AI narrative of the last two years has been about the model. The next one is about what's standing in its way — and Tuttle Capital has mapped exactly where we believe the constraints are right now.
What We'll Cover
The GPU bottleneck is priced in — its window closed after roughly a 1,200% run and three years of consensus catching up. Here's where the AI bottlenecks are now.
- Memory (2023–today): High-Bandwidth Memory is the choke point behind every AI inference call. DRAM exports are up 265% year-on-year at cycle peak. Mid-stage — the supercycle is still running.
- Photonics (2025–present): Copper physically cannot move data at the speed 100,000-GPU clusters require. Hyperscalers have reportedly locked up 1.6T transceiver supply through 2028. Early stage — the window is open now.
- Space (2025–2035+): Terrestrial power and bandwidth are hitting structural limits — U.S. grid interconnection queues now stretch a median of five years. Blue Origin has filed with the FCC for up to 51,600 satellites; Google has its own space-based compute research underway. Emerging — the enabling layers monetize first.
But what's next? That's what we'll be discussing.
About the Panelists
- Matt Tuttle, CEO & Portfolio Manager, Tuttle Capital Management — 44 years as a trader and investor, architect of TCM's fully transparent, actively managed ETF lineup (~$4.5B AUM).
- Frances Newton, Chief Investment Officer, Tuttle Wealth Partners — extensive experience analyzing monetary policy and national media commentator (Bloomberg, Fox Business, CBS, Yahoo Finance); policy advisor to the Bank of England.
- Dave Pankiw, Partner, CUBIC Advisors — 40 years in the investment business, flat-fee retirement planning specialist, contributor to the Journal of Personal Finance and Marketwatch.com.
Sponsored by Tuttle Capital Management
Any stock references are provided for informational purposes only and should not be considered personalized investment recommendations. Investors are responsible for conducting their own due diligence and determining whether any investment is appropriate for their individual needs. Investing involves risk and investors must be prepared to bear potential losses, including the loss of principal. Past performance and referenced securities are not indicative of future results, and no guarantee of performance is expressed or implied.
Disclaimer: This content is sponsored by Tuttle Capital Management. Lead-Lag Media receives compensation for producing and distributing this webinar. All views expressed are those of the panelists and Tuttle Capital Management, LLC (SEC-Registered Investment Adviser; Distributor: Foreside Fund Services, LLC). This is not investment advice. Investing involves risk, including possible loss of principal.
By Michael A. Gayed, CFA · Week Ending August 7, 2026
This Week at a Glance
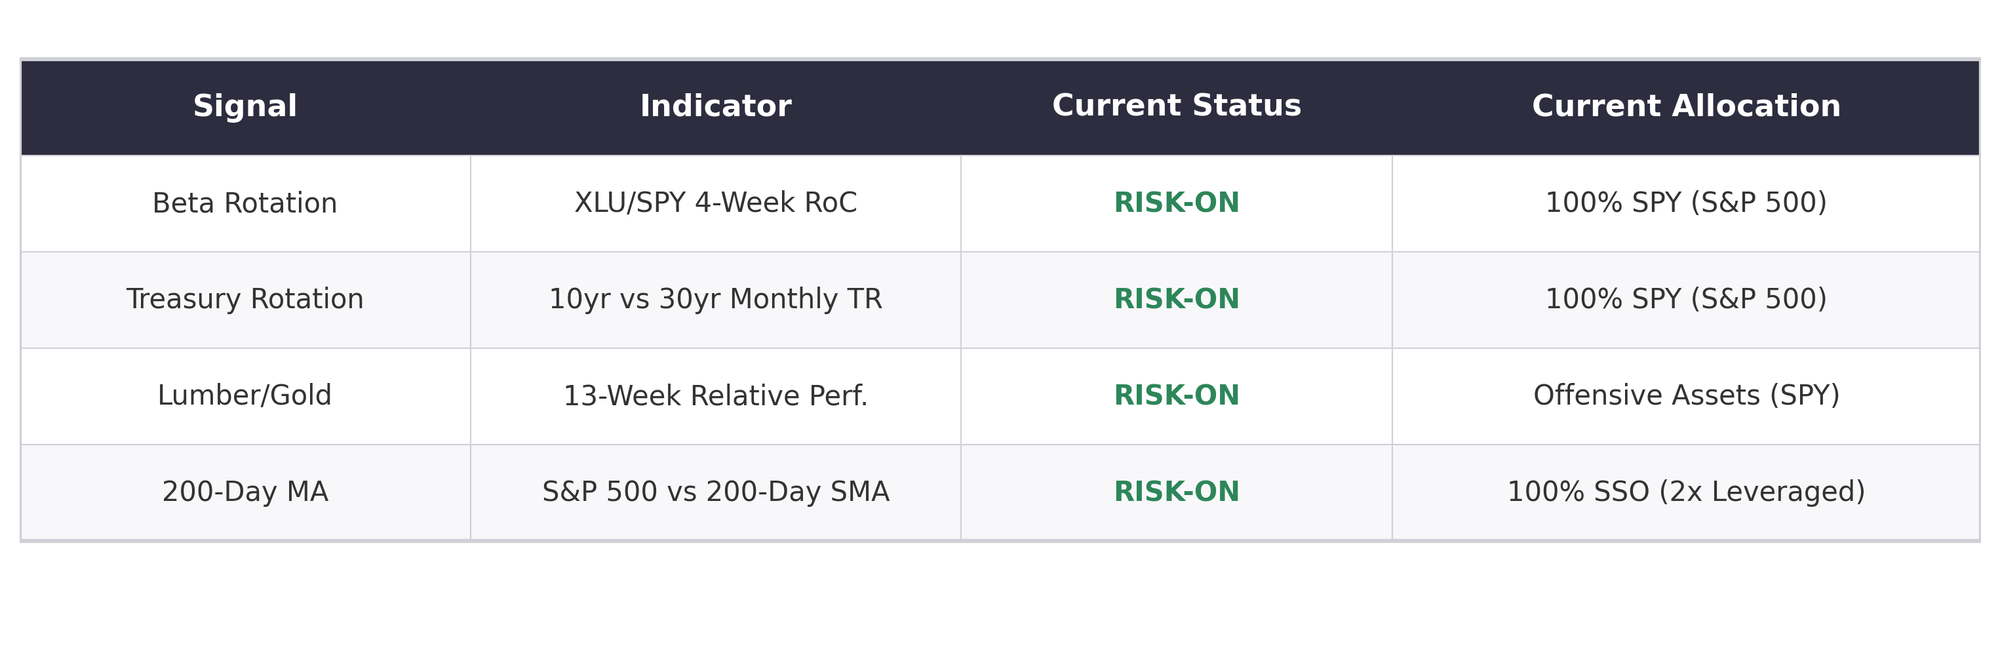
Composite Reading: Strong Risk-On (+85 on a -100/+100 conviction-weighted scale)
4-of-4 Risk-On · 0-of-4 Risk-Off
Key Highlights
- Signal 1 (Beta Rotation) remains Risk-On with the XLU/SPY 4-week RoC at -6.24%. The S&P 500 continues to outperform Utilities, signaling that risk appetite still favors broad equity over defensive sectors. The allocation remains 100% SPY.
- Signal 2 (Treasury Rotation) is Risk-On on the latest May month-end reading. TLT returned -4.83% in May versus IEF at -1.71%. Long-duration bonds underperformed intermediate maturities, a classic risk-appetite indicator. The current allocation tilts toward SPY (S&P 500).
- Signal 3 (Lumber/Gold) is Risk-On on the latest 13-week relative-performance reading. Lumber's 13-week return of -0.17% exceeds gold's -7.93%. All seven sub-strategies are positioned offensively, with cyclical exposures favored over defensive bond pairs.
- The S&P 500 at 7,732.6 sits +10.0% above its 200-day SMA of 7,029.71. Signal 4 remains Risk-On, with the allocation set to SSO (2x leveraged S&P 500). Trend remains intact even after Thursday’s broad equity selloff.
Market Commentary
The framework reads 4-0 Risk-On this week. 4 of four signals favor risk-on positioning and 0 signals flag defense. The S&P 500 closed at 7,732.6 on August 7, 2026, +10.0% above its 200-day moving average of 7,029.71.
The week ending August 7, 2026 closed with the S&P 500 at 7,732.6. The index continues to sit above its 200-day moving average, keeping the trend structure intact that has framed the year to date. Beneath the headline price action, broad equity continues to lead defensive sectors, and intermediate Treasuries outperformed long bonds, a risk-appetite signature. Earnings season has wound down with broadly stable forward guidance, and macro data continues to trace a soft-landing path, but valuations, positioning, and concentration risk all argue for tactical respect of the framework's defensive readings.
At 7,732.6, the index sits +10.0% above its 200-day SMA of 7,029.71. That spread is comfortable enough to keep Signal 4 on the offensive 2x leveraged allocation. The technical setup remains constructive in the aggregate — price above a rising 200-day — but the divergence between the trend signal and the defensive signals is the kind of split that historically precedes either a pause in the trend or a stronger rotation into defense.
The Beta Rotation signal is Risk-On with the XLU/SPY 4-week Rate of Change at -6.24%. Utilities continue to underperform the broad market over the trailing four weeks, with the negative RoC reflecting persistent flows out of defensive equity sectors. The framework’s allocation stays on SPY.
The Treasury Rotation signal is Risk-On on the latest May month-end reading. TLT returned -4.83% in May versus IEF at -1.71%, with the intermediate maturity outperforming long-duration — a risk-appetite signature. The signal will hold this May reading through the end of June.
The Lumber/Gold signal is Risk-On on the latest 13-week reading. Lumber's 13-week return of -0.17% exceeds gold's -7.93%. All seven Lumber/Gold sub-strategies are positioned offensively, with cyclical and growth-tilted pairs favored over defensive bond pairs. Lumber has held its bid as housing demand expectations firm, while gold has paused its rally near record levels. The relative dynamic stays Risk-On but the spread has narrowed week-over-week, and a re-acceleration in gold would flip the signal quickly.
The 4-0 Risk-On reading sits in the middle of the framework’s distribution. Mixed readings often precede broader pivots in either direction — either the defensive signals reconverge to risk-on, or the risk-on signals follow defense lower. The current setup demands tactical respect: maintain offensive allocations where signals call for them, recognize defensive allocations where they apply, and treat the disagreement among indicators as meaningful. The risks worth watching are a flip of the Treasury Rotation signal back to defensive, a flip of the Beta Rotation signal, equity selloffs that compress the cushion above the 200-day, or a flip of the Lumber/Gold spread back to gold-favored.
Signal 1: Beta Rotation
Based on: "An Intermarket Approach to Beta Rotation: The Strategy, Signal, and Power of Utilities" (SSRN 2417974)
Target Investor: Self-directed investors who want to capture relative strength between equity market segments. This signal uses the 4-week rate of change of the Utilities-to-S&P 500 price ratio to determine whether the market favors offense (broad equity) or defense (Utilities).
Current indicator: Risk-On.
Conviction: 84/100 · Regime age: 2 weeks (14 days) · Whipsaw alert: 4 flips in last 12 readings
What would flip this signal: Signal flips Risk-Off when the XLU/SPY 4-week rate of change crosses zero (currently -6.24%). That requires the XLU/SPY ratio to rise to 0.06015 from today's 0.05640.
Prior Risk-On regimes: Jun 2026 (1d), Apr 2026–Jun 2026 (56d), Jan 2026 (7d).
This Week's Context: The week’s **utilities underperformance** versus the S&P 500 was driven by a sharp **risk-on rotation** into technology and cyclicals, while investors pulled money out of defensive sectors.[2][6][14] Utilities also faced a **rates headwind**: elevated Treasury yields kept pressure on the group, and the weak jobs print lowered rate-hike fears in a way that helped the broad market more than rate-sensitive defensives.[5][6][10]
Sources: macroradar.io · morningstar.com · spglobal.com
XLU/SPY 4-Week Rate of Change: -6.24%
Current Allocation: 100% SPY (S&P 500)
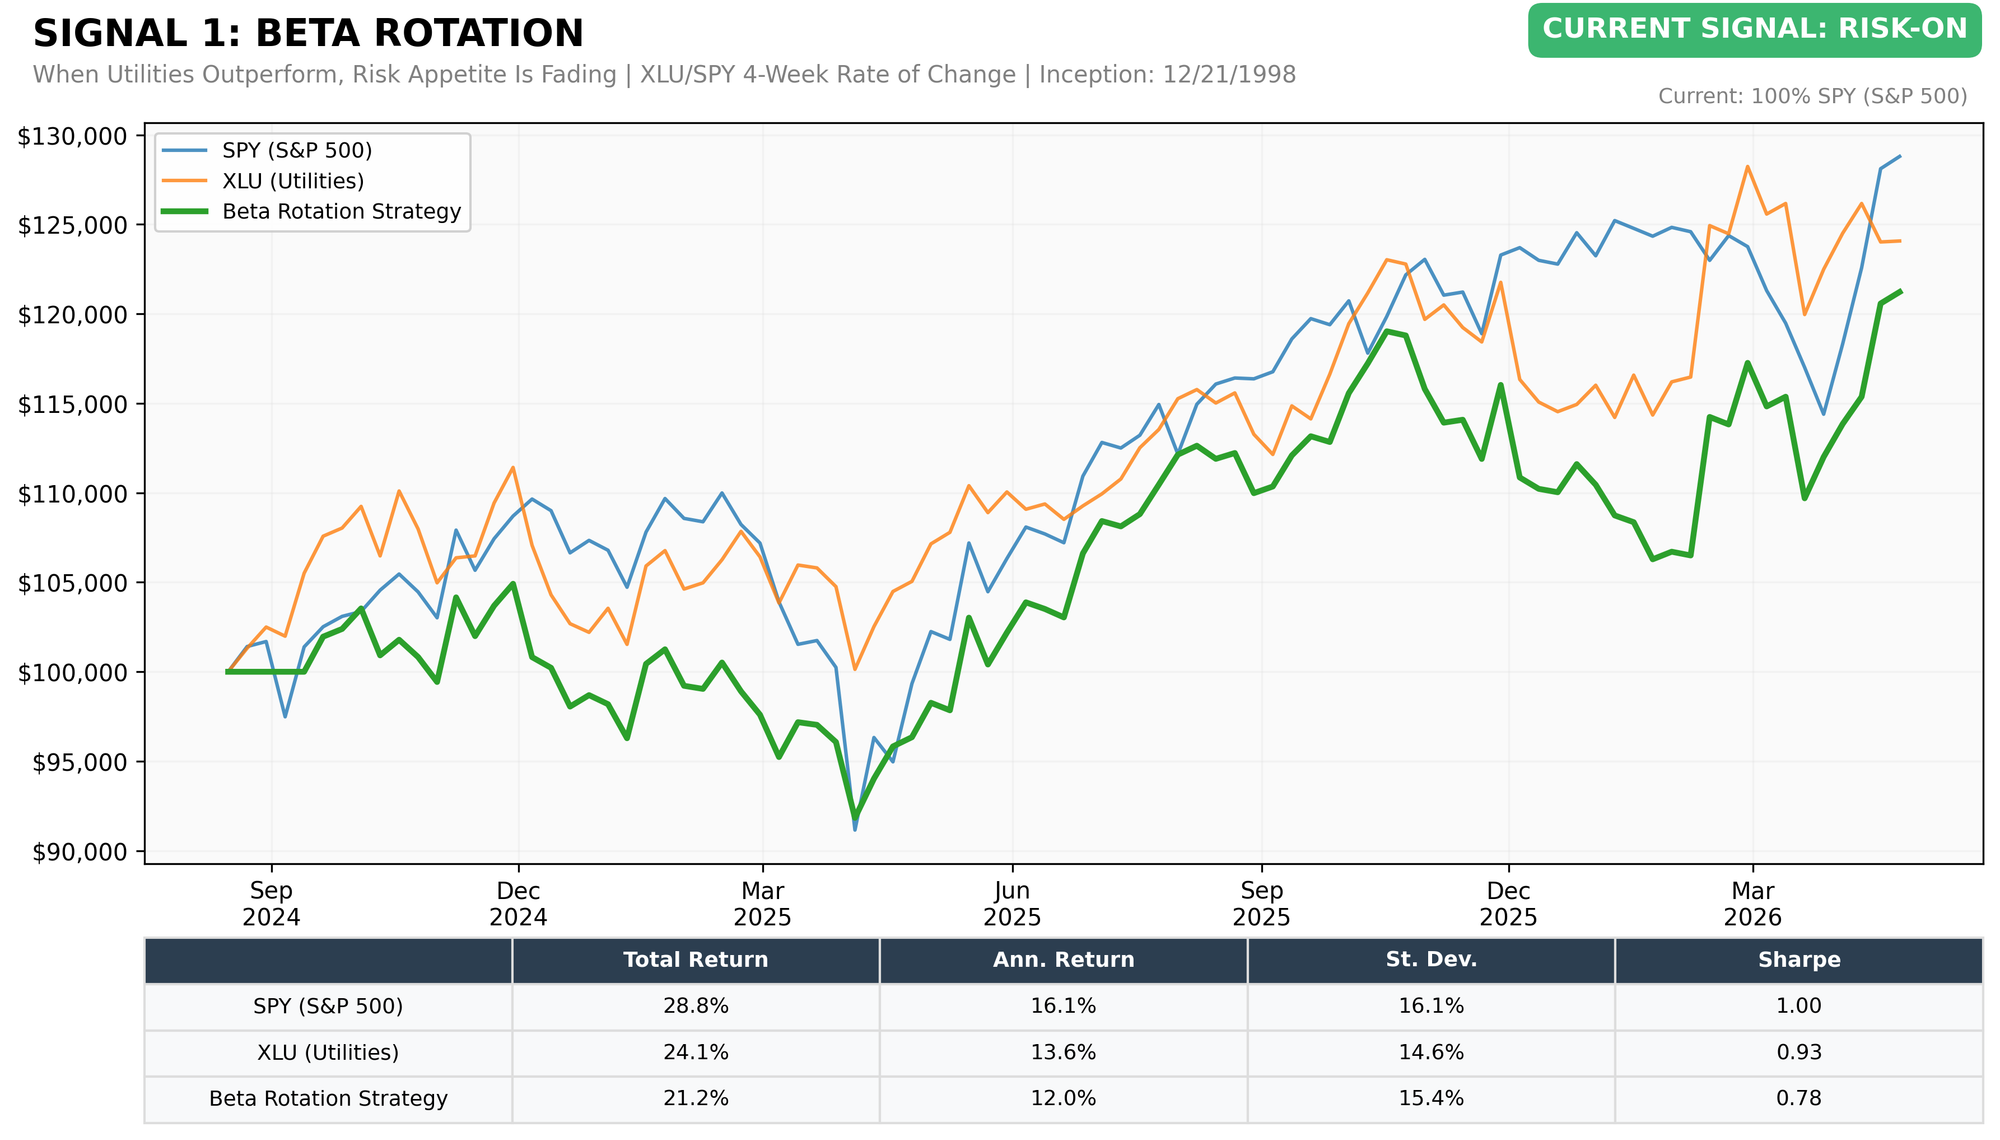
Growth of $100,000 | YTD from January 3, 2025 | Data: Lead-Lag Publishing, LLC
Reading the chart: XLU/SPY 4-week RoC currently -6.24%. Flip threshold: 0.00%. Distance to flip: 6.24 percentage points.
Signal 2: Treasury Rotation
Based on: "A Quantitative Approach to Tactical Asset Allocation" (SSRN 2431022)
Target Investor: Conservative to moderate investors seeking a tactical overlay between equities and long-duration Treasuries. This signal compares the prior month total return of 10-year versus 30-year Treasury bonds to identify shifts in the yield curve's risk appetite signal.
Current indicator: Risk-On.
Conviction: 100/100 · Regime age: 1 weeks (7 days) · Whipsaw alert: 6 flips in last 12 readings
What would flip this signal: Signal flips Risk-Off when next month's IEF return falls below TLT. Current spread: TLT -4.83% vs IEF -1.71% (-3.11 pp).
Prior Risk-On regimes: Mar 2026–Apr 2026 (30d), Nov 2025–Dec 2025 (31d), Jul 2025–Aug 2025 (31d).
This Week's Context: The spread was driven by **duration**: the long bond underperformed because it carries far more rate sensitivity, so any rise in term premium or inflation risk hits the 30-year harder than the 10-year.[13][18] The catalyst was a mix of **reduced Fed-cut confidence** after the weak jobs report and a market that still priced policy easing, but not enough to offset heavier long-end supply and fixed-income demand rotating away from the most convex part of the curve.[2][7][13]
Sources: home.treasury.gov · primerates.com · cnbc.com
30yr Treasury (TLT) May Return: -4.83%
10yr Treasury (IEF) May Return: -1.71%
Current Allocation: 100% S&P 500 (SPY)
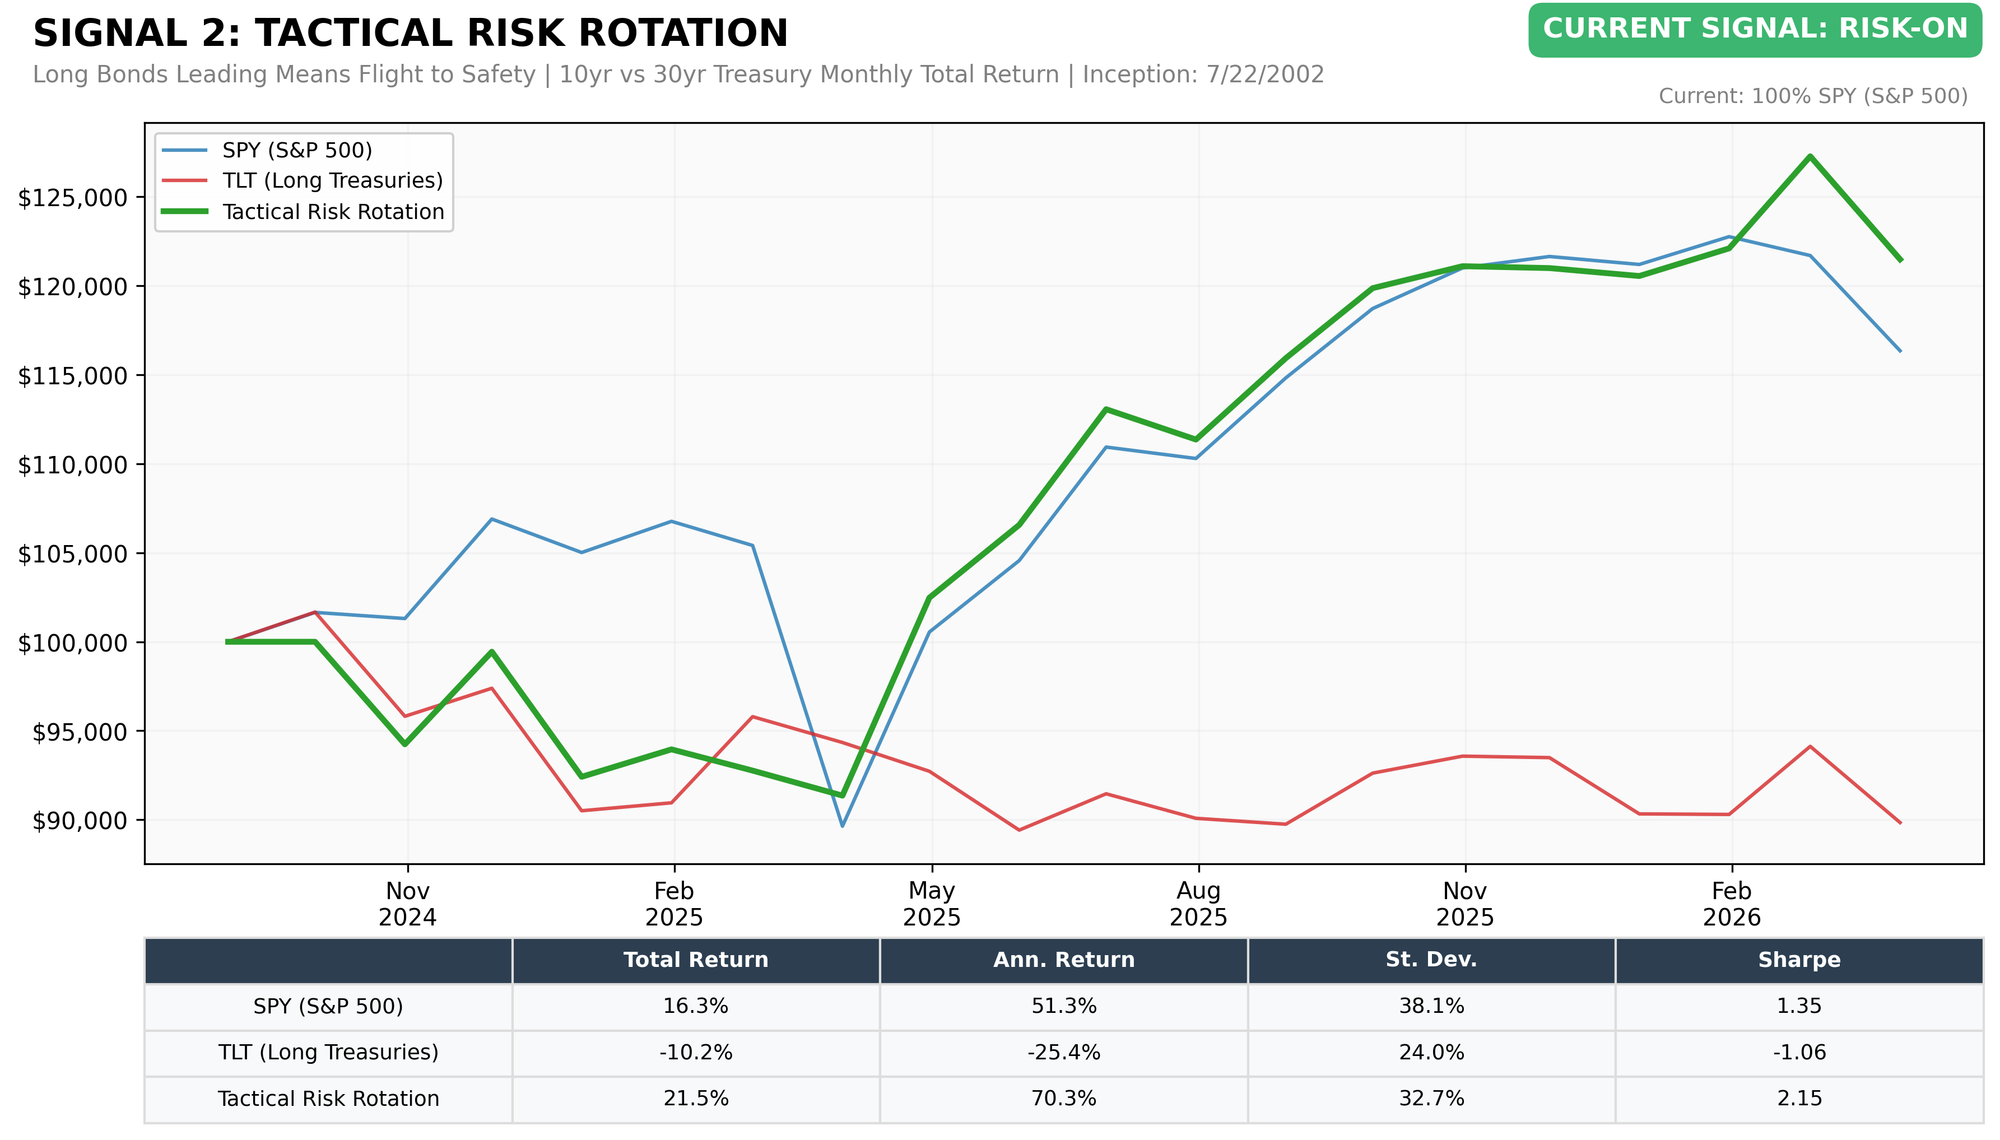
Growth of $100,000 | Monthly Data from January 2025 | Data: Lead-Lag Publishing, LLC
Reading the chart: TLT-minus-IEF May return spread -3.11%. Flip threshold: spread crosses 0%. Distance to flip: 3.11 percentage points.
Signal 3: Lumber-Gold Ratio
Based on: "Lumber: Worth Its Weight in Gold" (SSRN 2604248)
Target Investor: Active investors seeking to rotate between offensive and defensive exposures across multiple asset class pairings. This signal uses the 13-week relative performance of Lumber futures versus Gold spot to determine the market's risk appetite. When Lumber outperforms Gold, the economy is likely strengthening (Risk-On). When Gold outperforms, investors should favor defensive positioning (Risk-Off).
Current indicator: Risk-On.
Conviction: 62/100 · Regime age: ~3 months (105 days)
What would flip this signal: Signal flips Risk-Off when gold overtakes lumber on a 13-week return basis. Current spread: lumber -0.2% vs gold -7.9% (+7.8 pp gap).
Prior Risk-On regimes: Mar 2026–Apr 2026 (21d), Aug 2025 (1d), Jul 2025–Aug 2025 (28d).
This Week's Context: Lumber held up better because it is a **cyclical, housing-linked** asset: when builders are active and construction demand is stable, lumber tends to trade as a growth proxy.[1][9] Gold underperformed because the period did not reward the classic **safe-haven** bid; gold is driven more by risk aversion, real yields, and dollar dynamics, so weakness there points to less defensive demand and a less supportive macro backdrop for the metal.[1][15][19] On the relative read, this is a **risk-on / risk-off** signal tilted toward cyclicals: lumber’s resilience says housing and construction signals were firmer than the market’s appetite for safety, while gold’s decline says capital was not rushing into protection.[1][9][13]
Sources: etf.com · futures.tradingcharts.com · marketwatch.com
Lumber 13-Week Return: -0.17%
Gold 13-Week Return: +-7.93%
Lumber now outperforming Gold over 13 weeks. All 7 sub-strategies have rotated to offensive positioning.
Lumber/Gold Bond Rotation (SPY vs GOVT)
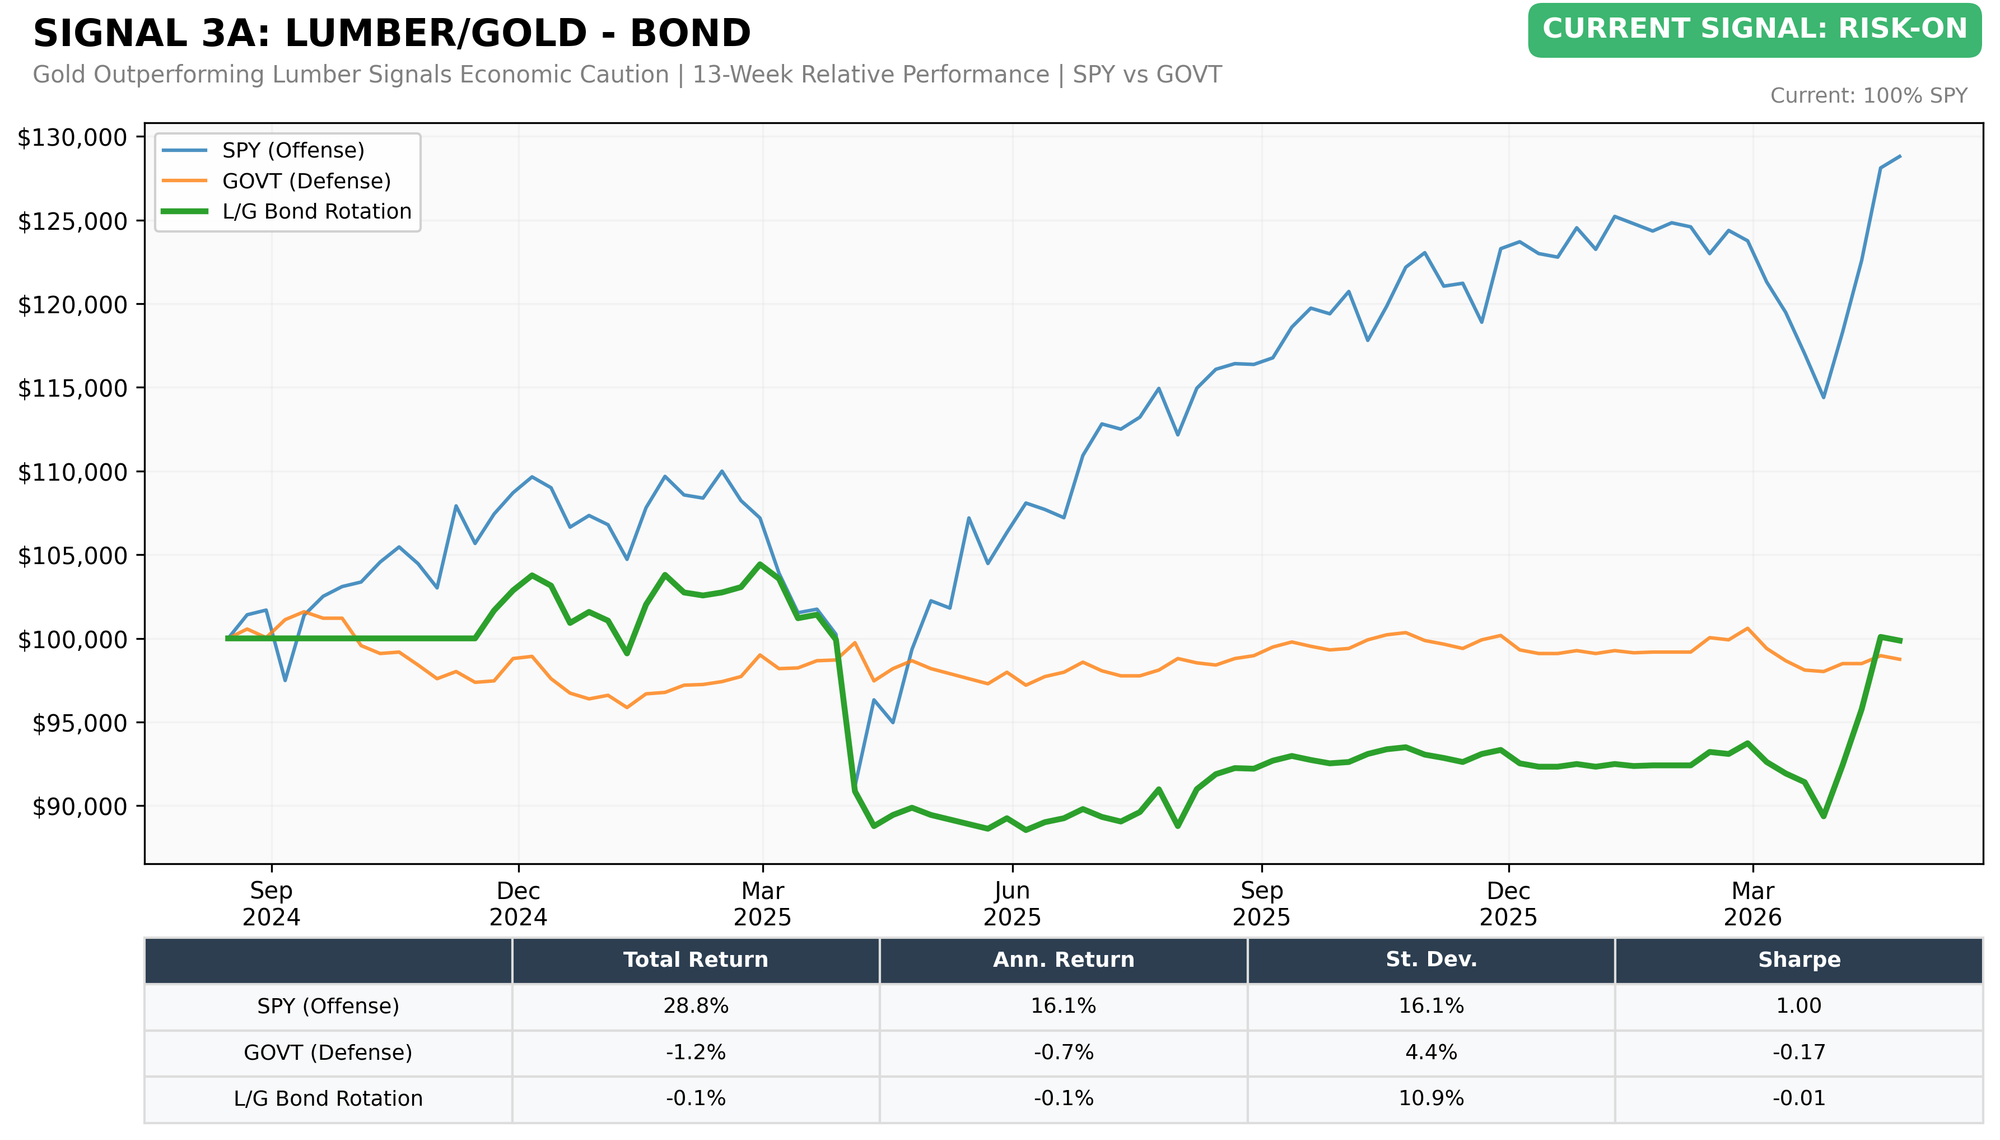
Growth of $100,000 | YTD from January 3, 2025 | Data: Lead-Lag Publishing, LLC
Lumber/Gold Buy-Write (SPY vs PBP)
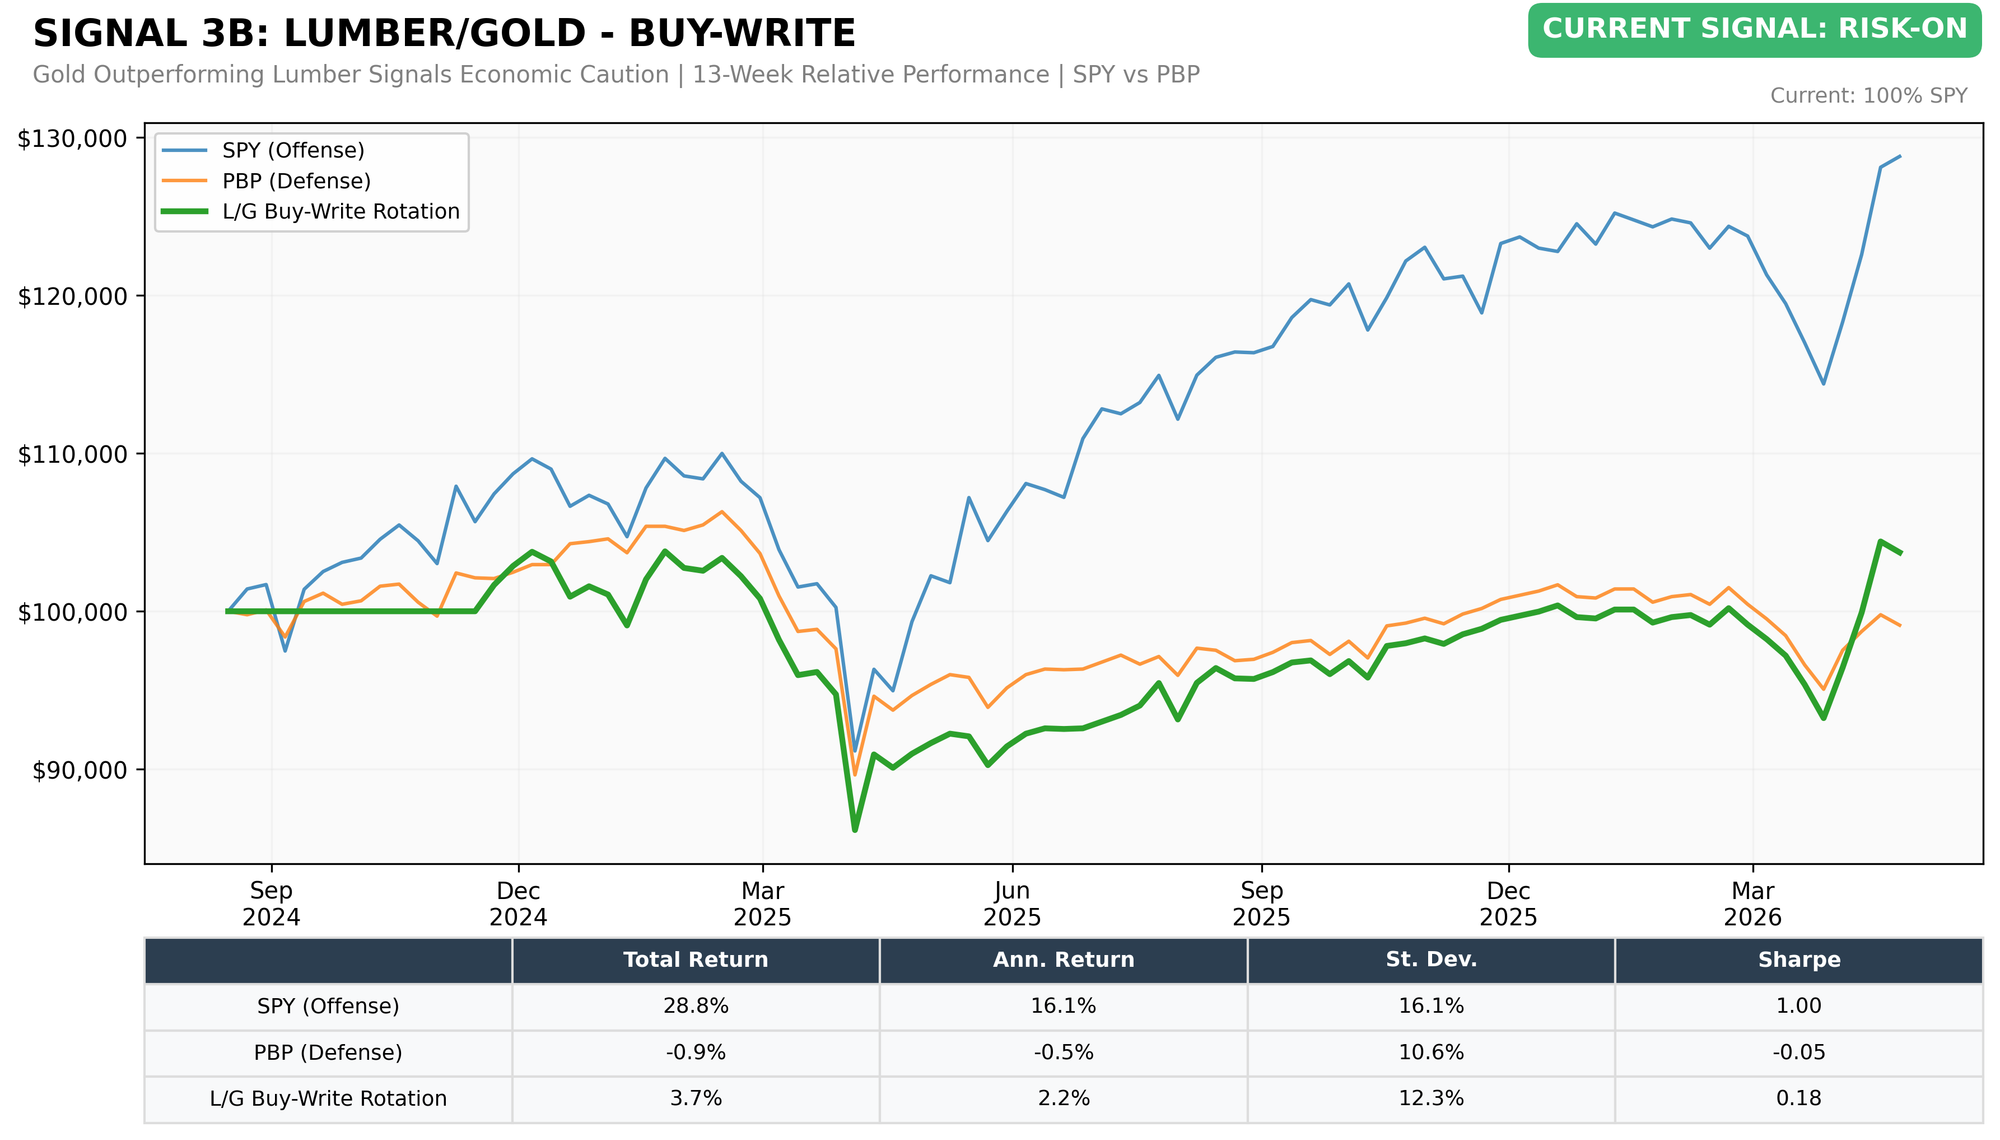
Growth of $100,000 | YTD from January 3, 2025 | Data: Lead-Lag Publishing, LLC
Lumber/Gold Low Volatility (SPY vs SPLV)
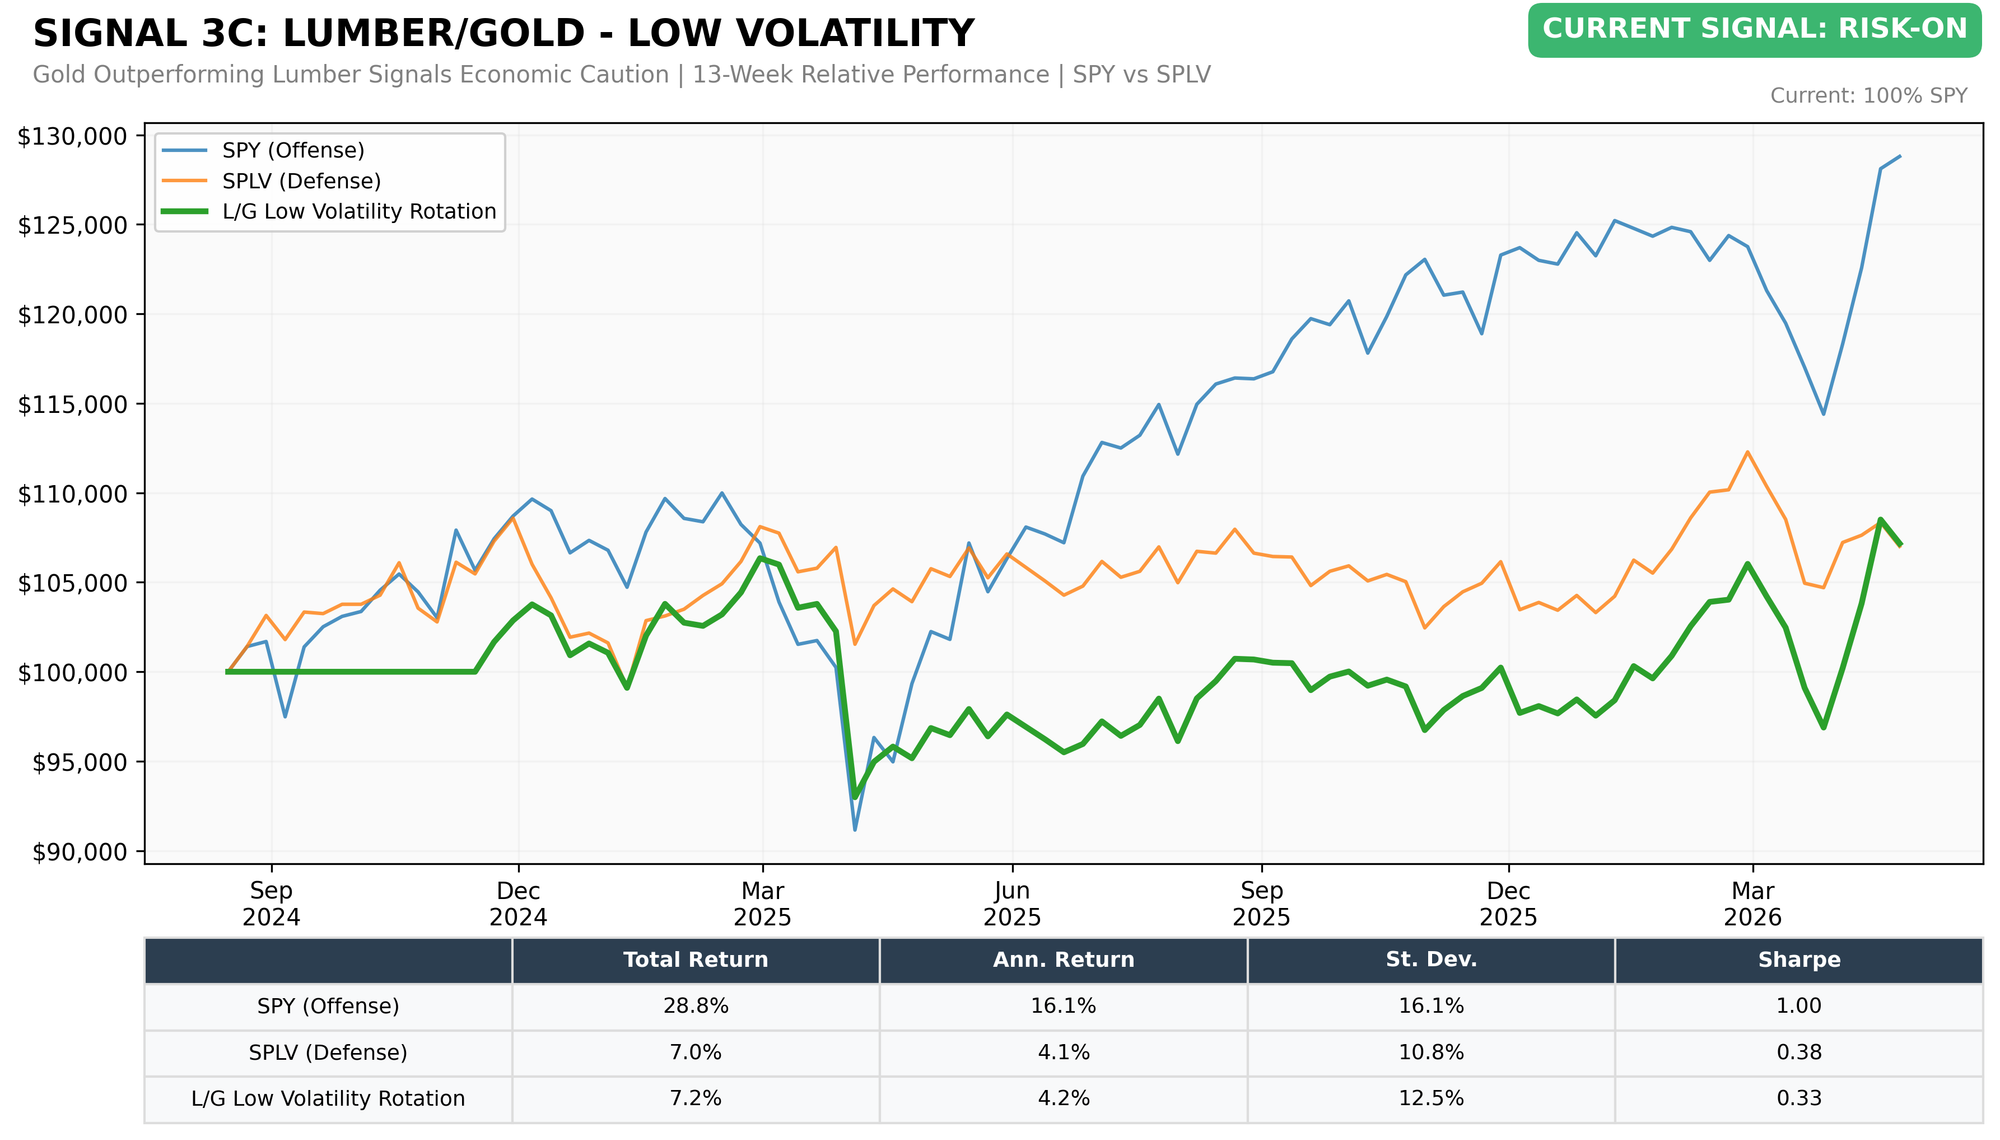
Growth of $100,000 | YTD from January 3, 2025 | Data: Lead-Lag Publishing, LLC
Lumber/Gold Small-Cap (SPY vs VSMAX)
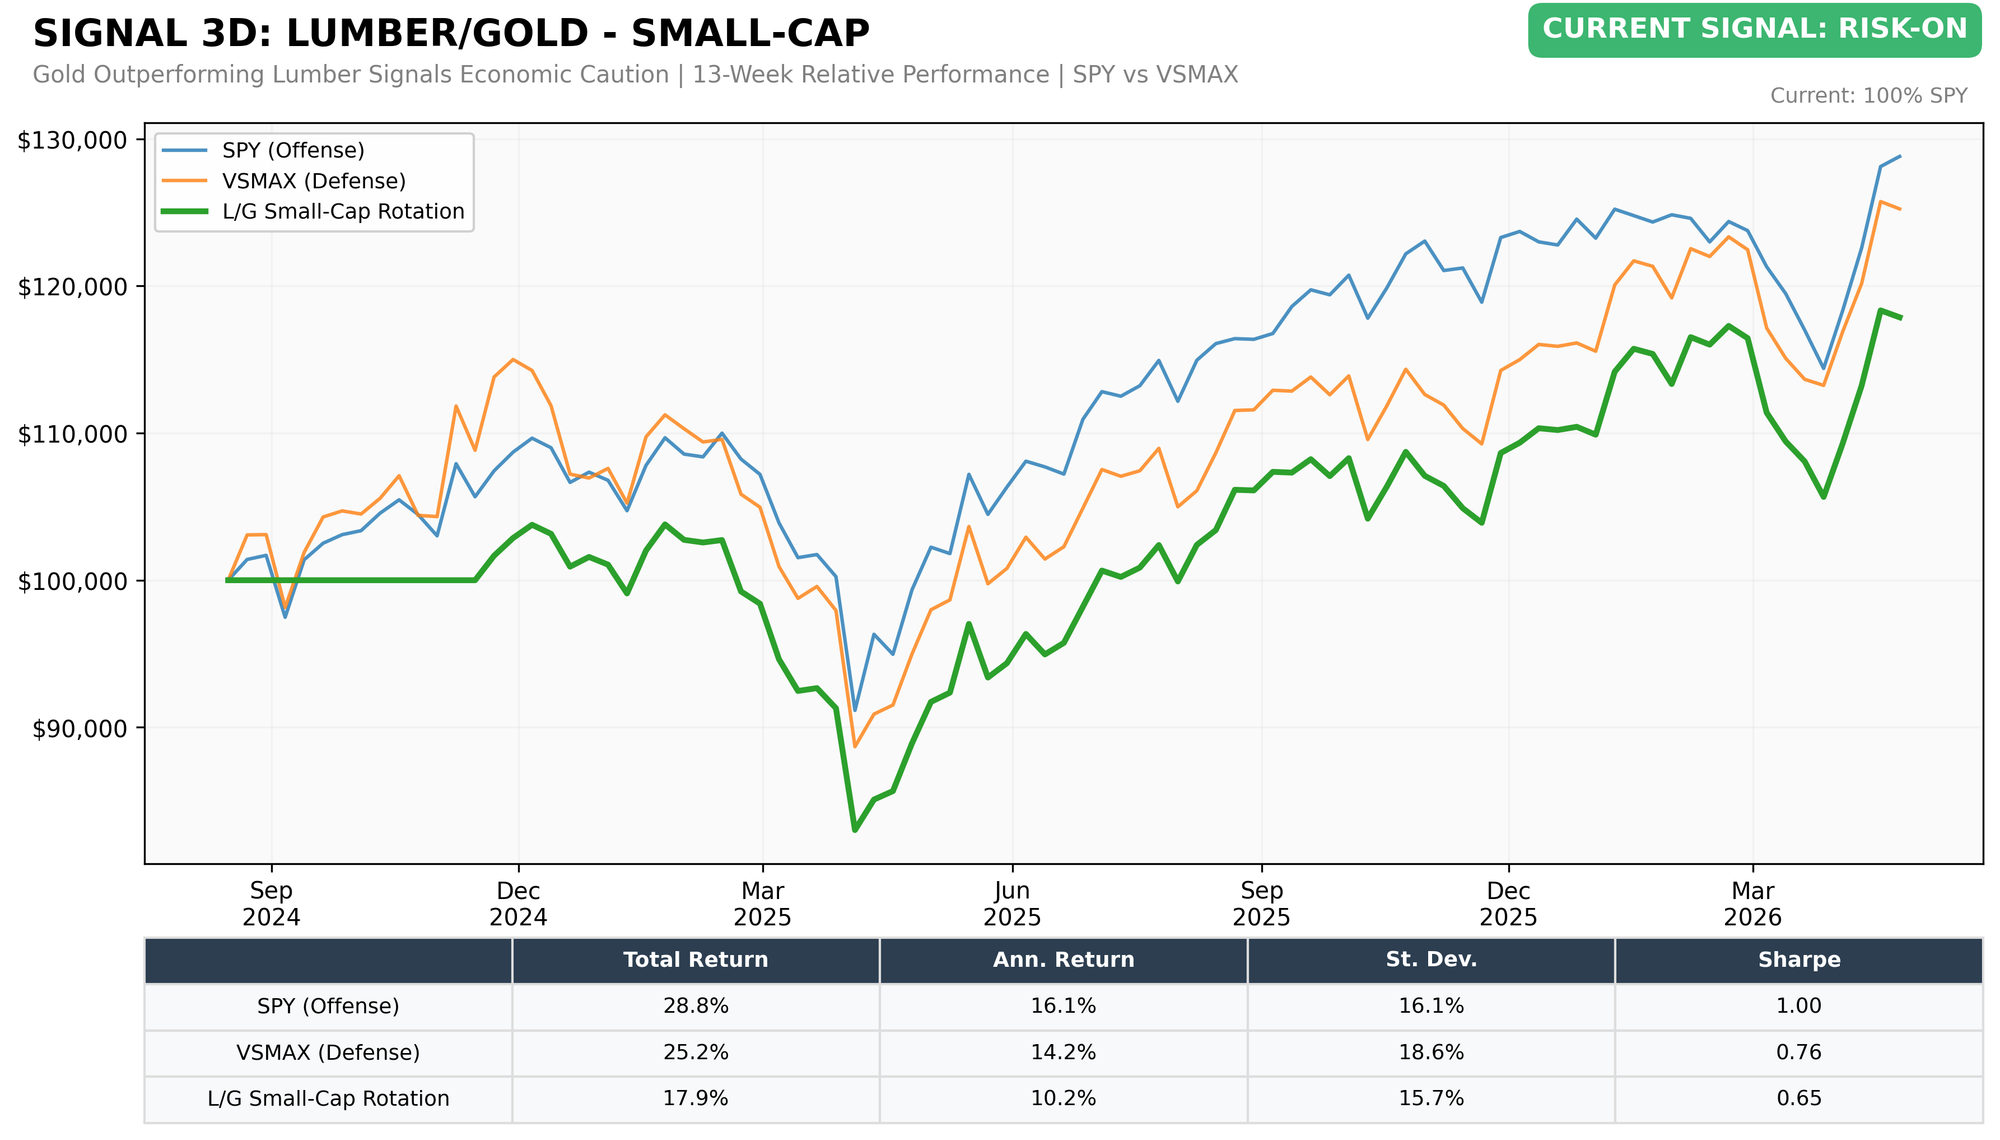
Growth of $100,000 | YTD from January 3, 2025 | Data: Lead-Lag Publishing, LLC
Lumber/Gold High Beta (SPY vs SPHB)
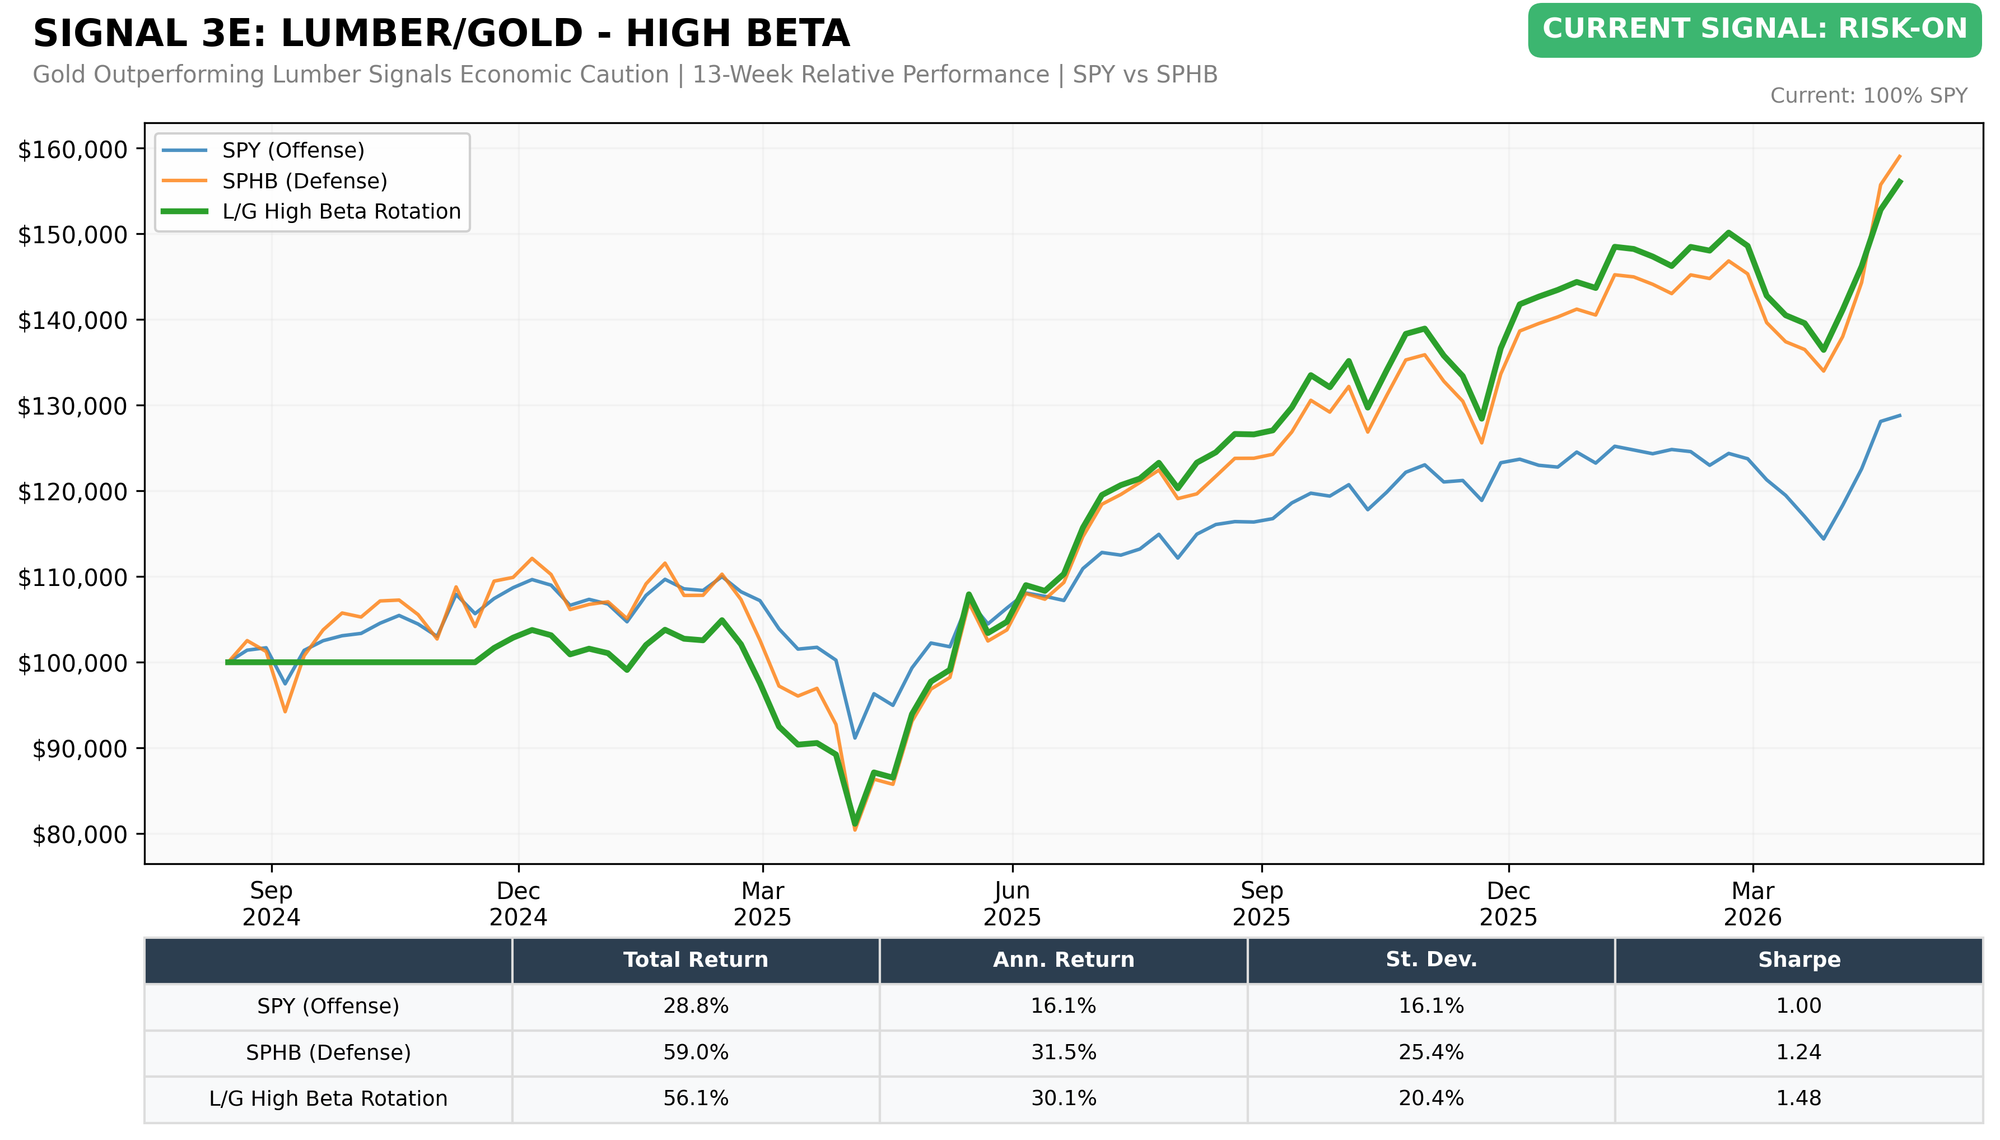
Growth of $100,000 | YTD from January 3, 2025 | Data: Lead-Lag Publishing, LLC
Lumber/Gold Cyclical Growth (SPY vs VUG)
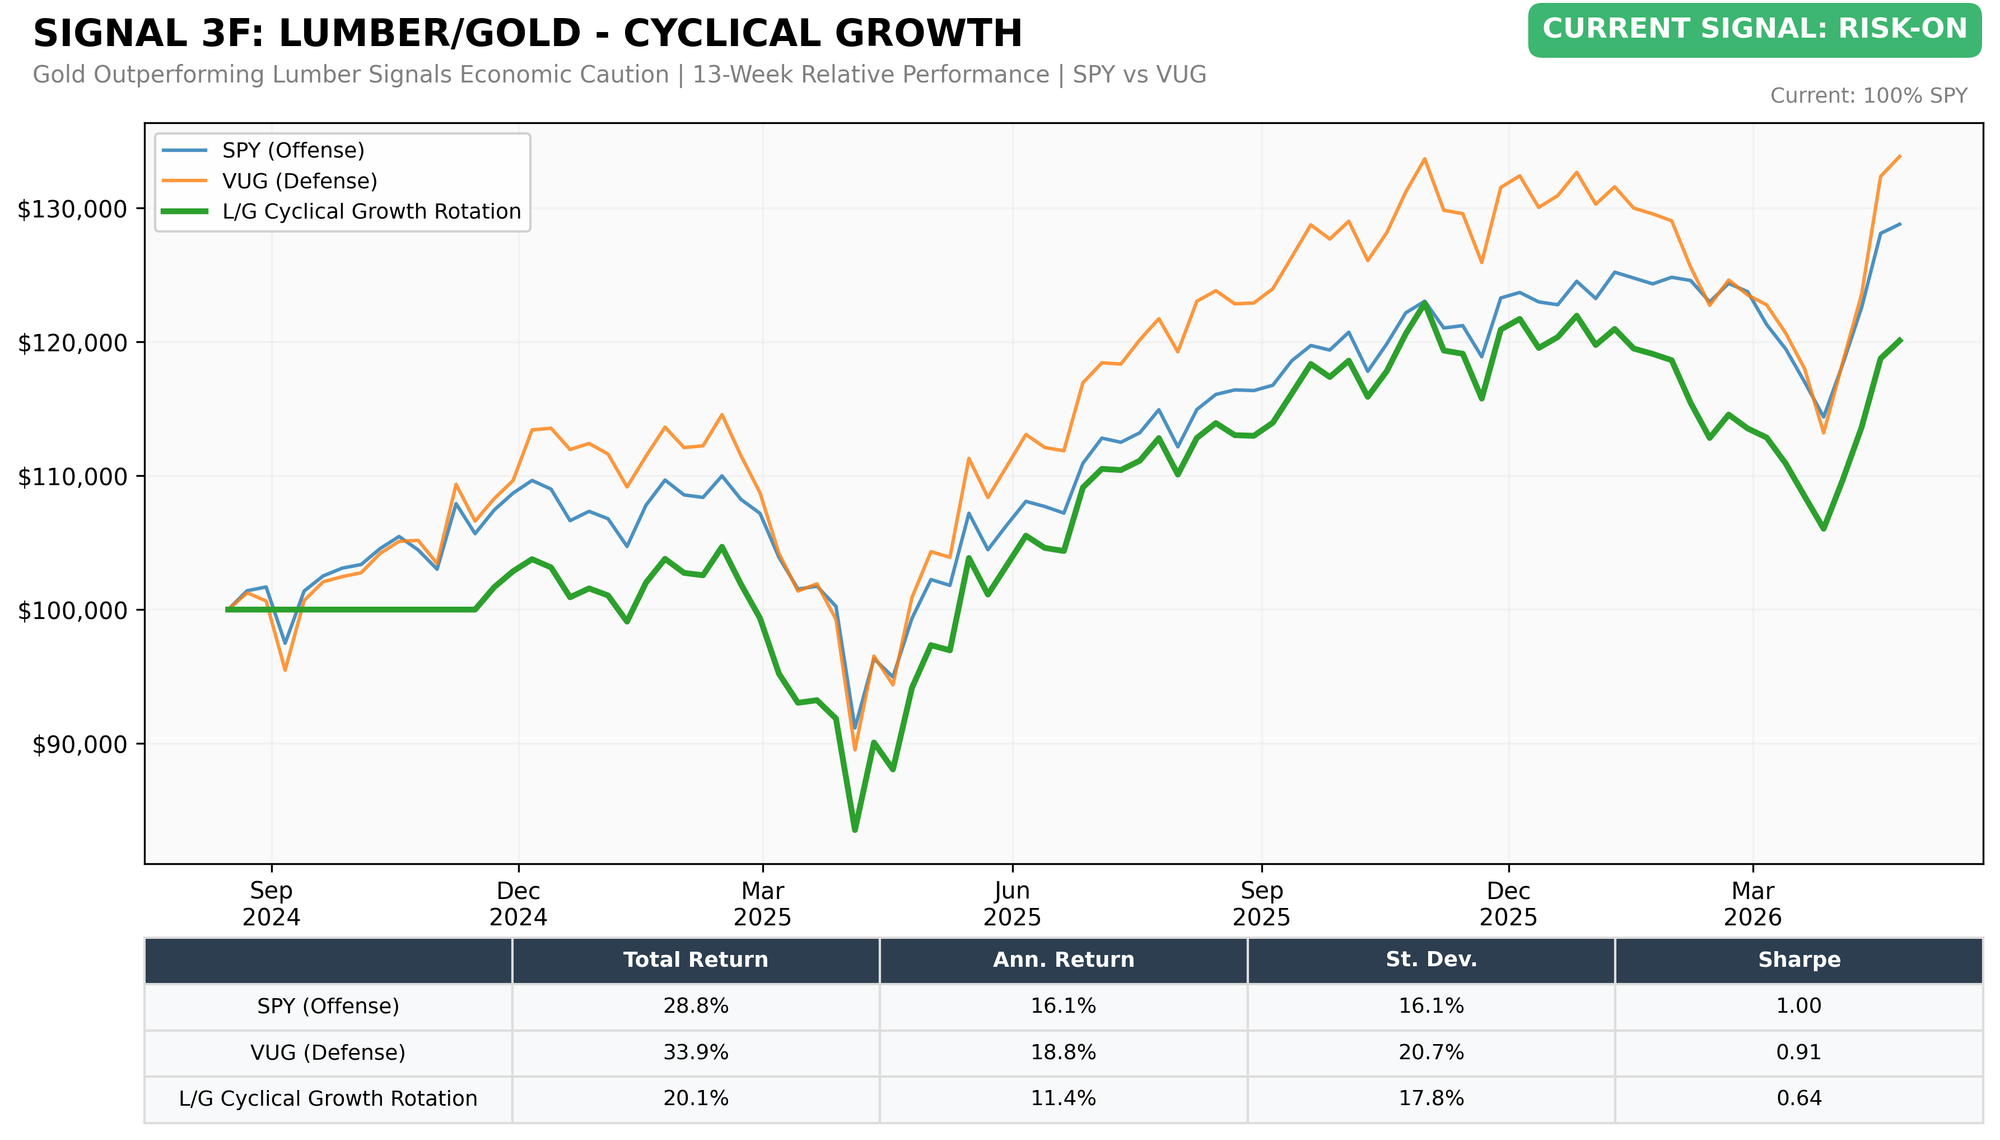
Growth of $100,000 | YTD from January 3, 2025 | Data: Lead-Lag Publishing, LLC
Lumber/Gold Cyclical Bond (GOVT vs VUG)
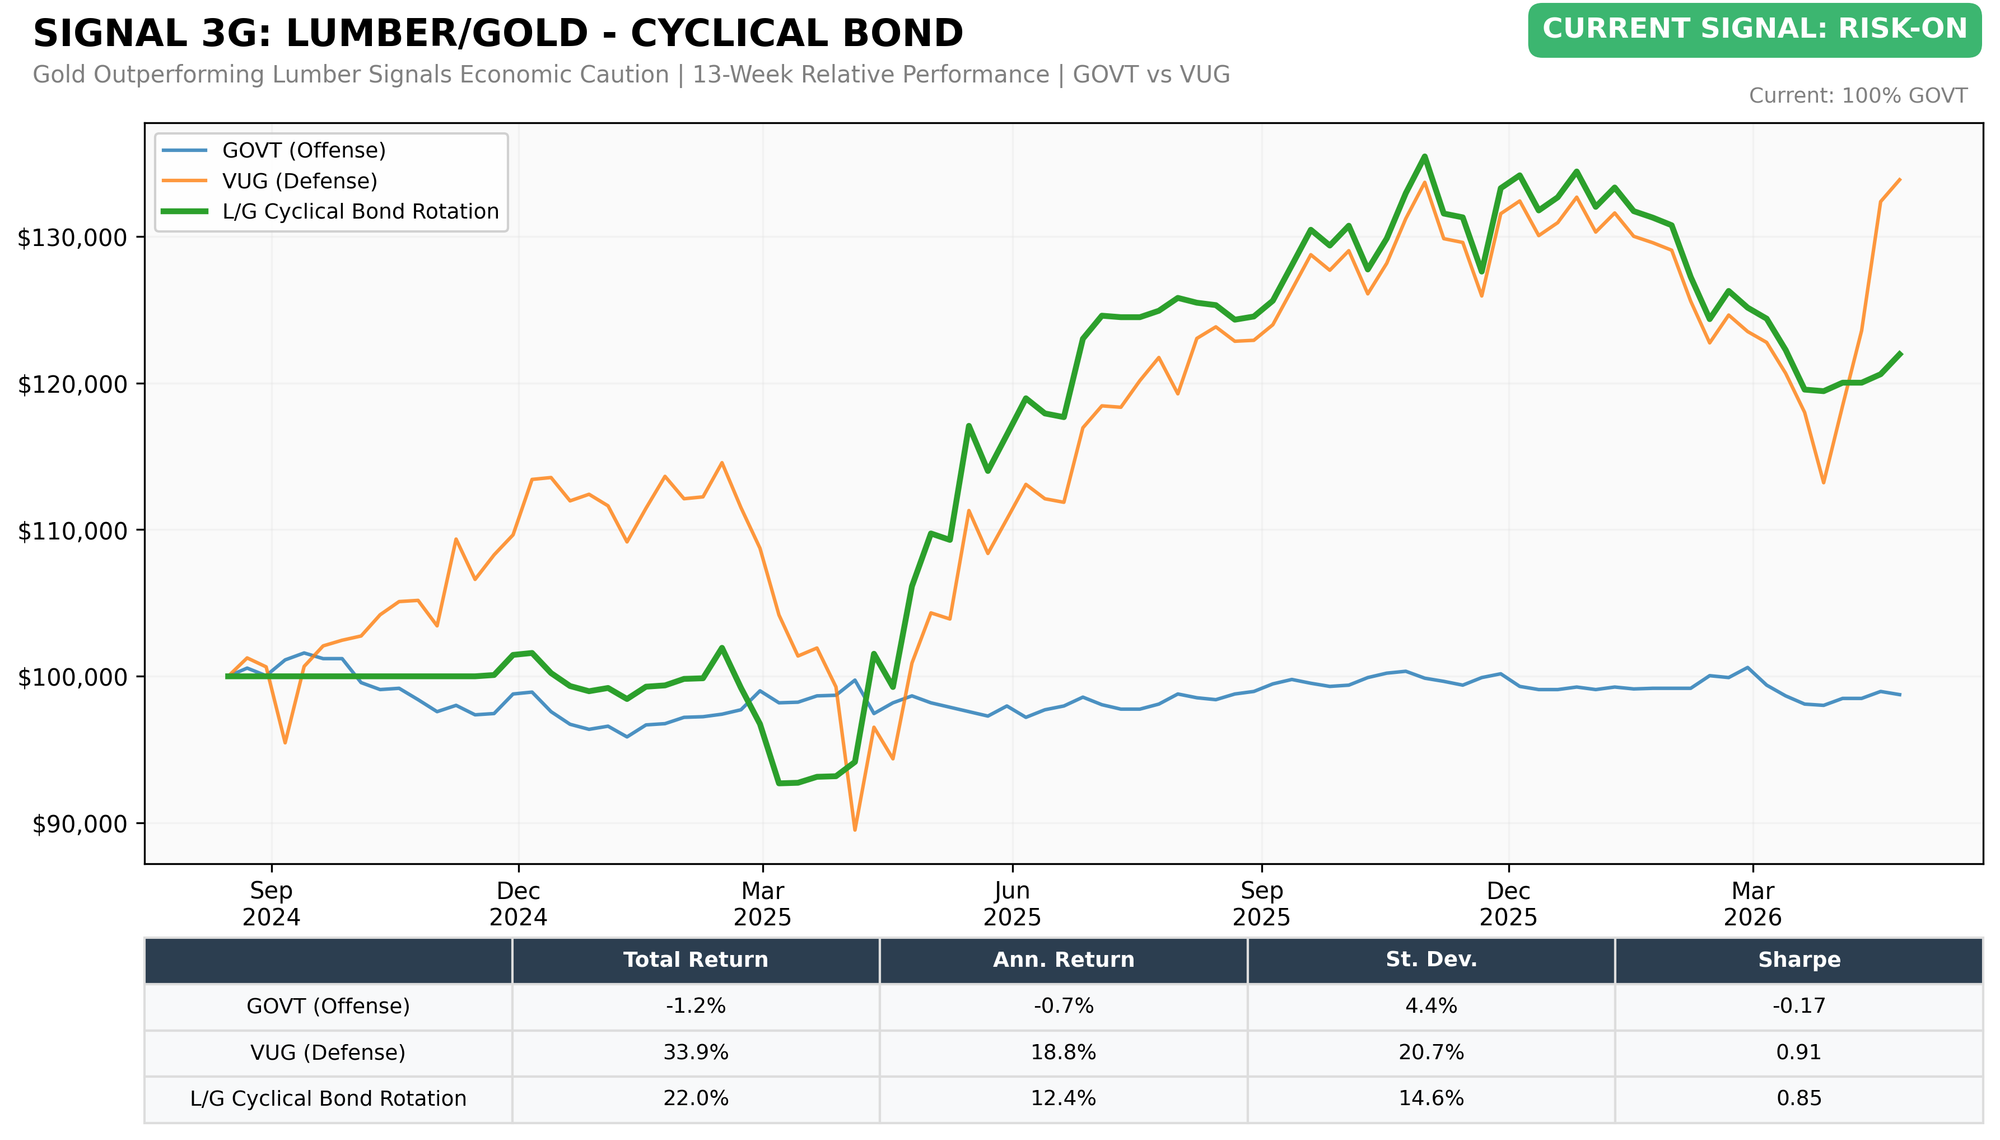
Growth of $100,000 | YTD from January 3, 2025 | Data: Lead-Lag Publishing, LLC
Signal 4: Leverage for the Long Run
Based on: "Leverage for the Long Run" (SSRN 2741701)
Target Investor: Aggressive investors with a long time horizon who are comfortable with leveraged equity exposure. This signal uses the S&P 500's position relative to its 200-day simple moving average to determine whether to employ 2x leveraged exposure (SSO) or standard exposure (SPY).
Current indicator: Risk-On.
Conviction: 94/100 · Regime age: ~4 months (121 days)
What would flip this signal: Signal flips Risk-Off when the S&P 500 closes below its 200-day SMA of 7,030 (today 7,733, +10.0%).
Prior Risk-On regimes: May 2025–Mar 2026 (293d).
This Week's Context: The S&P 500 is in a **durable uptrend**: price is not just above the 200-day, it is holding a wide cushion, which tells you the dominant regime remains intact and buyers are still controlling the tape.[1][3] Breadth confirms the move is broad-based, with roughly **seven in ten stocks above their own 200-day averages** and bullish sector participation running deep, not narrow.[3][17] That combination matters: when the index sits well above a rising long-term trendline and breadth stays elevated, the market is signaling **trend persistence**, not a fragile overshoot.[3][20]
Sources: barchart.com · marketwatch.com · tradingtwohundred.com
S&P 500 Close: 7,732.60
200-Day SMA: 7,029.71
Spread: +10.00% above the 200-day moving average
Current Allocation: 100% SSO (ProShares Ultra S&P500, 2x leveraged)
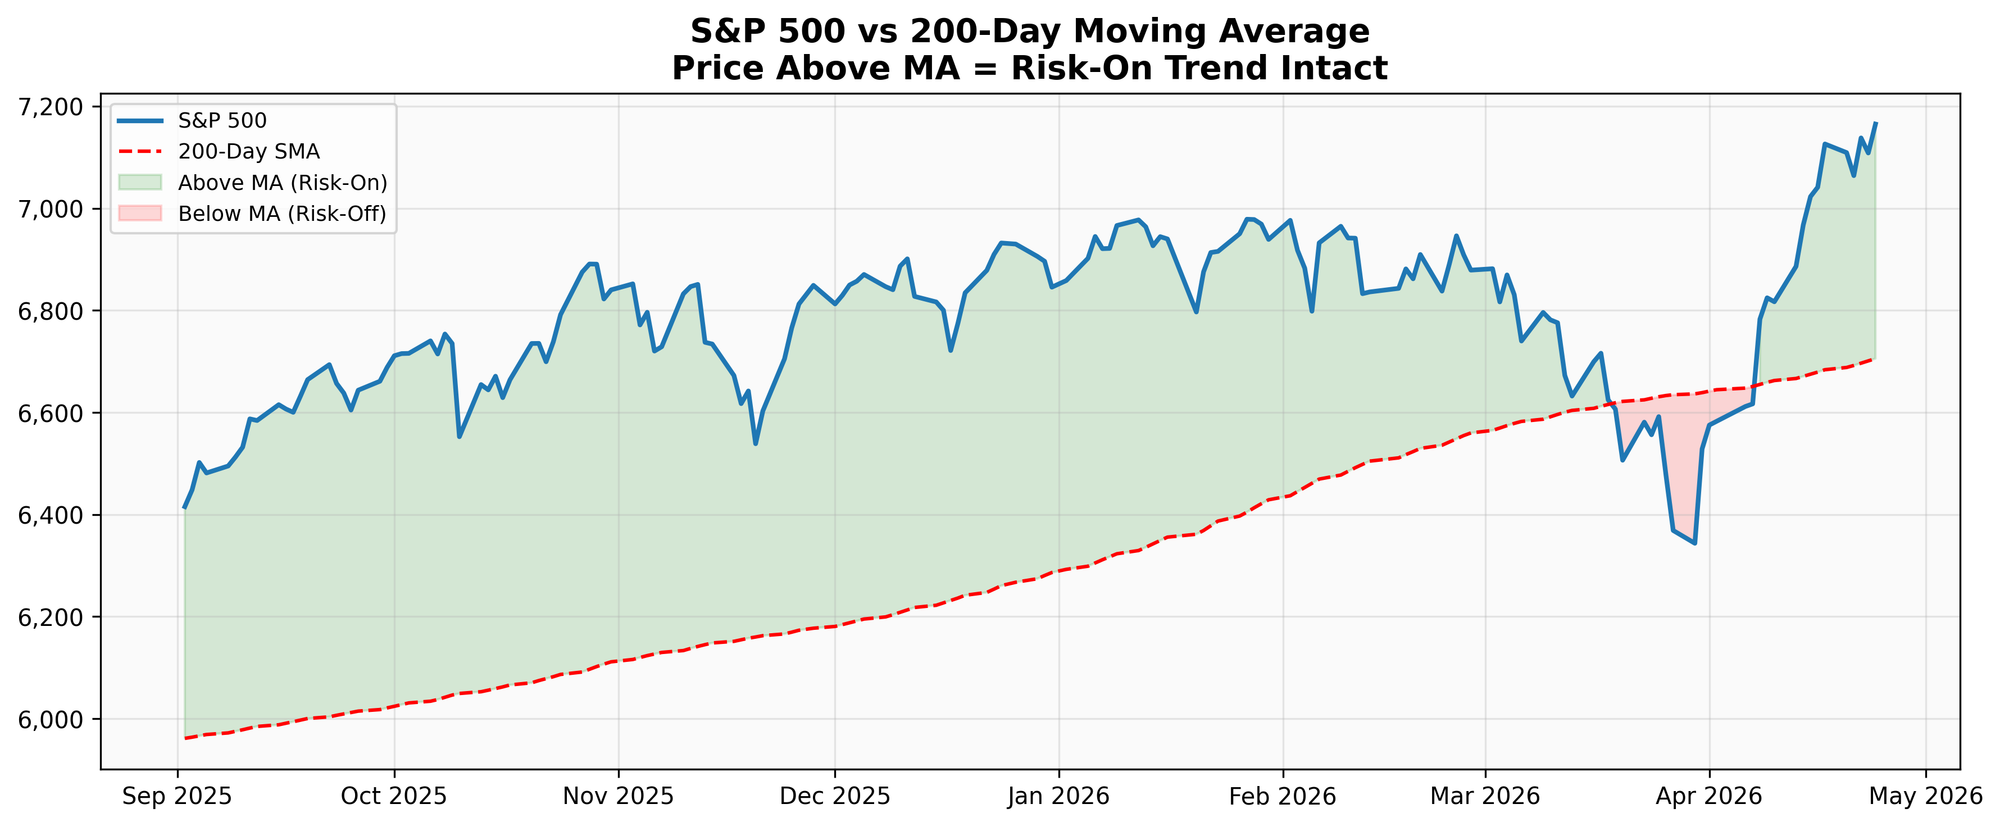
S&P 500 Index vs 200-Day Simple Moving Average | Sep 2025 - Apr 2026
Reading the chart: S&P 500 at 7732.60. 200-day SMA at 7029.70. Flip threshold: SPX closes below SMA. Current cushion: +10.00 percentage points.
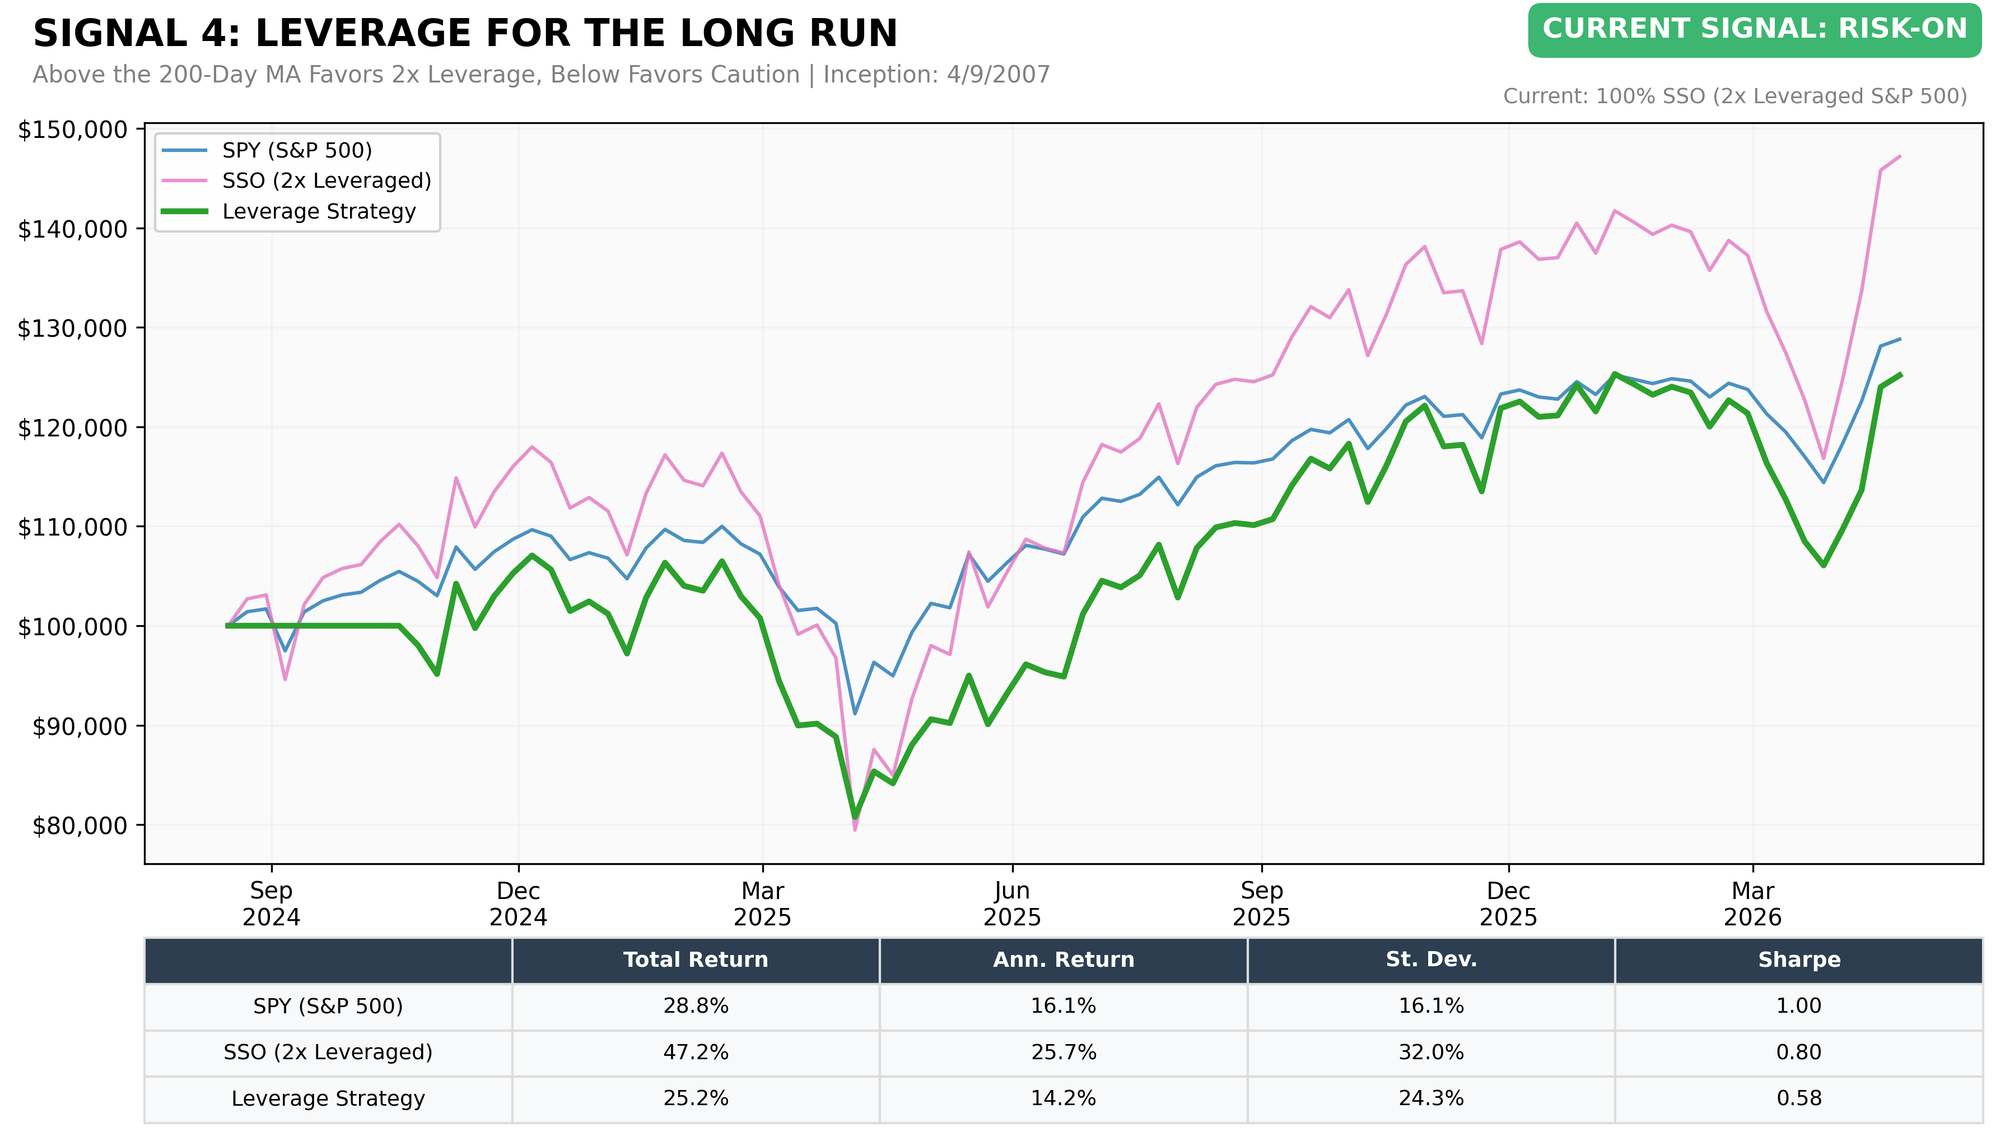
Growth of $100,000 | YTD from January 3, 2025 | Data: Lead-Lag Publishing, LLC
CONCLUSION & ALLOCATION GUIDANCE
The framework reads 4-0 Risk-On this week. 4 of four signals favor risk-on positioning and 0 flag defense. The S&P 500 at 7,732.6 sits +10.0% above its 200-day SMA.
Bottom Line: Maintain the framework's allocations as called this week. Signal 4 (Risk-On) calls for 100% SSO (2x leveraged S&P 500). Signal 1 (Risk-On) keeps broad equity exposure over defensive Utilities. Signal 2 (Risk-On) favors equity over long-duration Treasuries. Signal 3 (Risk-On) favors offensive sub-strategies across all seven Lumber/Gold pairs. The framework's message this week is unambiguous in its specific calls per signal, but the mixed posture argues for sizing with awareness of the disagreement among indicators.
Deep Dive: 200-day Moving Average — Trend’s Final Word
The 200-day MA signal is the simplest of the four — and one of the most studied in market history. Above the 200-day MA, the framework allocates to SSO (2x leveraged S&P 500). Below, it goes to unleveraged SPY. The leverage decision is binary because the 200-day cleanly separates two regimes with very different historical risk/reward profiles: above-200 environments have produced positive average forward returns with shallower drawdowns; below-200 environments have produced flat-to-negative returns with materially deeper drawdowns. The signal is slow on purpose. False breaks happen, but the cost of staying with the trend through false breaks has historically been smaller than the cost of catching falling knives.
This Deep Dive rotates across all four signals on a 4-week cycle. Next week’s spotlight: Beta Rotation — Why Utilities Lead Defense.
The Lead-Lag Report is provided by Lead-Lag Publishing, LLC. All opinions and views mentioned in this report constitute our judgments as of the date of writing and are subject to change at any time. Information within this material is not intended to be used as a primary basis for investment decisions and should also not be construed as advice meeting the particular investment needs of any individual investor. Trading signals produced by the Lead-Lag Report are independent of other services provided by Lead-Lag Publishing, LLC or its affiliates, and positioning of accounts under their management may differ. Please remember that investing involves risk, including loss of principal, and past performance may not be indicative of future results. Lead-Lag Publishing, LLC, its members, officers, directors and employees expressly disclaim all liability in respect to actions taken based on any or all of the information on this writing.



