A 15% Mortgage Yield With A 7.87% Expense Ratio. Do The Math
DMO's 15% yield and tripled discount sit on top of 46% leverage and the highest expense load I have profiled.

Today's Lead-Lag Report post is sponsored by Relative Sentiment
The Relative Sentiment Tactical Allocation ETF is a flexible, multi-asset fund that invests across stocks, bonds, commodities, precious metals, and currencies. Its approach is guided by a research-based factor called relative sentiment — which tracks how optimistic or cautious professional investors are compared to individual investors. Studies show professionals tend to have an edge over time, and this ETF seeks to capture that insight by increasing exposure to areas where institutions are more optimistic and reducing exposure where they're more cautious. Relative sentiment often complements trend-following strategies, helping create portfolios that may be more balanced and less prone to sharp swings.
The Fund's investment objectives, risks, charges and expenses must be considered carefully before investing. This and other important information is contained in the Prospectus and SAI, which may be obtained by following the links or by calling +1.215.882.9983. Please read the prospectus carefully before investing.
Investments involve risk. Principal loss is possible.
The Fund is distributed by PINE Distributors LLC.
ETFAC-4976143-11/25
DISCLAIMER – PLEASE READ: This is sponsored advertising content for which Lead-Lag Publishing, LLC has been paid a fee. The information provided in the link is solely the creation of Relative Sentiment. Lead-Lag Publishing, LLC does not guarantee the accuracy or completeness of the information provided in the link or make any representation as to its quality. All statements and expressions provided in the link are the sole opinion of Relative Sentiment. and Lead-Lag Publishing, LLC expressly disclaims any responsibility for action taken in connection with the information provided in the link.
Key Highlights
- Yield: $0.12 monthly distribution, a 14.29% rate per CEFConnect (as of 9/4/2026); 15.38% indicated on Friday's $9.49 close computed from Yahoo Finance
- Discount: -11.19% to NAV per Franklin Templeton as of 9/21/2026, versus a 52-week average of -3.95% per CEFConnect
- Leverage: 46.46% effective leverage, $126.2 million of common assets against $235.6 million of exposure per CEFConnect
- The catch: 7.87% total expense ratio per CEFConnect as of 12/31/2025, versus a 14% distribution, the highest expense-to-yield ratio I have profiled
- Portfolio: 273 holdings as of 7/31/2026, agency MBS 55.15%, asset-backed 41.83%, non-agency RMBS 41.18%, CMBS 40.84% per CEFConnect (leverage totals exceed 100%)
Every week, we'll profile a high yield investment fund that typically offers an annualized distribution of 6-10% or more. With the S&P 500 yielding less than 2%, many investors find it difficult to achieve the portfolio income necessary to meet their needs and goals. This report is designed to help address those concerns.
When The Yield Is 14% And The Fee Is 7.87%
Every so often a fund's headline numbers stop me cold. Western Asset Mortgage Opportunity Fund Inc. (DMO) pays $0.12 per month, a 14.29% distribution rate per CEFConnect, holds a leveraged book of agency mortgages, asset-backed paper and commercial mortgages, and runs total expenses of 7.87% per year per CEFConnect as of December 31, 2025. Run that math with me: the fund's cost line consumes slightly more than half of its entire distribution.
That is the frame for this piece. The 14% check is real, the leverage behind it (46.46% effective) is real, and the discount at -11.19% per Franklin Templeton as of September 21 is the market's standing verdict that something here is expensive. In a week when the Fed hiked to 3.75% to 4.00% (source: Federal Reserve), a leveraged mortgage fund with a doubled discount is either a value or a warning, and it is worth knowing which.
Fund Background
DMO launched February 26, 2010 per CEFConnect and is managed by Western Asset Management, the fixed-income specialist within Franklin Templeton. It is a mortgage CEF: per CEFConnect as of July 31, 2026, the portfolio holds 273 positions led by agency MBS at 55.15%, asset-backed securities at 41.83%, non-agency residential MBS at 41.18%, and commercial MBS at 40.84%. Those figures sum past 100% because the fund is leveraged: $235.6 million of investment exposure sits on top of $126.2 million of common assets, per CEFConnect.
The fund distributes $0.12 monthly. Annual expenses of 7.87% per CEFConnect are an order of magnitude above what an unleveraged mortgage ETF charges, and that gap is the single most important fact about this fund.
Portfolio Composition
The book is diversified across the securitized stack: government-guaranteed agency mortgages, asset-backed paper, non-agency residential mortgages, and commercial mortgages, per the CEFConnect breakdown above. Agency MBS is the largest sleeve at 55.15%, which means prepayment and spread risk against Treasuries matter more to NAV than credit defaults. The non-agency and CMBS sleeves carry genuine credit exposure, and the asset-backed sleeve adds consumer credit in securitized form. It is a competent, liquid, institutional mix. The composition is not the problem. The 46.46% leverage layered on it at a 7.87% expense load is the problem. A note on what the agency-heavy mix means for how this fund moves. Agency MBS trades as a spread product against Treasuries, so its primary risks are rate direction, curve shape, and prepayment speed, not default. That is why DMO's price chart looks like a leveraged rates instrument rather than a credit instrument, and why its discount blew out in the same weeks the Fed's September meeting approached. If you can hold the risk factors in your head as leveraged rates-plus-spreads exposure, you understand this fund. If you bought it because the word mortgage sounded safe, you own something you do not understand, which is the worst position to be in during a dislocation.
Historical Performance
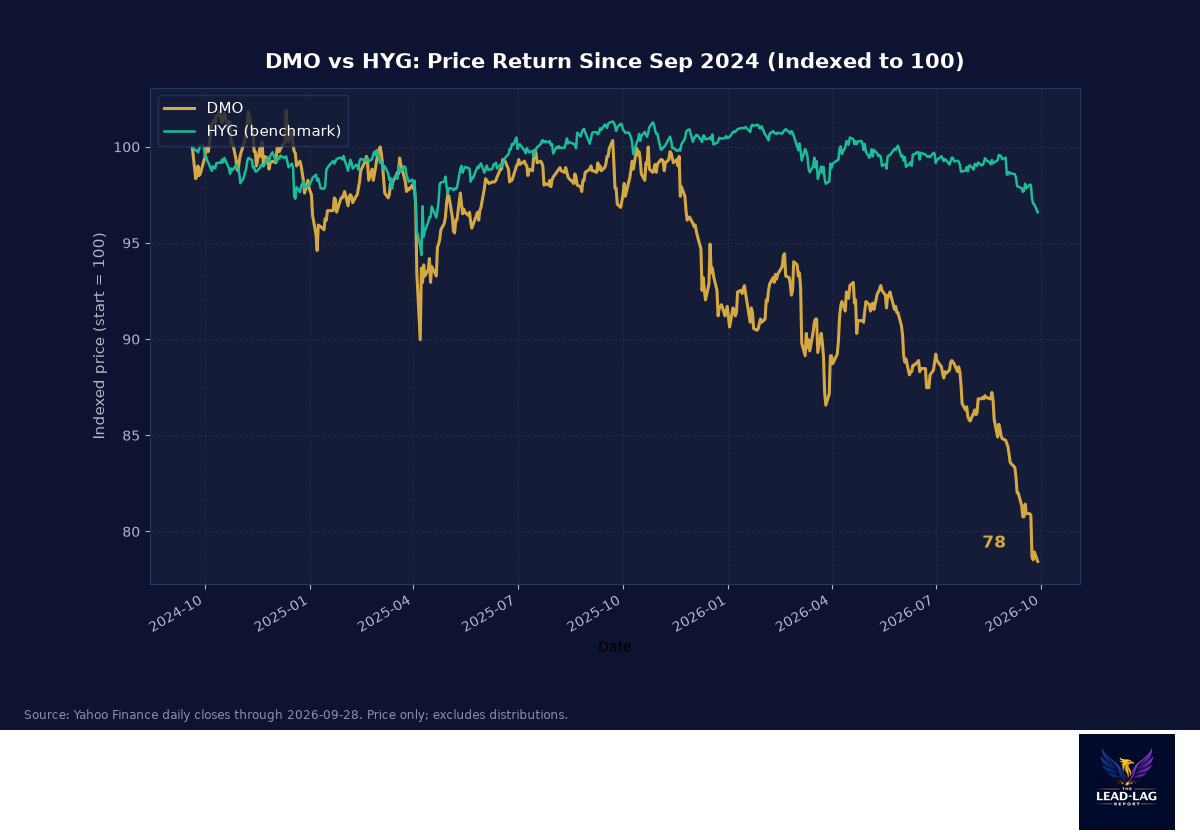
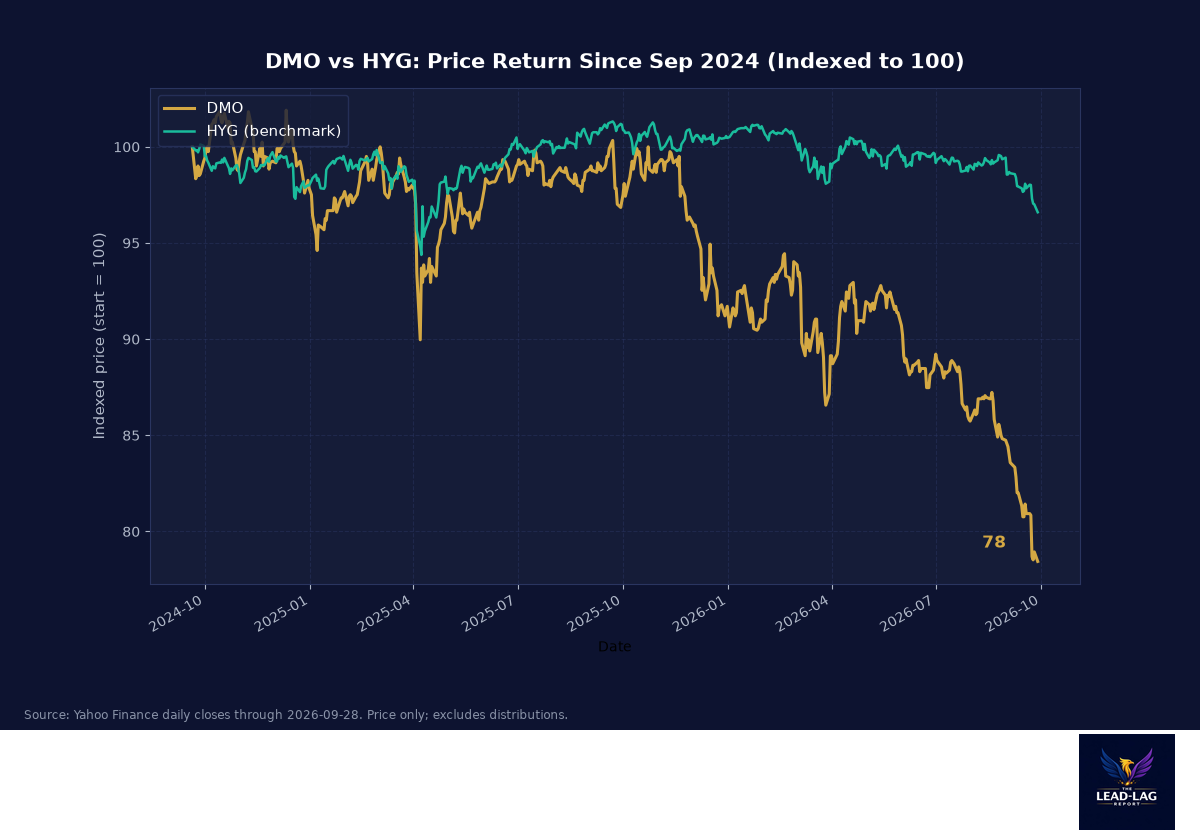
Since September 2024, DMO computed a +4.6% total return on a -21.6% price return, with $3.15 of distributions per share collected along the way (from Yahoo Finance closes and payouts). The pattern is the leveraged-CEF pattern of this entire week's batch: NAV grinding modestly while price gets crushed, the gap absorbed by a widening discount. Realized volatility of 11.2% against HYG's 4.3% makes this the second-riskiest fund in the batch despite holding predominantly government-guaranteed paper.
Volatility Comparison
11.2% computed 1-year volatility against HYG's 4.3%: a fund whose core asset is the agency mortgage, a security with no credit risk, carries nearly triple the realized volatility of a junk bond ETF. Leverage explains it. At 46.46% effective leverage, rate and spread moves hit the equity tranche of this fund nearly twice as hard as they hit the underlying assets. When the Fed is actively hiking, as it just did, that is the dominant risk, and the -21.6% price return since September 2024 is the receipt.
Discount To NAV
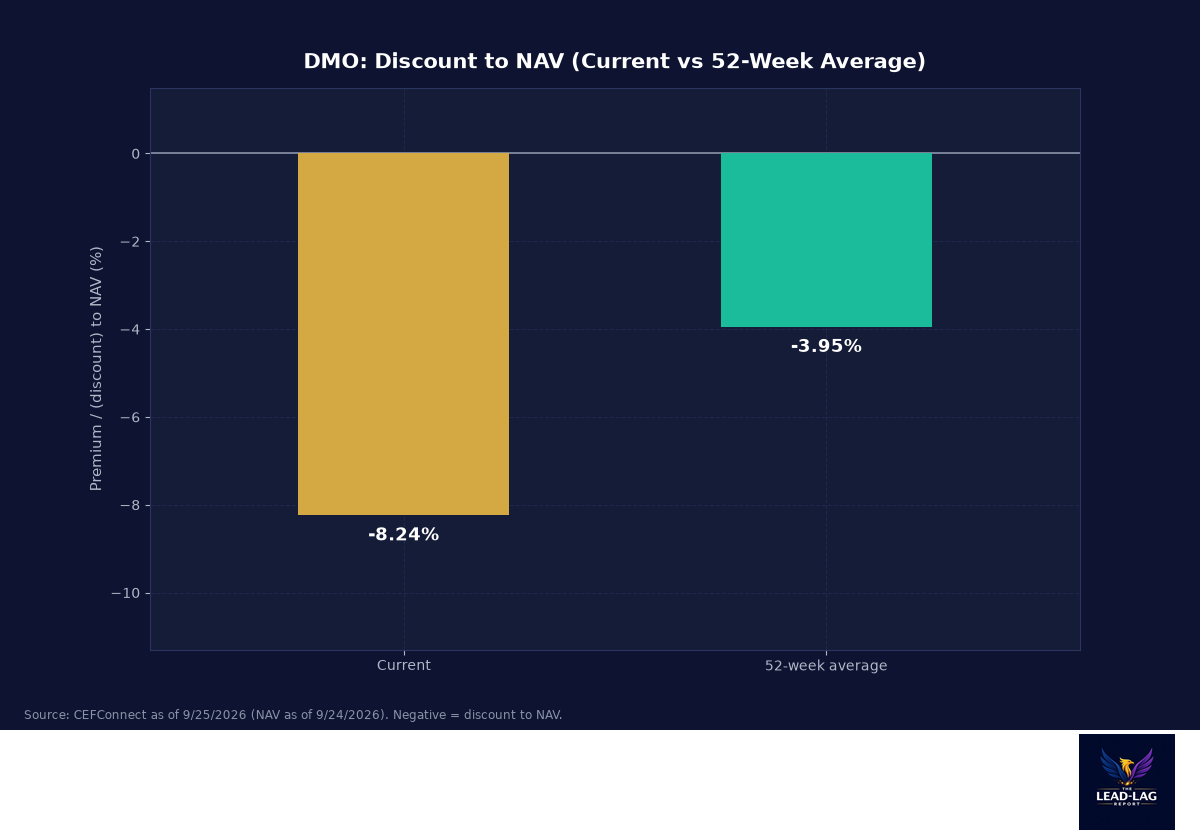
Per Franklin Templeton as of September 21, the fund's NAV is $10.99 against a $9.76 market price, a -11.19% discount. CEFConnect showed -8.24% as of September 4, against a 52-week average of just -3.95% and a 52-week range spanning +1.78% to -8.66%. The discount has widened from near-parity with its own average to roughly triple it in weeks, which is a genuinely unusual move in CEF terms and the reason this fund made this week's list. Mean reversion from -11.19% to the -3.95% average is roughly 7 points of potential price recovery, before any income.
Macro Environment
My macro framing is unforgiving on leveraged mortgage funds right now, and I will say so plainly. The Fed's September 16 hike to 3.75% to 4.00% (source: Federal Reserve) is exactly the environment in which 46.46% leverage on mortgage spread product hurts: funding costs reset upward while agency spreads themselves can widen against a hiking curve. That is the bear case, and the market discounting this fund to -11.19% is that case expressed in price. The bull case is the mirror: if the hike cycle is at or near its end, leveraged mortgage spread compression reverses violently in DMO's favor, and you would be buying that reversal at a tripled discount with a 15% indicated yield on Friday's close running while you wait. There is also a sizing asymmetry worth naming. With $126.2 million of common assets against $235.6 million of exposure per CEFConnect, this is a small fund by institutional standards, which cuts both ways: small funds reprice violently on modest flows, which explains how the discount tripled in weeks, and the same mechanism works in reverse when sentiment turns. Small CEF dislocations are the purest expression of the bet that the market's most nervous dollar is the marginal setter of your entry price. This is a rates-and-spreads trade dressed as an income fund.
Distribution Policy
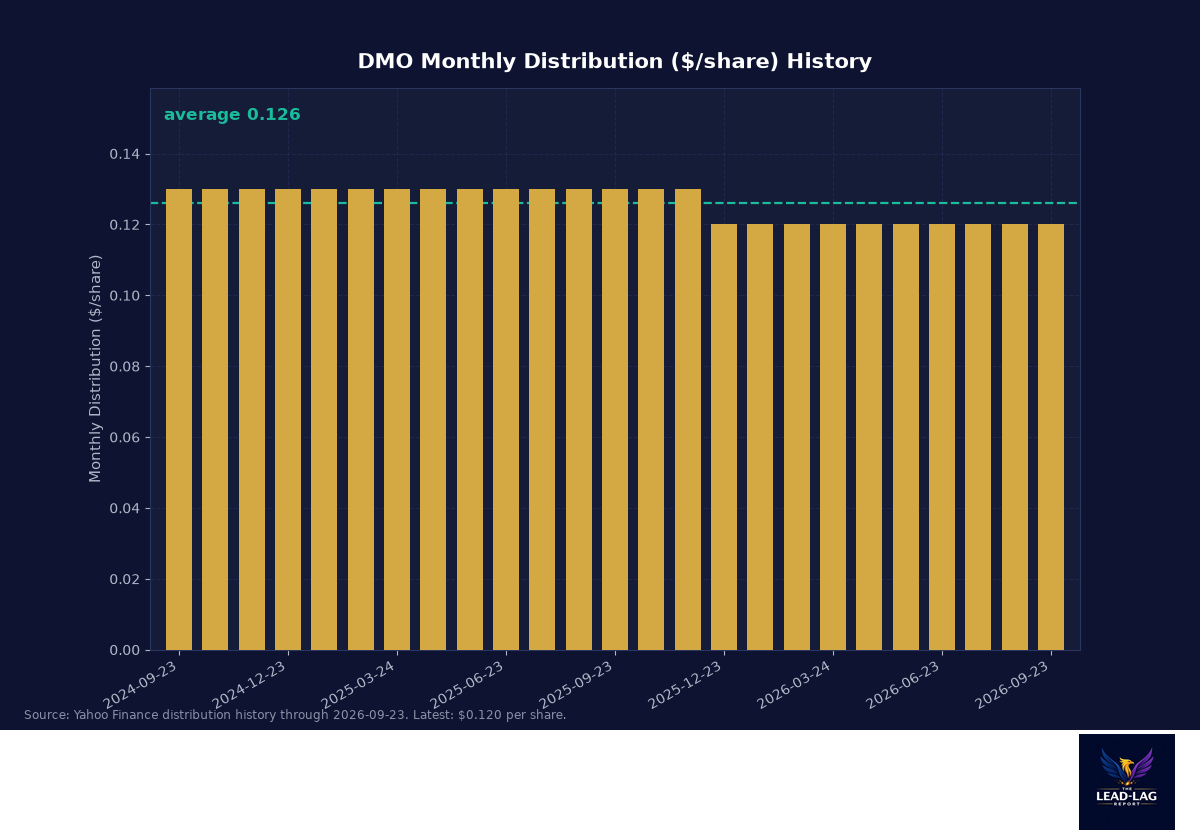
The distribution is $0.12 monthly, a 14.29% rate on the $10.08 price CEFConnect used on September 4, and 15.38% on Friday's $9.49 close computed from Yahoo Finance trailing payouts of $1.46 per share. Now the sober cross-check: the fund pays out roughly 14 to 15% of its price annually while charging 7.87% in expenses and borrowing at short-term rates against a 46.46% leveraged book. Distribution coverage in that structure comes from net investment income after that expense load, which means the margin between earned income and the payout is thin by construction. A distribution review, meaning a cut, is not a tail scenario at these numbers; it is the base-rate outcome eventually. What you are betting on is collecting enough months of $0.12 first, plus discount reversion, to clear the risk.
Advantages
The discount dislocation is genuinely extreme: -11.19% versus a -3.95% 52-week average, roughly triple the norm, offering a theoretical 7-point mean-reversion kicker on top of the income.
The portfolio behind the drama is institutional-grade securitized paper, majority agency MBS per CEFConnect, not distressed residue; credit risk is the smaller part of the story.
If the hiking cycle ends, leveraged mortgage spread product is one of the highest-beta beneficiaries of the reversal, and the 15.38% indicated yield pays you to wait for it.
Disadvantages
The 7.87% expense ratio per CEFConnect is more than half the distribution. No investment thesis survives that cost structure unchanged for long.
46.46% effective leverage into an actively hiking Fed is the single most rate-exposed configuration in this week's batch, and the -21.6% computed price return since September 2024 is the realized evidence.
The distribution math (paying 14 to 15% while expenses run 7.87%) implies a structural coverage question. The market pricing a tripled discount is telling you it expects the resolution to be a cut.
Conclusion
DMO is the highest-risk, highest-tension profile of this week's batch: an extreme discount, a real income stream, and an expense structure that quietly eats half of everything. My verdict: short-term a speculative mean-reversion trade with an unusually wide discount and monthly income while it works, long-term structurally challenged by its own cost line. This one is for investors who can mark it to market without flinching, monitor the distribution coverage each quarter, and take the reversion and leave. It is not, under any framing, a core holding.
The Lead-Lag Report is provided by Lead-Lag Publishing, LLC. All opinions and views mentioned in this report constitute our judgments as of the date of writing and are subject to change at any time. Information within this material is not intended to be used as a primary basis for investment decisions and should also not be construed as advice meeting the particular investment needs of any individual investor. Trading signals produced by the Lead-Lag Report are independent of other services provided by Lead-Lag Publishing, LLC or its affiliates, and positioning of accounts under their management may differ. Please remember that investing involves risk, including loss of principal, and past performance may not be indicative of future results. Lead-Lag Publishing, LLC, its members, officers, directors and employees expressly disclaim all liability in respect to actions taken based on any or all of the information on this writing.